Multimodal Learning in Synthetic Chemistry Applications: Gas Chromatography Retention Time Prediction and Isomer Separation Optimization
英文原文与中文译文逐段对照 · English original with Chinese translation
Jinglong Lin, ${ \dagger }^{a}$ Longyin Song, ${ \dagger }^{b}$ Yuntian Chen, ${}^{c}$ Chengchun Liu, ${}^{c}$ la Shufeng Chen ${}^{b}$ *b and Fanyang Mo b *ade
林京龙,${ \dagger }^{a}$ 宋龙银,${ \dagger }^{b}$ 陈云天,${}^{c}$ 刘丞军,${}^{c}$ 陈淑凤 ${}^{b}$ *b 和莫凡洋 b *ade
Multimodal learning, a key machine learning (ML) approach, has been extensively applied in fields such as medical diagnostics and recommendation systems. The complexity of chemical data offers unique opportunities for multimodal learning, though its application in chemistry remains underexplored. Here, we propose an innovative multimodal framework for gas chromatography (GC) that integrates a geometry-enhanced graph isomorphism network and gated recurrent units. This framework predicts GC retention time across diverse molecular heating profiles with a test set ${R}^{2}$ of 0.995, outperforming traditional ML methods. It effectively recommends optimal chromatographic conditions for separating positional isomers and cis/trans isomers, minimizing experimental iterations and significantly improving analytical efficiency. Moreover, the model provides insights into the separation challenges of various isomers, enhancing understanding of the relationship between molecular structure and chromatographic behavior. This approach could pave the way for broader applications of multimodal learning in chemistry.
多模态学习作为一种关键的机器学习(ML)方法,已在医学诊断和推荐系统等领域得到广泛应用。化学数据的复杂性为多模态学习提供了独特的机会,尽管其在化学领域的应用仍未得到充分探索。在这里,我们提出了一种创新的气相色谱(GC)多模态框架,该框架集成了几何增强的图同构网络和门控循环单元。该框架在不同分子加热曲线下预测GC保留时间,测试集 ${R}^{2}$ 为0.995,优于传统ML方法。它有效地推荐了分离位置异构体和顺/反异构体的最佳色谱条件,最大限度地减少了实验迭代次数,并显著提高了分析效率。此外,该模型还深入了解了各种异构体的分离挑战,增强了对分子结构与色谱行为之间关系的理解。这种方法可能为多模态学习在化学领域的更广泛应用铺平道路。
Check for updates
检查更新
Cite this: Digital Discovery, 2025, 4, 2465
引用本文:Digital Discovery, 2025, 4, 2465
Received 15th November 2024
2024年11月15日收到
Accepted 27th July 2025
2025年7月27日接受
DOI: 10.1039/d4dd00369a
DOI: 10.1039/d4dd00369a
rsc.li/digitaldiscovery
rsc.li/digitaldiscovery
1 Introduction
1 引言
Machine Learning (ML) technology is a technique that enables computers to learn from data and make decisions or predictions. ${}^{1,2}$ Multimodal learning, an ML approach that integrates data from different modalities such as text, images, and audio, has been widely applied in fields such as visual question answering, ${}^{3}$ emotion analysis, ${}^{4}$ and recommendation systems. ${}^{5}$ However, its application in the field of chemistry remains relatively limited. In fact, multimodal learning is particularly well-suited for addressing chemical problems due to the inherent diversity and complexity of chemical data. Chemical research involves various types of data, including molecular structures, spectroscopic data (e.g., infrared and nuclear magnetic resonance spectra), textual data (e.g., chemical equations and literature descriptions), image data (e.g., microscopic crystal structures), and numerical data from experimental conditions (e.g., temperature, pressure, concentration). By integrating diverse data modalities, multimodal learning enhances model generalizability and provides deeper insights into chemical mechanisms for more precise interpretations. This study introduces an innovative multimodal learning framework for predicting gas chromatography (GC) retention time (RT) and optimizing chromatographic conditions, serving as a concrete example of multimodal learning applications in chemical research.
机器学习(ML)技术是一种使计算机能够从数据中学习并做出决策或预测的技术。${}^{1,2}$ 多模态学习是一种机器学习方法,它整合来自文本、图像和音频等不同模态的数据,已广泛应用于视觉问答等领域,${}^{3}$ 情感分析,${}^{4}$ 以及推荐系统。${}^{5}$ 然而,其在化学领域的应用仍然相对有限。事实上,由于化学数据固有的多样性和复杂性,多模态学习特别适合解决化学问题。化学研究涉及各种类型的数据,包括分子结构、光谱数据(例如红外光谱和核磁共振光谱)、文本数据(例如化学方程式和文献描述)、图像数据(例如微观晶体结构)以及来自实验条件的数值数据(例如温度、压力、浓度)。通过整合不同的数据模态,多模态学习提高了模型的通用性,并为更精确的解释提供了对化学机制的更深入见解。本研究引入了一种创新的多模态学习框架,用于预测气相色谱(GC)保留时间(RT)并优化色谱条件,作为多模态学习在化学研究中应用的一个具体示例。
GC is a vital technique for separating and analyzing complex mixtures, ${}^{6 - 8}$ now extensively used in fields such as chemical analysis, ${}^{9}$ pharmaceutical testing, ${}^{10}$ and environmental monitoring. ${}^{11}$ The RT in GC, referring to the duration a specific component stays within the chromatographic column, is one of the key parameters for compound identification. Researchers have proposed various theories, ${}^{12}$ including thermodynamic and kinetic models, to explain analyte behavior in stationary and mobile phases and to account for RT variations under different chromatographic conditions. However, these theories rely on idealized assumptions and simplified conditions, making them challenging to apply in practical research. Therefore, there is an urgent need to develop predictive models for GC-RT to rapidly determine chromatographic conditions and enhance analytical efficiency. Recently, researchers have used ML to predict GC retention indices (GC-RI) ${}^{{13} - {16}}$ and have combined ML with techniques like Gas Chromatography-Mass Spectrometry (GC-MS) ${}^{{17} - {19}}$ and Gas Chromatography-Ion Mobility Spectrometry (GC-IMS). ${}^{20}$ However, there is currently a lack of predictive models for GC-RT. Our group has primarily focused on predicting RT in thin-layer chromatography (TLC) ${}^{21}$ and high-performance liquid chromatography (HPLC). ${}^{22}$
气相色谱是分离和分析复杂混合物的重要技术,${}^{6 - 8}$ 目前广泛应用于化学分析等领域,${}^{9}$ 药物检测,${}^{10}$ 以及环境监测。${}^{11}$ 气相色谱中的保留时间是指特定组分在色谱柱内停留的持续时间,是化合物鉴定的关键参数之一。研究人员提出了各种理论,${}^{12}$ 包括热力学和动力学模型,以解释分析物在固定相和流动相中的行为,并说明不同色谱条件下的保留时间变化。然而,这些理论依赖于理想化的假设和简化的条件,使得它们在实际研究中难以应用。因此,迫切需要开发用于气相色谱保留时间的预测模型,以快速确定色谱条件并提高分析效率。最近,研究人员使用机器学习来预测气相色谱保留指数(GC-RI)${}^{{13} - {16}}$ 并将机器学习与气相色谱-质谱联用(GC-MS)${}^{{17} - {19}}$ 和气相色谱-离子迁移谱联用(GC-IMS)等技术相结合。${}^{20}$ 然而,目前缺乏用于气相色谱保留时间的预测模型。我们小组主要专注于预测薄层色谱(TLC)${}^{21}$ 和高效液相色谱(HPLC)中的保留时间。${}^{22}$
${}^{a}$ School of Materials Science and Engineering, Peking University, Beijing,100871, P. R. China.
${}^{a}$ 中国北京大学材料科学与工程学院,北京,100871。
${}^{b}$ School of Chemistry and Chemical Engineering, Inner Mongolia University, Hohhot, 010021, P. R. China.
${}^{b}$ 中国内蒙古大学化学与化工学院,呼和浩特,010021。
${}^{c}$ Ningbo Institute of Digital Twin, Eastern Institute of Technology, Ningbo, Zhejiang 315200, P. R. China
${}^{c}$ 中国浙江省宁波市东方理工大学数字孪生宁波研究院,宁波,315200
${}^{d}$ School of Advanced Materials, Peking University Shenzhen Graduate School, Shenzhen, 518055, China
${}^{d}$ 中国北京大学深圳研究生院先进材料学院,深圳,518055
${}^{e}$ AI for Science (AI4S)-Preferred Program, Peking University Shenzhen Graduate School, Shenzhen, 518055, China
${}^{e}$ 中国北京大学深圳研究生院科学智能优选计划,深圳,518055
† These authors contributed equally.
† 这些作者贡献相同。
The factors influencing GC-RT include molecular properties, temperature conditions, and stationary phases (Fig. 1a). The multimodal learning framework is particularly suited to address these complexities. The multimodal framework developed in this work can be utilized for rapid virtual screening and recommendation under GC temperature programming conditions, identification of internal standard peak positions, and analysis of complex mixtures (Fig. 1b). Our contributions can be summarized as follows:
影响气相色谱保留时间的因素包括分子性质、温度条件和固定相(图1a)。多模态学习框架特别适合解决这些复杂性。本工作中开发的多模态框架可用于在气相色谱程序升温条件下进行快速虚拟筛选和推荐、内标峰位置的识别以及复杂混合物的分析(图1b)。我们的贡献可总结如下:
We established a Gas Chromatography Retention Time (GCRT) dataset, covering 250 compounds, 244 types of temperature programs, and 3950 retention time data. We developed a threshold filtering method, GC-PIEA, that can extract target peak information from GC chromatogram data in PDF format in batches automatically.
我们建立了一个气相色谱保留时间(GCRT)数据集,涵盖250种化合物、244种温度程序和3950个保留时间数据。我们开发了一种阈值过滤方法,即GC-PIEA,它可以自动批量从PDF格式的气相色谱图数据中提取目标峰信息。
We constructed three conventional ML models and explored model interpretability through correlation and feature importance analysis, thereby validating and uncovering physicochemical principles affecting GC-RT from a statistical perspective.
我们构建了三个传统的机器学习模型,并通过相关性和特征重要性分析探索模型可解释性,从而从统计角度验证并揭示影响气相色谱保留时间的物理化学原理。
We constructed a multimodal model where a geometry-enhanced graph isomorphism network processes molecular information and a Bidirectional GRU handles temperature curve data. This model can accurately predict the GC-RT of target molecules under different temperature programs, with a test set ${R}^{2}$ reaching up to 0.995, surpassing conventional ML models. The multimodal model demonstrates substantial robustness and generalization capabilities. Even with Gaussian noise at ${40}\%$ , the ${R}^{2}$ value on the test set remains 0.906 . Furthermore, the model achieves an ${R}^{2}$ of 0.900 in predicting entirely novel compounds under nonlinear temperature programs.
我们构建了一个多模态模型,其中几何增强的图同构网络处理分子信息,双向门控循环单元(Bidirectional GRU)处理温度曲线数据。该模型能够在不同温度程序下准确预测目标分子的气相色谱保留时间(GC-RT),测试集${R}^{2}$高达0.995,超过了传统机器学习模型。该多模态模型展现出了强大的稳健性和泛化能力。即使在${40}\%$存在高斯噪声的情况下,测试集上的${R}^{2}$值仍为0.906。此外,该模型在预测非线性温度程序下全新化合物时,${R}^{2}$值达到了0.900。
We introduced the concept of the isomer separation degree, enabling our multimodal model to rapidly perform virtual screening. This approach identifies optimal temperature programs for positional and cis/trans isomers, ensuring the fastest detection peaks while maintaining separation. Search algorithms can be utilized to explore the separation challenges of various isomers, providing new chemical insights and enhancing the understanding of the relationship between molecular structure and chromatographic behavior. This method advances chromatographic research, allowing other scientists to apply it to their isomer studies of interest.
我们引入了异构体分离度的概念,使我们的多模态模型能够快速进行虚拟筛选。这种方法可以确定位置异构体和顺反异构体的最佳温度程序,确保在保持分离的同时实现最快的检测峰。可以利用搜索算法来探索各种异构体的分离挑战,提供新的化学见解,并加深对分子结构与色谱行为之间关系的理解。这种方法推动了色谱研究的发展,使其他科学家能够将其应用于他们感兴趣的异构体研究中。
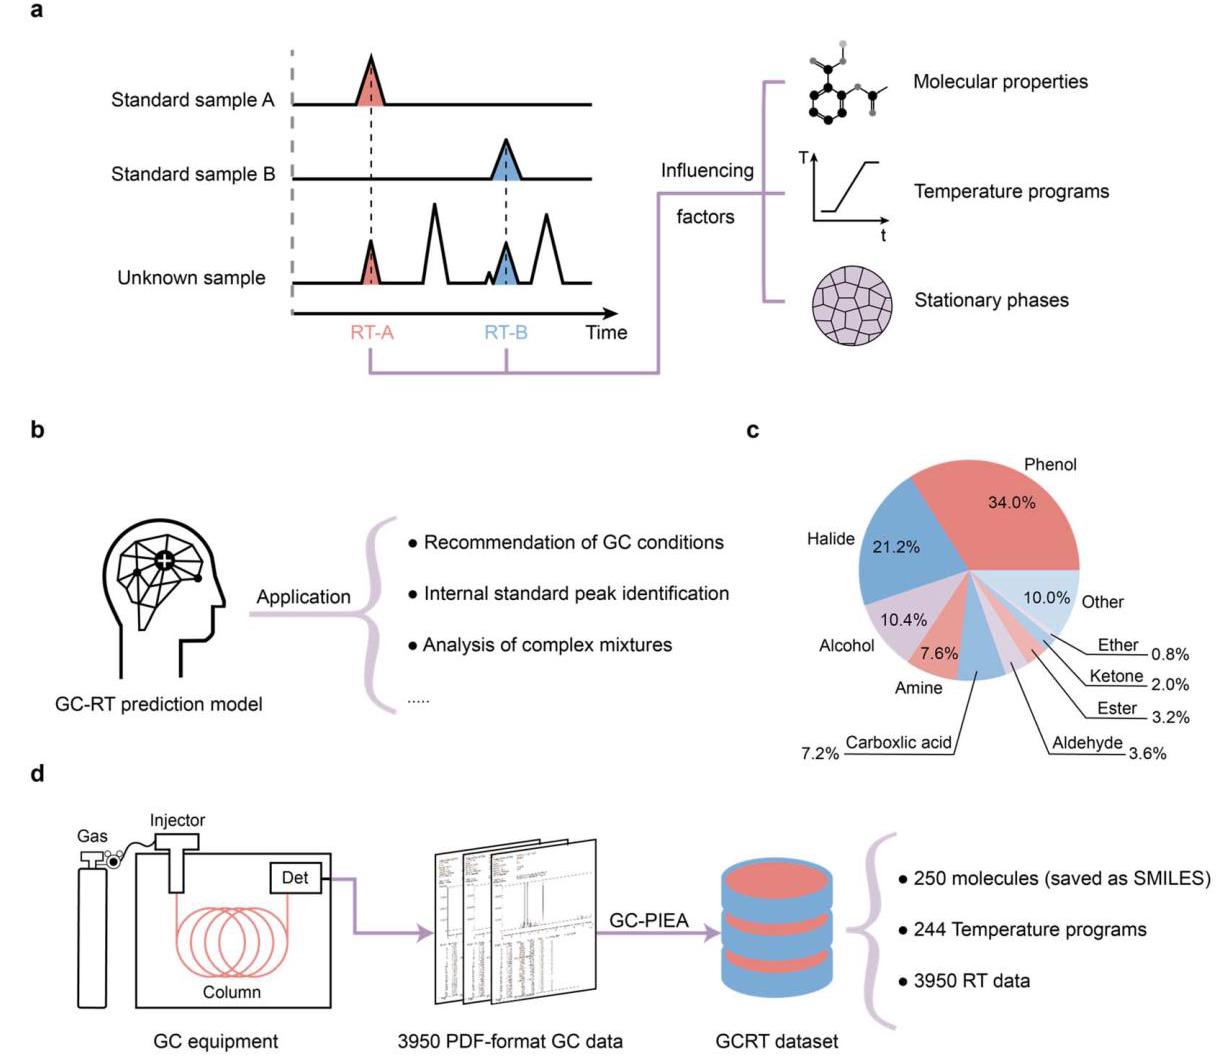
Fig. 1 The scheme for predicting RT in GC. (a) Factors influencing the GC-RT. b, Applications of GC-RT prediction model. (c) Distribution chart of compound types in the GCRT dataset. (d) Workflow for constructing the GC-RT dataset. GC-PIEA, Gas Chromatography Peak Information Extraction Algorithm.
图1 气相色谱中保留时间预测的方案。(a)影响气相色谱保留时间的因素。(b)气相色谱保留时间预测模型的应用。(c)气相色谱保留时间(GCRT)数据集中化合物类型的分布图。(d)构建气相色谱保留时间数据集的工作流程。GC-PIEA,气相色谱峰信息提取算法。
We proposed a strategy that utilizes GC-RI and temperature programs to predict GC-RT, and provided an ANN pre-trained model. Other researchers can fine-tune this model on their own tasks, thereby achieving universal RT prediction.
我们提出了一种利用气相色谱保留指数(GC-RI)和温度程序来预测气相色谱保留时间的策略,并提供了一个预训练的人工神经网络(ANN)模型。其他研究人员可以根据自己的任务对该模型进行微调,从而实现通用的保留时间预测。
2 Results and discussion
2 结果与讨论
2.1 Experiment and GCRT dataset
2.1实验与GCRT数据集
Gas chromatographic analysis was performed using a Shimadzu GC-2014C (Shimadzu Corporation, Suzhou, Jiangsu, China). Chromatographic separation was carried out on a ${30}\mathrm{\;m} \times \; {0.25}\mathrm{\;{mm}}$ WondaCAP-5 capillary column, coated internally with ${0.25\mu }\mathrm{m}$ of $5\%$ phenyl-95% dimethylpolysiloxane stationary phase. Nitrogen gas was chosen as the carrier gas, with a constant flow rate set at ${1.2}\mathrm{\;{mL}}{\mathrm{\;{min}}}^{-1}$ . A total of 244 different column temperature programs were used, which are provided in the SI Material ‘Temperature_programs.csv’. The dual flame ionization detector (DFID) was operated with hydrogen at 40 $\mathrm{{mL}}{\mathrm{{min}}}^{-1}$ , air at ${400}\mathrm{\;{mL}}{\mathrm{{min}}}^{-1}$ , and a tail gas flow rate of 30 $\mathrm{{mL}}{\mathrm{{min}}}^{-1}$ , with the detector temperature set at ${300}{}^{ \circ }\mathrm{C}$ to ensure excellent ionization efficiency. All data were processed and analyzed using the GC Solution software provided by Shimadzu Corporation.
使用岛津GC - 2014C(岛津公司,中国江苏苏州)进行气相色谱分析。色谱分离在一根${30}\mathrm{\;m} \times \; {0.25}\mathrm{\;{mm}}$的WondaCAP - 5毛细管柱上进行,柱内涂覆有${0.25\mu }\mathrm{m}$的$5\%$苯基 - 95%二甲基聚硅氧烷固定相。选择氮气作为载气,设定恒定流速为${1.2}\mathrm{\;{mL}}{\mathrm{\;{min}}}^{-1}$。总共使用了244种不同的柱温程序,这些程序在补充材料“Temperature_programs.csv”中提供。双火焰离子化检测器(DFID)在氢气流量为40 $\mathrm{{mL}}{\mathrm{{min}}}^{-1}$、空气流量为${400}\mathrm{\;{mL}}{\mathrm{{min}}}^{-1}$、尾气流速为30 $\mathrm{{mL}}{\mathrm{{min}}}^{-1}$的条件下运行,检测器温度设定为${300}{}^{ \circ }\mathrm{C}$以确保优异的电离效率。所有数据均使用岛津公司提供的GC Solution软件进行处理和分析。
The sample preparation process was precise and meticulous. Initially, ${0.5}\mathrm{{mmol}}$ of the sample was dissolved in $1\mathrm{\;{mL}}$ of ethyl acetate. Then, approximately ${0.05}\mathrm{\;{mL}}$ of this solution was extracted using a disposable pipette and dropped into a dedicated sample vial, which was subsequently diluted to the mark with $1\mathrm{\;{mL}}$ of ethyl acetate. The sample was injected in a volume of ${1\mu }\mathrm{L}$ , employing a 20 : 1 split injection mode, with the injector temperature set at ${250}^{ \circ }\mathrm{C}$ .
样品制备过程精确细致。首先,将${0.5}\mathrm{{mmol}}$的样品溶解在$1\mathrm{\;{mL}}$的乙酸乙酯中。然后,用一次性移液器吸取约${0.05}\mathrm{\;{mL}}$的该溶液,滴入专用样品瓶中,随后用$1\mathrm{\;{mL}}$的乙酸乙酯稀释至刻度。以20 : 1的分流进样模式进样${1\mu }\mathrm{L}$体积的样品,进样器温度设定为${250}^{ \circ }\mathrm{C}$。
The GC chromatogram data obtained using specific devices and methods have been saved in PDF format. To efficiently extract and batch-process key information from these PDF-format chromatograms, we have developed a new algorithm: Gas Chromatography Peak Information Extraction Algorithm (GC-PIEA), as detailed in Section 1 of the SI Materials. This algorithm first converts the text in the chromatograms into strings, then filters data by setting a threshold for peak area, thereby accurately locating the position of the target peak and extracting key parameters such as RT, peak height, and peak area.
使用特定设备和方法获得的气相色谱图数据已保存为PDF格式。为了从这些PDF格式的色谱图中高效提取和批量处理关键信息,我们开发了一种新算法:气相色谱峰信息提取算法(GC - PIEA),如补充材料第1节所述。该算法首先将色谱图中的文本转换为字符串,然后通过设置峰面积阈值过滤数据,从而准确确定目标峰的位置并提取诸如保留时间(RT)、峰高和峰面积等关键参数。
The temperature program is originally a time-series data set $\left( {T - t}\right)$ . We have processed the temperature programs of all data points into series of 32 time steps each, corresponding to the temperatures for 1 to 32 minutes. Furthermore, to enhance the data’s usability, molecular information is stored in SMILES format. Based on these methods, we have constructed the Gas Chromatography Retention Time (GCRT) dataset. This dataset comprises 3950 RT data points for 250 different compounds under various temperature programs, with the distribution of compounds illustrated in Fig. 1c and the dataset construction process shown in Fig. 1d.
温度程序原本是一个时间序列数据集$\left( {T - t}\right)$。我们已将所有数据点的温度程序处理为每个包含32个时间步长的序列,对应于1至32分钟的温度。此外,为了提高数据的可用性,分子信息以SMILES格式存储。基于这些方法,我们构建了气相色谱保留时间(GCRT)数据集。该数据集包含在各种温度程序下250种不同化合物的3950个保留时间数据点,化合物的分布如图1c所示,数据集构建过程如图1d所示。
2.2 Construction of conventional ML models and model interpretability research
2.2 传统机器学习模型的构建与模型可解释性研究
To compare with the multimodal model and explore model interpretability, we constructed three conventional ML algorithms as baselines, namely Random Forest (RF), LightGBM (LGB), and Artificial Neural Network (ANN). In the RF and LGB models, we adopted a random split for the training-to-test set ratio of 9:1 and utilized 10-fold cross-validation on the training set to determine the optimal hyperparameters. For the ANN model, we designed a structure with two hidden layers and incorporated batch normalization and dropout techniques (see Section 2 of the SI Materials for details), setting a random split for the training, validation, and test set ratio of $8 : 1 : 1$ . The model’s input features total ten dimensions (Fig. 2a), six of which are based on the physicochemical properties of molecules, covering aspects such as polarity and hydrophobicity. These features include Molecular Weight (MW), Topological Polar Surface Area (TPSA), Number of Hydrogen Bond Acceptors (HBA), Number of Hydrogen Bond Donors (HBD), Number of Rotatable Bonds (NROTB), and lipid-water partition coefficient (Log P). These features were selected due to their potential correlation with the compounds’ RT in GC. For instance, MW influences boiling points, thereby affecting the migration speed and volatility of compounds within the chromatographic column; Log $P$ is a key descriptor for assessing the hydrophobicity of compounds, which influences their hydrophobic interactions with non-polar stationary phases. All these descriptors were calculated using the RDKit library in Python. The remaining four dimensions are temperature program features, including initial temperature, final temperature, heating rate, and duration of initial temperature, all of which directly impact the analysis outcome in GC. In this study, the efficacy of feature engineering was corroborated from a modeling perspective, as evidenced by the exemplary performance on the test set of three ML models (Fig. 2b): $\operatorname{RF}\left( {{R}^{2} = }\right.$ 0.950), LGB $\left( {{R}^{2} = {0.919}}\right)$ , and ANN $\left( {{R}^{2} = {0.925}}\right)$ .
为了与多模态模型进行比较并探索模型的可解释性,我们构建了三种传统机器学习算法作为基线,即随机森林(RF)、LightGBM(LGB)和人工神经网络(ANN)。在RF和LGB模型中,我们采用随机分割,训练集与测试集的比例为9:1,并在训练集上使用10折交叉验证来确定最优超参数。对于ANN模型,我们设计了一个具有两个隐藏层的结构,并纳入了批量归一化和随机失活技术(详见补充材料第2节),训练集、验证集和测试集的随机分割比例为$8 : 1 : 1$ 。模型的输入特征共有十个维度(图2a),其中六个基于分子的物理化学性质,涵盖极性和疏水性等方面。这些特征包括分子量(MW)、拓扑极性表面积(TPSA)、氢键受体数量(HBA)、氢键供体数量(HBD)、可旋转键数量(NROTB)和脂水分配系数(Log P)。选择这些特征是因为它们与化合物在气相色谱中的保留时间可能存在相关性。例如,MW影响沸点,从而影响化合物在色谱柱内的迁移速度和挥发性;Log $P$ 是评估化合物疏水性的关键描述符,它影响化合物与非极性固定相的疏水相互作用。所有这些描述符均使用Python中的RDKit库计算得出。其余四个维度是程序升温特征,包括初始温度、最终温度、升温速率和初始温度持续时间,所有这些都直接影响气相色谱的分析结果。在本研究中,从建模角度证实了特征工程的有效性,可以从三个机器学习模型在测试集上的优异性能得到证明(图2b):$\operatorname{RF}\left( {{R}^{2} = }\right.$ 0.950),LGB $\left( {{R}^{2} = {0.919}}\right)$ ,ANN $\left( {{R}^{2} = {0.925}}\right)$ 。
To further investigate the predictive performance of conventional ML models on unknown compounds, we employed the compound split method (Fig. S1). The compound split method refers to dividing a dataset based on the SMILES of compounds, ensuring that compounds in the test set are never seen in the training set. This ensures that the model’s evaluation is based on entirely novel chemical entities, enhancing the robustness and generalizability of the results. For the applications of RF and LGB, we set the ratio of training to test sets at 9 : 1; for the ANN, the data were divided into training, validation, and test set with respective ratios of $8 : 1 : 1$ . The models’ performance on the test sets can be found in Section 4 of the SI Materials, under Fig. S2, where the ${R}^{2}$ values are 0.878 for RF, 0.885 for LGB, and 0.852 for ANN.
为了进一步研究传统机器学习模型对未知化合物的预测性能,我们采用了化合物分割方法(图S1)。化合物分割方法是指根据化合物的SMILES对数据集进行划分,确保测试集中的化合物在训练集中从未出现过。这确保了模型的评估基于全新的化学实体,增强了结果的稳健性和通用性。对于RF和LGB的应用,我们将训练集与测试集的比例设置为9:1;对于ANN,数据被分为训练集、验证集和测试集,各自的比例为$8 : 1 : 1$ 。模型在测试集上的性能可以在补充材料第4节图S2中找到,其中RF的${R}^{2}$ 值为0.878,LGB为0.885,ANN为0.852。
In our investigation into model interpretability, we began by computing the feature correlation matrix (Fig. 2c), uncovering significant positive correlations between HBA, HBD, and TPSA, as well as between $\log P$ and MW. Furthermore, the evident negative correlations between TPSA, HBA, and $\log P$ , along with near-zero correlation coefficients among other features, highlighted the independence among features. In the following analysis, we focus on the assessment of feature importance. Given the superior performance of the RF model among the three conventional ML approaches, we employed the GCRT dataset and RF model to compute the mean absolute SHapley Additive exPlanations (SHAP) values of various molecular descriptors, thereby quantifying the importance of each feature. The normalized importance ratios of these features are illustrated in Fig. 2d. The concept of SHAP values originates from Shapley values in game theory, which are a cooperative game theory tool designed to fairly allocate the contributions of each participant to a collective outcome. In this study, each molecular descriptor was considered a “player”. The definition of Shapley values is as follows:
在我们对模型可解释性的研究中,我们首先计算了特征相关矩阵(图2c),发现HBA、HBD和TPSA之间以及$\log P$ 和MW之间存在显著的正相关。此外,TPSA、HBA和$\log P$ 之间明显的负相关,以及其他特征之间接近零的相关系数,突出了特征之间的独立性。在接下来的分析中,我们专注于特征重要性的评估。鉴于RF模型在三种传统机器学习方法中表现优异,我们使用GCRT数据集和RF模型来计算各种分子描述符的平均绝对SHapley加性解释(SHAP)值,从而量化每个特征的重要性。这些特征的归一化重要性比率如图2d所示。SHAP值的概念源于博弈论中的Shapley值,它是一种合作博弈论工具,旨在公平地分配每个参与者对集体结果的贡献。在本研究中,每个分子描述符都被视为一个“参与者”。Shapley值的定义如下:
$$ {\phi }_{i}\left( v\right) = \mathop{\sum }\limits_{{S \subseteq N/\{ i\} }}\frac{\left| S\right| !\left( {\left| N\right| - \left| S\right| - 1}\right) !}{\left| N\right| !}\left( {v\left( {S\cup \{ i\} }\right) - v\left( S\right) }\right) \tag{1} $$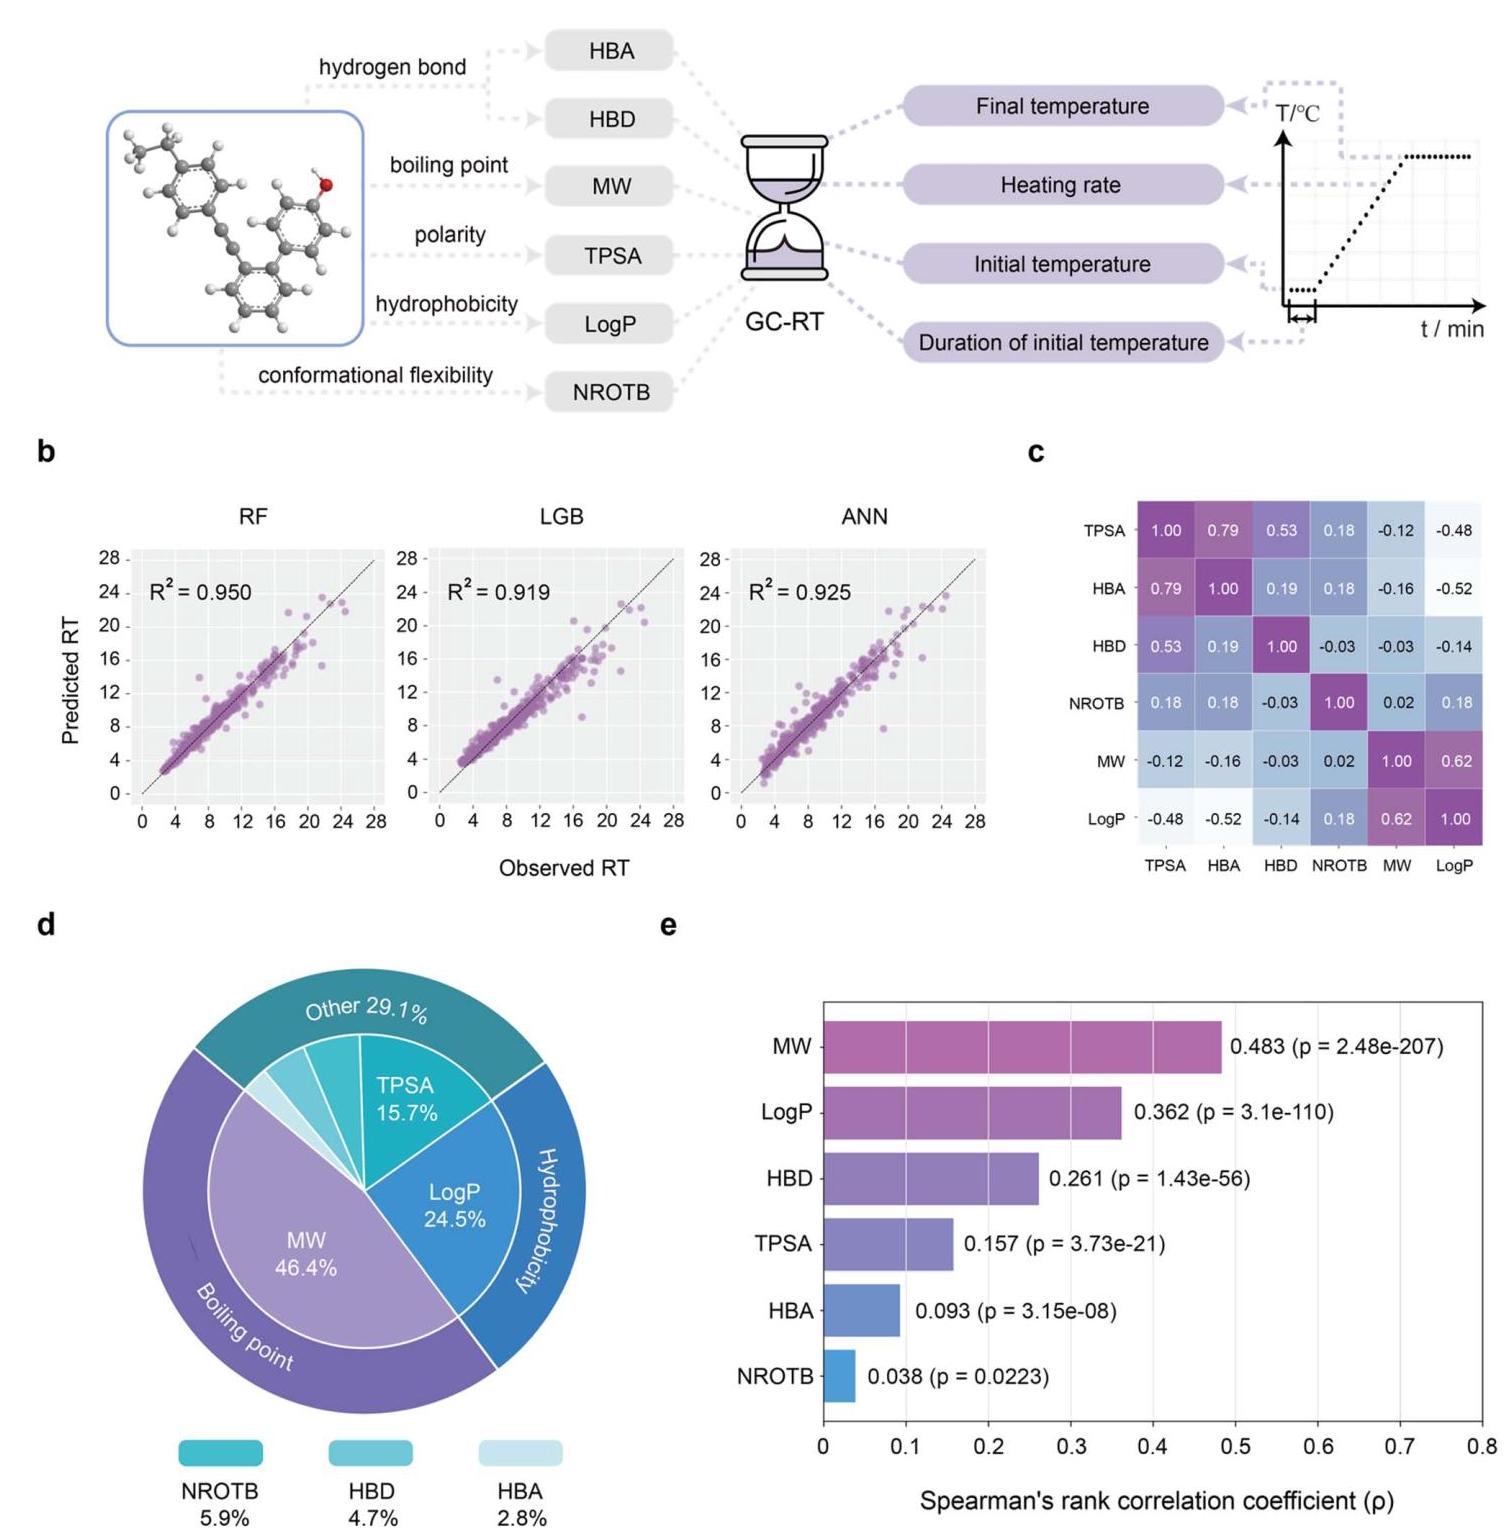
Fig. 2 Conventional ML performance and model interpretability study. (a) Feature engineering schema involving 10 dimensions, comprising 6 molecular descriptors and 4 temperature program features. MW, molecular weight; TPSA, topological polar surface area; HBA, number of hydrogen bond acceptors; HBD, number of hydrogen bond donors; NROTB, number of rotatable bonds; Log P, lipid-water partition coefficient. (b) Predictive performance of three ML models on the test set. (c) Correlation matrix for molecular descriptors. (d) Normalized importance of molecular descriptors (based on the GCRT dataset and RF model with SHAP value analysis). (e) Correlation analysis between molecular descriptors and RT, considering a moderate positive correlation when $\rho > {0.3}$ and the conclusion significant at $p$ -value $< {0.001}$ .
图2 传统机器学习性能与模型可解释性研究。(a) 涉及10个维度的特征工程架构,包括6个分子描述符和4个程序升温特征。MW,分子量;TPSA,拓扑极性表面积;HBA,氢键受体数量;HBD,氢键供体数量;NROTB,可旋转键数量;Log P,脂水分配系数。(b) 三个机器学习模型在测试集上的预测性能。(c) 分子描述符的相关矩阵。(d) 分子描述符的归一化重要性(基于GCRT数据集和具有SHAP值分析的随机森林模型)。(e) 分子描述符与保留时间之间的相关性分析,当$\rho > {0.3}$时考虑中等正相关,且在$p$ -值$< {0.001}$时结论显著。
where $N$ represents the set of all features, $S$ denotes any subset of features that does not include feature $i, v\left( S\right)$ is the contribution of the subset $S$ within the model (i.e., the model’s predictive output), and ${\phi }_{i}$ is the Shapley value of feature $i$ , which quantifies its average marginal contribution to the model’s output. The results indicate that MW (46.4%), Log P (24.5%), and TPSA (15.7%) are the three features with the most significant impact on the RT. This finding underscores the key role of a molecule’s molecular weight, hydrophobicity, and polarity in influencing RT. Subsequently, we conducted an analysis of the correlation between molecular descriptors and RT, specifically using the Spearman rank correlation coefficient $\left( \rho \right)$ to measure the relationship between each feature and RT (Fig. 2e). The $\rho$ value ranges from [-1,1], where $\rho > 0$ indicates a positive correlation, and $\rho < 0$ indicates a negative correlation. The analysis reveals that MW and Log $P$ show a moderate positive correlation with RT $\left( {\rho > {0.3}}\right)$ , and their $p$ -values are significantly less than 0.001, lending statistical significance to our findings and further validating the reliability of our discoveries. All these findings are derived entirely from a data-driven analysis.
其中$N$表示所有特征的集合,$S$表示不包括特征$i, v\left( S\right)$的任何特征子集,$i, v\left( S\right)$是子集$S$在模型中的贡献(即模型的预测输出),${\phi }_{i}$是特征$i$的Shapley值,它量化了其对模型输出的平均边际贡献。结果表明,MW(46.4%)、Log P(24.5%)和TPSA(15.7%)是对保留时间影响最显著的三个特征。这一发现强调了分子的分子量、疏水性和极性在影响保留时间方面的关键作用。随后,我们对分子描述符与保留时间之间的相关性进行了分析,具体使用斯皮尔曼等级相关系数$\left( \rho \right)$来衡量每个特征与保留时间之间的关系(图2e)。$\rho$值范围为[-1,1],其中$\rho > 0$表示正相关,$\rho < 0$表示负相关。分析表明,MW和Log$P$与保留时间$\left( {\rho > {0.3}}\right)$呈现中等正相关,且它们的$p$ -值显著小于0.001,为我们的发现提供了统计学意义,并进一步验证了我们发现的可靠性。所有这些发现完全来自于数据驱动的分析。
We provided a chemical rationale for these findings: molecules with higher MW typically exhibit higher boiling points due to stronger van der Waals forces among them, requiring more energy to overcome these forces and transition into the gas phase. This implies that compounds with larger MW tend to linger longer in the stationary phase, as they are more challenging to be transported by the carrier gas, thereby resulting in extended RT. The study utilized a 5% phenyl-95% di-methylpolysiloxane chromatography column, offering an analytical environment ranging from nonpolar to medium polarity. Molecules with higher $\log P$ values, due to their stronger hydrophobicity, are more likely to interact with the stationary phase, leading to an increase in RT. The positive correlation between Log $P$ and MW (correlation coefficient of 0.62) further reveals the synergistic effect of $\log P$ and MW in prolonging the RT of molecules.
我们为这些发现提供了化学原理:分子量较高的分子通常由于其分子间较强的范德华力而具有较高的沸点,需要更多能量来克服这些力并转变为气相。这意味着分子量较大的化合物往往在固定相中停留更长时间,因为它们更难被载气输送,从而导致保留时间延长。该研究使用了5%苯基 - 95%二甲基聚硅氧烷色谱柱,提供了一个从非极性到中等极性的分析环境。$\log P$值较高的分子,由于其较强的疏水性,更有可能与固定相相互作用,导致保留时间增加。Log$P$与MW之间的正相关(相关系数为0.62)进一步揭示了$\log P$和MW在延长分子保留时间方面的协同作用。
2.3 Construction of the multimodal model
2.3 多模态模型的构建
Multimodal learning is a method that combines and analyzes data from different modalities, such as text, images, and sound, to enhance learning effectiveness and understanding. In our task, which involves predicting the RT of molecules under various temperature programs, molecular data and temperature program data belong to two distinct modalities. Therefore, we have developed a multimodal model (Fig. 3b) to process and integrate information from these two modalities.
多模态学习是一种结合和分析来自不同模态(如文本、图像和声音)的数据以提高学习效果和理解的方法。在我们的任务中,涉及预测各种温度程序下分子的保留时间,分子数据和温度程序数据属于两种不同的模态。因此,我们开发了一个多模态模型(图3b)来处理和整合来自这两种模态的信息。
Molecules are naturally represented as graphs, with atoms as nodes and chemical bonds as edges, making them particularly suited for processing with graph neural networks. Previous researchers have conducted extensive work in the field of molecular graph representation learning. ${}^{{23} - {26}}$ In the molecular processing branch, we utilize a Geometry-enhanced Graph Isomorphism Network (GeoGIN) framework. Two graphs comprehensively represent molecular information: the atom-bond graph, showing the connections between atoms, and the bond-angle graph, which includes information on the molecule’s 3D conformation. The embeddings of nodes and edges for the atom-bond graph and the bond-angle graph are illustrated in Fig. 3a. In the atom-bond graph, node features include formal charge, implicit valence, hybridization, and aromaticity of atoms, among others, while edge features encompass chemical bond types and ring presence, among others. In the bond-angle graph, in addition to calculating bond angles, edge features also embed molecular descriptor information, such as the TPSA and Relative Polar Surface Area (RPSA), merging spatial information with physicochemical properties. Given that chromatographic RT prediction is a structure-sensitive task, we used the Graph Isomorphism Network (GIN) as the molecular encoder to extract features of the graph structure. The key idea of GIN is to distinguish different molecular graph structures more precisely through its message passing and aggregation mechanism, even when these structures appear similar in conventional graph neural networks (like GCN or GAT). In our designed architecture, both atom-bond and bond-angle graphs are processed deeply using five-layer GIN. Through this approach, we have conducted meticulous feature extraction for each graph. Upon completion, sum pooling is employed to aggregate the extracted features, obtaining the embedding representation of the graphs. Subsequently, the embedding representations of the atom-bond and bond-angle graphs are fused to generate a 128-dimensional feature vector. This feature vector accurately captures the structural information and chemical properties of the molecule, laying a solid foundation for subsequent analysis and applications.
分子自然地表示为图,原子作为节点,化学键作为边,这使得它们特别适合用图神经网络进行处理。以前的研究人员在分子图表示学习领域进行了广泛的工作。${}^{{23} - {26}}$ 在分子处理分支中,我们使用几何增强图同构网络(GeoGIN)框架。两个图全面表示分子信息:原子 - 键图,显示原子之间的连接,以及键角图,其中包括分子三维构象的信息。原子 - 键图和键角图的节点和边的嵌入在图3a中示出。在原子 - 键图中,节点特征包括原子的形式电荷、隐含价、杂化和芳香性等,而边特征包括化学键类型和环的存在等。在键角图中,除了计算键角外,边特征还嵌入分子描述符信息,如拓扑极性表面积(TPSA)和相对极性表面积(RPSA),将空间信息与物理化学性质合并。鉴于色谱保留时间预测是一个结构敏感任务,我们使用图同构网络(GIN)作为分子编码器来提取图结构的特征。GIN的关键思想是通过其消息传递和聚合机制更精确地区分不同的分子图结构,即使这些结构在传统图神经网络(如GCN或GAT)中看起来相似。在我们设计的架构中,原子 - 键图和键角图都使用五层GIN进行深度处理。通过这种方法,我们对每个图进行了细致的特征提取。完成后,采用求和池化来聚合提取的特征,获得图的嵌入表示。随后,将原子 - 键图和键角图的嵌入表示融合以生成一个128维特征向量。这个特征向量准确地捕获了分子的结构信息和化学性质,为后续分析和应用奠定了坚实的基础。
In the experimental conditions processing branch, we employ a Bidirectional GRU (Bi-GRU) to handle the temperature programs. Bi-GRU, a lightweight recurrent neural network, is highly effective for extracting series features due to its ability to capture temporal dependencies in data. In our study, by applying average pooling operations along the temporal dimension to the hidden state vectors extracted by Bi-GRU, we successfully obtained a vectorized representation of the temperature program. Subsequently, we employed an attention-weighted fusion strategy that dynamically determines the feature weights of two separate branches: the feature weight for the Bi-GRU branch is denoted as ${\omega }_{1}$ , while the feature weight for the GeoGIN branch is represented as ${\omega }_{2}$ . Through this method, we obtained a 128-dimensional fused feature vector that integrates information from both the temperature program and molecular graphs. Considering the differences in feature distributions extracted by Bi-GRU and GeoGIN, we utilized two residual blocks to further enhance the fusion of these two types of features. The use of residual blocks aims to reduce information loss while increasing the model’s adaptability to and integration of feature differences. This step ensures that the fused features more comprehensively represent the attributes of the input data. Finally, these meticulously fused features are fed into a fully connected neural network. The output layer of this network features a single neuron, tasked with delivering the predicted RT. Techniques like Batch Normalization, Layer Normalization, and dropout are applied to prevent overfitting and accelerate convergence. All the aforementioned designs not only improve the accuracy of predictions but also provide richer information for decision-making.
在实验条件处理分支中,我们使用双向门控循环单元(Bi - GRU)来处理温度程序。Bi - GRU是一种轻量级循环神经网络,由于其能够捕获数据中的时间依赖性,因此对于提取序列特征非常有效。在我们的研究中,通过对Bi - GRU提取的隐藏状态向量沿时间维度应用平均池化操作,我们成功获得了温度程序的矢量化表示。随后,我们采用注意力加权融合策略,动态确定两个独立分支的特征权重:Bi - GRU分支的特征权重表示为${\omega }_{1}$,而GeoGIN分支的特征权重表示为${\omega }_{2}$。通过这种方法,我们获得了一个128维的融合特征向量,该向量整合了温度程序和分子图的信息。考虑到Bi - GRU和GeoGIN提取的特征分布的差异,我们使用两个残差块来进一步增强这两种类型特征的融合。使用残差块的目的是减少信息损失,同时提高模型对特征差异的适应性和整合能力。这一步确保融合特征更全面地表示输入数据的属性。最后,这些精心融合的特征被输入到一个全连接神经网络中。该网络的输出层有一个神经元,负责输出预测的保留时间。应用诸如批量归一化、层归一化和随机失活等技术来防止过拟合并加速收敛。上述所有设计不仅提高了预测的准确性,还为决策提供了更丰富的信息。
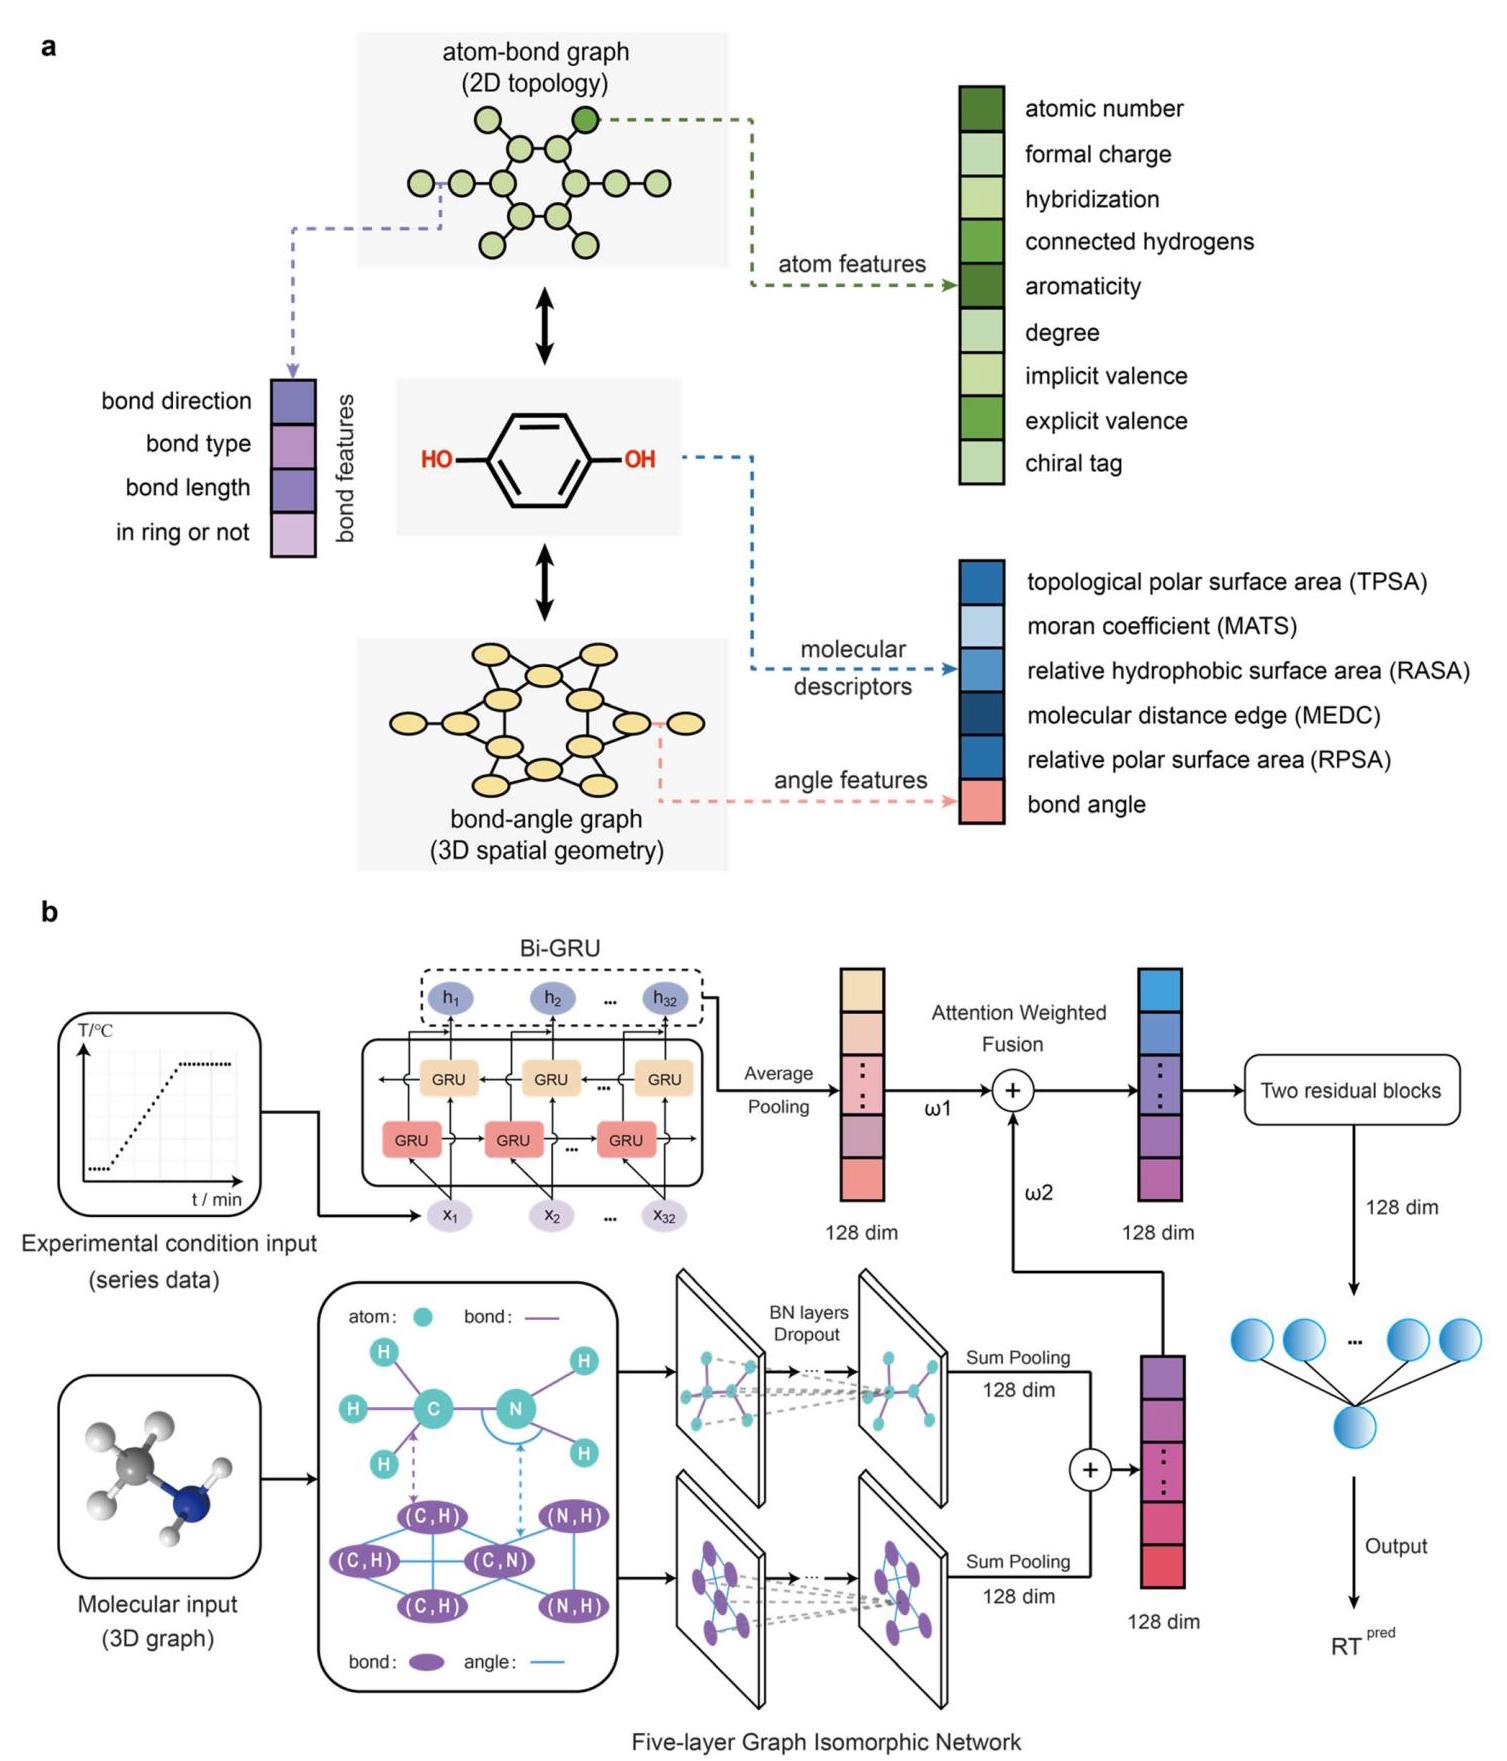
Fig. 3 Multimodal model architecture design. (a) Node and edge embeddings in atom-bond graphs and bond-angle graphs incorporate atom features, bond features, bond angle features, and molecular descriptors, facilitating comprehensive molecular structure characterization. (b) The multimodal model is divided into two branches. In the molecular processing branch, molecules are first represented as atom-bond graphs and bond-angle graphs, which are then processed through GINs. In the experimental conditions processing branch, time series information of temperature over time $\left( {T - t}\right)$ is handled through a Bi-GRU. The multimodal model learns the weights of both branches through attention layers and finally integrates the information through residual blocks to output the prediction results.
图3多模态模型架构设计。(a)原子 - 键图和键角图中的节点和边嵌入包含原子特征、键特征、键角特征和分子描述符,便于全面表征分子结构。(b)多模态模型分为两个分支。在分子处理分支中,分子首先表示为原子 - 键图和键角图,然后通过GIN进行处理。在实验条件处理分支中,温度随时间$\left( {T - t}\right)$的时间序列信息通过Bi - GRU处理。多模态模型通过注意力层学习两个分支的权重,最后通过残差块整合信息以输出预测结果。
2.4 Performance of multimodal model
2.4 多模态模型的性能
In the multimodal model, the dataset was subjected to a random split into training, validation, and test set in an 8 : 1: 1 ratio. As illustrated in Fig. 4a, the model achieved an ${R}^{2}$ value of 0.995 on the test set, significantly surpassing the performance of conventional ML algorithms. An outlier analysis (see Section 5 of the SI Materials for details) was also performed to investigate the 6 samples with prediction errors greater than 1 minute. The results indicate that the model has limitations in predicting high molecular weight (MW > 200) and highly polar compounds. To further evaluate the model’s generalization capabilities towards unknown compounds and to prevent data leakage, we implemented a novel dataset division strategy: 80% of the compound data was designated for training, with 10% allocated for testing and another 10% for validation. Following this approach, the model demonstrated an ${R}^{2}$ value of 0.931 on the test set (Fig. 4b), exhibiting excellent predictive performance and robust generalization to unknown compounds, significantly surpassing the performance of conventional ML algorithms. Above outcomes indicate that architecture of the proposed multimodal model effectively integrates diverse modal information, demonstrating a robust capability to learn the mappings among different variables, significantly augments the model’s predictive accuracy for RT.
在多模态模型中,数据集按8:1:1的比例随机划分为训练集、验证集和测试集。如图4a所示,该模型在测试集上的${R}^{2}$值达到0.995,显著超过了传统机器学习算法的性能。我们还进行了离群值分析(详见补充材料第5节),以研究预测误差大于1分钟的6个样本。结果表明,该模型在预测高分子量(MW>200)和高极性化合物方面存在局限性。为了进一步评估该模型对未知化合物的泛化能力并防止数据泄露,我们实施了一种新颖的数据集划分策略:80%的化合物数据用于训练,10%用于测试,另外10%用于验证。按照这种方法,该模型在测试集上的${R}^{2}$值为0.931(图4b),对未知化合物表现出优异的预测性能和强大的泛化能力,显著超过了传统机器学习算法的性能。上述结果表明,所提出的多模态模型架构有效地整合了多种模态信息,展示了学习不同变量之间映射的强大能力,显著提高了模型对保留时间的预测准确性。
Additionally, we investigated the robustness of our model by evaluating its performance across different training set ratios and Gaussian noise levels. The method for adding noise to the data is as follows:
此外,我们通过评估模型在不同训练集比例和高斯噪声水平下的性能来研究其鲁棒性。向数据中添加噪声的方法如下:
$$ \widehat{X} = X + \varepsilon \cdot \operatorname{std}\left( X\right) \cdot N\left( {0,1}\right) \tag{2} $$where $\widehat{X}$ represents the noise features of the temperature programs, $X$ denotes the experimental features of the temperature programs, $\varepsilon$ is the Gaussian noise ratio, $\operatorname{std}\left( X\right)$ is the standard deviation of the features, and $N\left( {0,1}\right)$ refers to the normal distribution. As shown in Fig. 4c, the ${R}^{2}$ value on the test set increases with the rising proportion of the training set. When the proportion of training data reaches ${60}\%$ , the ${R}^{2}$ value on the test set already exceeds 0.99 . Additionally, the multimodal model demonstrates excellent robustness to noise in chromatographic experimental conditions: even with the introduction of 40% Gaussian noise, the ${R}^{2}$ value remains above 0.90 , indicating robust performance of the model.
其中$\widehat{X}$表示温度程序的噪声特征,$X$表示温度程序的实验特征,$\varepsilon$是高斯噪声比例,$\operatorname{std}\left( X\right)$是特征的标准差,$N\left( {0,1}\right)$指正态分布。如图4c所示,测试集上的${R}^{2}$值随着训练集比例的增加而增加。当训练数据比例达到${60}\%$时,测试集上的${R}^{2}$值已经超过0.99。此外,多模态模型在色谱实验条件下对噪声表现出优异的鲁棒性:即使引入40%的高斯噪声,${R}^{2}$值仍保持在0.90以上,表明该模型具有强大的性能。
Although our model was initially trained on linear temperature program data, to assess its adaptability to nonlinear heating processes, we conducted further tests. We specifically selected eight nonlinear temperature programs and ten compounds that were distinctly not included in the GCRT dataset. This choice underscores the compounds’ novelty, ensuring a rigorous evaluation of the model’s performance on entirely new chemical entities. As shown in Fig. 4d, the temperature programs were categorized into rapid nonlinear (reaching final temperature within 8 minutes, represented in red) and slow nonlinear (reaching final temperature after 10 minutes, represented in purple). The orange area represents the coverage of linear temperature programs within the training set. Notably, two of the rapid nonlinear curves fall outside this coverage area. Encouragingly, the test results demonstrated that the multimodal model was able to accurately predict the RT of unknown compounds under various nonlinear conditions, achieving an ${R}^{2}$ of 0.900 . This not only demonstrates the model’s robust generalization ability but also indicates its effectiveness in capturing the essential temporal information within the heating process.
尽管我们的模型最初是在线性温度程序数据上训练的,但为了评估其对非线性加热过程的适应性,我们进行了进一步测试。我们特别选择了八个非线性温度程序和十个明显未包含在GCRT数据集中的化合物。这种选择突出了这些化合物的新颖性,确保了对模型在全新化学实体上性能的严格评估。如图4d所示,温度程序被分为快速非线性(在8分钟内达到最终温度,用红色表示)和慢速非线性(在10分钟后达到最终温度,用紫色表示)。橙色区域表示训练集中线性温度程序的覆盖范围。值得注意的是,两条快速非线性曲线落在这个覆盖范围之外。令人鼓舞的是,测试结果表明,多模态模型能够在各种非线性条件下准确预测未知化合物的保留时间,${R}^{2}$值达到0.900。这不仅证明了该模型强大的泛化能力,还表明了其在捕捉加热过程中基本时间信息方面的有效性。
2.5 Applications of multimodal model in isomer separation
2.5 多模态模型在异构体分离中的应用
Isomers, which have identical molecular formula and similar boiling points, often require repeated adjustments of the temperature programs for effective separation in GC. To address this challenge, we employed the trained multimodal model to perform virtual high-throughput screening of various temperature programs, and recommending the optimal temperature program in seconds. This temperature program not only ensures effective separation of isomers but also significantly shortens the peak elution time, thereby avoiding traditional trial-and-error methods. The multimodal model exhaustively searches through 100000 temperature programs, balancing search precision with efficiency. On a single Nvidia 4090 GPU, this search is completed in just one minute. The procedure for generating 100000 random temperature programs starts by establishing boundary conditions for the following variables: initial temperature, final temperature, heating rate, and duration of the initial temperature. Following the setting of these parameters, random sampling is utilized to generate the curves. For further details on this method, refer to Section 6 of the SI Materials. The definition of isomer separation degree is as follows:
异构体具有相同的分子式和相似的沸点,在气相色谱(GC)中通常需要反复调整温度程序才能实现有效分离。为应对这一挑战,我们使用经过训练的多模态模型对各种温度程序进行虚拟高通量筛选,并在数秒内推荐最佳温度程序。该温度程序不仅能确保异构体的有效分离,还能显著缩短峰洗脱时间,从而避免传统的试错方法。多模态模型对100,000个温度程序进行了详尽搜索,在搜索精度和效率之间取得了平衡。在单个英伟达4090 GPU上,这一搜索仅需一分钟即可完成。生成100,000个随机温度程序的过程首先要为以下变量建立边界条件:初始温度、最终温度、升温速率和初始温度持续时间。设置这些参数后,利用随机采样生成曲线。有关此方法的更多详细信息,请参阅补充材料的第6节。异构体分离度的定义如下:
$$ {\Delta }_{i} = \frac{\min \left( {\left| {{y}_{\mathrm{b}, i} - {y}_{\mathrm{a}, i}}\right| ,{T}_{\text{ threshold }}}\right) }{{T}_{\text{ threshold }}},\;\text{ for }i = 1,2,\ldots ,{100000} \tag{3} $$where ${\Delta }_{i}$ represents the separation degree of isomers under the $i$ -th temperature program, with a range of $\left\lbrack {0,1}\right\rbrack$ . When ${\Delta }_{i} = 1$ , we consider the separation of isomers to be successful. ${y}_{\mathrm{a}, i}$ and ${y}_{\mathrm{b}, i}$ respectively denote the peak elution time of the two compounds under the $i$ -th temperature program, while ${T}_{\text{ threshold }}$ represents the minimum retention time difference considered acceptable for effective separation. Given that GC peaks are typically sharp, a small difference in peak elution time between isomer compounds is sufficient for separation. Therefore, we set the default value of ${T}_{\text{ threshold }}$ to 0.5 (30 seconds). ${T}_{\text{ threshold }}$ is a variable parameter; when it is not possible to find a temperature program where ${\Delta }_{i} = 1$ for a specific isomer, this value can be reduced to lower the difficulty of the search. This strategy enhances the flexibility and user-friendliness of the search algorithm. We define the separation ratio $s$ to represent the ease of separating isomers at a specific ${T}_{\text{ threshold }}$ value. A higher separation ratio $s$ indicates that the isomers are more easily separated. The formula for $s$ is as follows:
其中${\Delta }_{i}$表示在第$i$个温度程序下异构体的分离度,范围为$\left\lbrack {0,1}\right\rbrack$。当${\Delta }_{i} = 1$时,我们认为异构体的分离是成功的。${y}_{\mathrm{a}, i}$和${y}_{\mathrm{b}, i}$分别表示在第$i$个温度程序下两种化合物的峰洗脱时间,而${T}_{\text{ threshold }}$表示有效分离可接受的最小保留时间差。鉴于GC峰通常很尖锐,异构体化合物之间峰洗脱时间的微小差异就足以实现分离。因此,我们将${T}_{\text{ threshold }}$的默认值设置为0.5(30秒)。${T}_{\text{ threshold }}$是一个可变参数;当无法找到特定异构体满足${\Delta }_{i} = 1$的温度程序时,可以降低此值以降低搜索难度。此策略提高了搜索算法的灵活性和用户友好性。我们定义分离比$s$来表示在特定${T}_{\text{ threshold }}$值下异构体分离的难易程度。分离比$s$越高,表明异构体越容易分离。$s$的公式如下:
$$ s = \frac{1}{100000}\mathop{\sum }\limits_{{i = 1}}^{{100000}}1\left( {{\Delta }_{i} = 1}\right) \tag{4} $$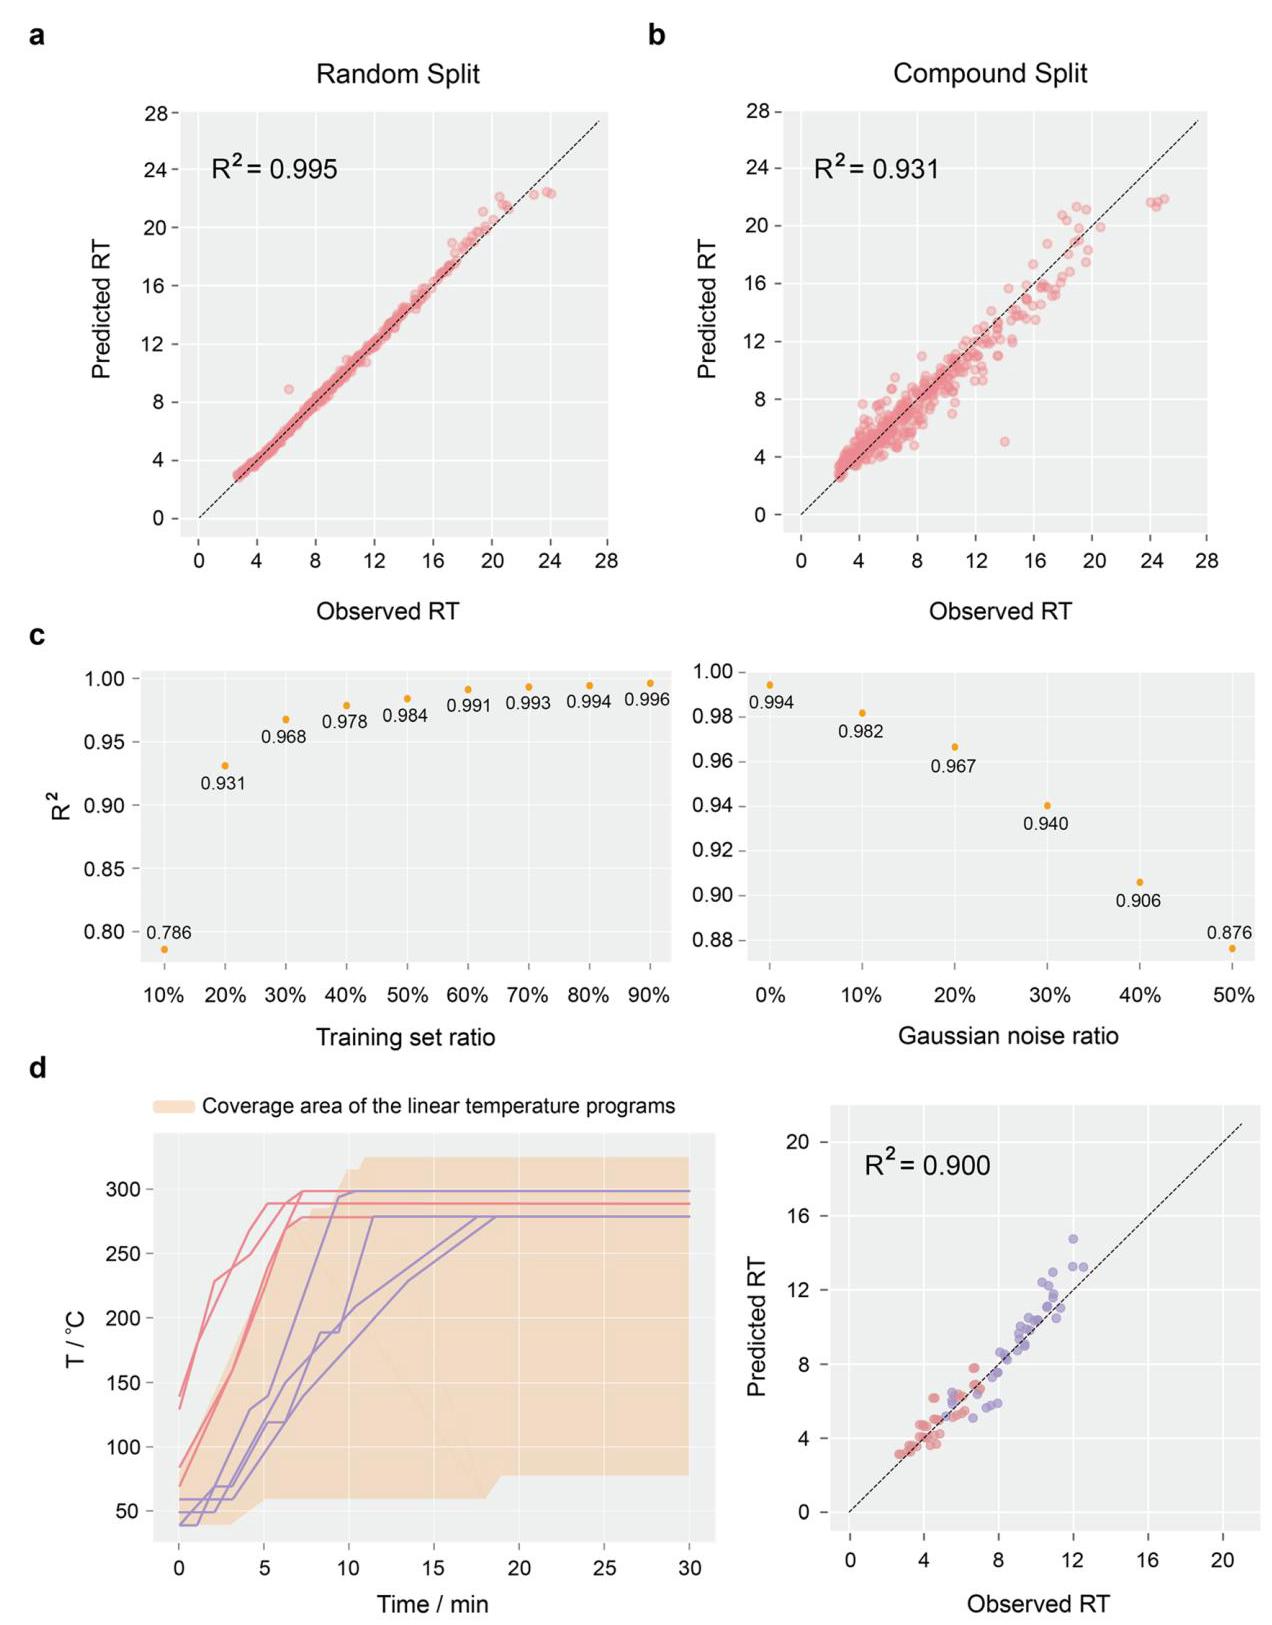
Fig. 4 Predictive performance of the multimodal model. (a) Performance of the multimodal model on the test set, with the dataset divided using the random split method, with training, validation, and test set ratios set at 8:1:1. (b) Performance of the multimodal model on the test set, with the dataset divided using the compound split method, with training, validation, and test set ratios set at 8:1:1. (c) Robustness analysis of the multimodal model across various training set ratios and Gaussian noise levels. (d) The multimodal model’s performance in predicting RT under nonlinear temperature programs. The orange area represents the coverage of linear temperature programs within the training set. The red curves signify rapid nonlinear heating profiles, reaching the final temperature in less than 8 minutes. Conversely, the purple curves indicate slow nonlinear heating profiles, with the final temperature achieved in more than 10 minutes. All compounds tested were entirely new, outside the scope of the GCRT dataset.
图4多模态模型的预测性能。(a)多模态模型在测试集上的性能,数据集采用随机分割方法划分,训练集、验证集和测试集的比例设置为8:1:1。(b)多模态模型在测试集上的性能,数据集采用化合物分割方法划分,训练集、验证集和测试集的比例设置为8:1:1。(c)多模态模型在各种训练集比例和高斯噪声水平下的稳健性分析。(d)多模态模型在非线性温度程序下预测保留时间(RT)的性能。橙色区域表示训练集中线性温度程序的覆盖范围。红色曲线表示快速非线性升温曲线,在不到8分钟内达到最终温度。相反,紫色曲线表示缓慢非线性升温曲线,在超过10分钟内达到最终温度。所有测试化合物都是全新的,不在GCRT数据集范围内。
In practical applications, we aim not only for ${\Delta }_{i} = 1$ but also for the quickest possible peak elution time to reduce analysis timing cost. Therefore, we have established the following search algorithm:
在实际应用中,我们不仅追求${\Delta }_{i} = 1$,还希望峰洗脱时间尽可能快,以降低分析时间成本。因此,我们建立了以下搜索算法:
$$ {i}^{ * } = \arg \mathop{\min }\limits_{{i \in \left\{ {i{\Delta }_{i} = 1}\right\} }}\max \left( {{y}_{\mathrm{a}, i},{y}_{\mathrm{b}, i}}\right) \tag{5} $$where ${i}^{ * }$ represents the index of the optimal temperature program identified by the search algorithm. Through this method, we can find the index of the temperature program that not only achieves ${\Delta }_{i} = 1$ but also provides the quickest peak elution time.
其中${i}^{ * }$表示搜索算法确定的最佳温度程序的索引。通过这种方法,我们可以找到不仅能实现${\Delta }_{i} = 1$,而且能提供最快峰洗脱时间的温度程序的索引。
To validate the reliability of the temperature program search algorithm, we selected two pairs of positional isomers (2- bromo-4-methylbenzaldehyde and 2-bromo-5- methylbenzaldehyde; 2-iodo-4-methylbenzeneamine and 3- iodo-4-methylbenzeneamine) and two pairs of cis/trans isomers (cis-1,2-diphenylethylene and trans-1,2-diphenylethylene; cis- 1,4-dichloro-2-butene and trans-1,4-dichloro-2-butene) as proof-of-concept subjects. More importantly, these four sets of compounds were not included in the GCRT dataset, hence the model had no prior exposure to these compounds during training.
为验证温度程序搜索算法的可靠性,我们选择了两对位置异构体(2-溴-4-甲基苯甲醛和2-溴-5-甲基苯甲醛;2-碘-4-甲基苯胺和3-碘-4-甲基苯胺)以及两对顺反异构体(顺-1,2-二苯乙烯和反-1,2-二苯乙烯;顺-1,4-二氯-2-丁烯和反-1,4-二氯-2-丁烯)作为概念验证对象。更重要的是,这四组化合物未包含在GCRT数据集中,因此模型在训练期间没有接触过这些化合物。
The ${T}_{\text{ threshold }}$ for two groups of positional isomers was set at 0.33 (20 seconds), while the default value of 0.5 was used for two groups of cis/trans isomers. This adjustment was necessary because the positional isomers failed to achieve a temperature program satisfying ${\Delta }_{i} = 1$ at ${T}_{\text{ threshold }}$ of 0.5 . Fig. 5a presents the kernel density estimation (KDE) plots of $\max \left( {{\mathrm{{RT}}}_{\mathrm{A}}^{\text{ pred }},{\mathrm{{RT}}}_{\mathrm{B}}^{\text{ pred }}}\right)$ values for the four groups of isomers during the search process where ${\Delta }_{i} = 1$ , illustrating the probability distribution of different isomers’ later RT. The KDE was performed using a Gaussian kernel, as described by the following equation:
两组位置异构体的${T}_{\text{ threshold }}$设置为0.33(20秒),而两组顺反异构体使用默认值0.5。这种调整是必要的,因为位置异构体在${T}_{\text{ threshold }}$为0.5时未能实现满足${\Delta }_{i} = 1$的温度程序。图5a展示了搜索过程中四组异构体的$\max \left( {{\mathrm{{RT}}}_{\mathrm{A}}^{\text{ pred }},{\mathrm{{RT}}}_{\mathrm{B}}^{\text{ pred }}}\right)$值的核密度估计(KDE)图,其中${\Delta }_{i} = 1$,说明了不同异构体后期保留时间(RT)的概率分布。KDE使用高斯核进行,如以下等式所述:
$$ \widehat{f}\left( x\right) = \frac{1}{nh}\mathop{\sum }\limits_{{i = 1}}^{n}\frac{1}{\sqrt{2\pi }}\exp \left( {-\frac{{\left( x - {x}_{i}\right) }^{2}}{2{h}^{2}}}\right) \tag{6} $$where $n$ is the number of data points, and $h$ is the bandwidth parameter. Fig. 5a shows the mean and mode for $\max \left( {{\mathrm{{RT}}}_{\mathrm{A}}^{\text{ pred }},{\mathrm{{RT}}}_{\mathrm{B}}^{\text{ pred }}}\right)$ , where the mode refers to the position of the maximum value on the KDE curve $\widehat{f}\left( x\right)$ . The recommended temperature program corresponds to the minimum $\max \left( {{\mathrm{{RT}}}_{\mathrm{A}}^{\text{ pred }},{\mathrm{{RT}}}_{\mathrm{B}}^{\text{ pred }}}\right)$ . For the four groups of isomers from top to bottom in Fig. 5a, the temperature programs recommended by the multimodal model are accelerated by 42.85%, 27.77%, 19.48%, and 21.41%, respectively, relative to the temperature programs corresponding to the mode of $\max \left( {{\mathrm{{RT}}}_{\mathrm{A}}^{\text{ pred }},{\mathrm{{RT}}}_{\mathrm{B}}^{\text{ pred }}}\right)$ . Experimental validation demonstrated that under the recommended temperature programs, all four groups of isomers were effectively separated, and the multimodal model successfully predicted the elution order with absolute errors of 0.395 minutes, 0.613 minutes, 0.693 minutes, and 0.395 minutes, respectively, showcasing excellent predictive accuracy. The experimental chromatograms are shown in Section 7 of the SI Materials. Notably, the $s$ values for these four groups of isomers were 0.562, 0.094, 0.217, and 0.870, respectively, indicating a certain level of separation difficulty, especially for the pair of isomers 2-bromo-4-methylbenzaldehyde and 2-bromo-5- methylbenzaldehyde. The results suggest that this multimodal model, in conjunction with the search algorithm, has the potential to ensure effective isomer separation and enhance analytical efficiency. Given its high precision in prediction, this method can also be employed for internal standard peak identification and rapid analysis of complex mixtures.
其中$n$是数据点的数量,$h$是带宽参数。图5a显示了$\max \left( {{\mathrm{{RT}}}_{\mathrm{A}}^{\text{ pred }},{\mathrm{{RT}}}_{\mathrm{B}}^{\text{ pred }}}\right)$的均值和众数,其中众数指的是KDE曲线$\widehat{f}\left( x\right)$上最大值的位置[此处$\widehat{f}\left( x\right)$在原文中未明确其指代含义,保留原样]。推荐的温度程序对应于最小的$\max \left( {{\mathrm{{RT}}}_{\mathrm{A}}^{\text{ pred }},{\mathrm{{RT}}}_{\mathrm{B}}^{\text{ pred }}}\right)$。对于图5a中从上到下的四组异构体,多模态模型推荐的温度程序相对于$\max \left( {{\mathrm{{RT}}}_{\mathrm{A}}^{\text{ pred }},{\mathrm{{RT}}}_{\mathrm{B}}^{\text{ pred }}}\right)$众数对应的温度程序分别加快了42.85%、27.77%、19.48%和21.41%。实验验证表明,在推荐的温度程序下,所有四组异构体都得到了有效分离,多模态模型成功预测了洗脱顺序,绝对误差分别为0.395分钟、0.613分钟、0.693分钟和0.395分钟,展示了出色的预测准确性。实验色谱图见补充材料第7节。值得注意的是,这四组异构体的$s$值分别为0.562、0.094、0.217和0.870,表明存在一定程度的分离难度,特别是对于2-溴-4-甲基苯甲醛和2-溴-5-甲基苯甲醛这对异构体。结果表明,这种多模态模型与搜索算法相结合,有潜力确保有效的异构体分离并提高分析效率。鉴于其在预测方面的高精度,该方法还可用于内标峰识别和复杂混合物的快速分析。
To further investigate the separation difficulty of different isomers on a 5% phenyl-95% dimethylpolysiloxane stationary phase, we calculated the $s$ values for various positional and cis/ trans isomers at different ${T}_{\text{ threshold }}$ values as a proof of concept: Fig. 5b illustrates three groups of ortho/meta positional isomers, differing only by their substituents. The results show that bromine-substituted isomers are easier to separate than chlorine-substituted ones, while methoxy-substituted isomers are the most difficult to separate. The chemical explanation we provide is that methoxy is a strong electron-donating group with significant polarity, producing a relatively consistent polar effect regardless of its position on the benzene ring, leading to minimal polarity differences between positional isomers, making them hard to separate. Chlorine is less polar than methoxy, and bromine is the least polar but has a higher polarizability, resulting in significant differences in substituent effects at different positions on the benzene ring, making positional isomers easier to separate. Fig. 5c shows three groups of halogenated ethylene cis/trans isomers, with iodine isomers being the easiest to separate, followed by bromine, and chlorine isomers being the hardest. The chemical explanation is that iodine atoms, being larger with high polarizability and weaker polarity, cause significant van der Waals force differences between cis and trans isomers. This substantial difference in atomic size and polarizability makes it easier to separate cis/ trans isomers in the stationary phase. Bromine has moderate polarizability and size, whereas chlorine atoms are the smallest with the lowest polarizability, resulting in minimal polarity differences between cis and trans isomers, making separation the most difficult. In summary, different substituents lead to varying polarity differences between isomers, influencing separation difficulty. The data-driven conclusions align with chemical intuition. Other researchers can apply our model to their isomers of interest to explore the relationship between molecular structure and chromatographic behavior, aiding in experimental decision-making without performing experiments.
为了进一步研究不同异构体在5%苯基-95%二甲基聚硅氧烷固定相上的分离难度,我们计算了不同${T}_{\text{ threshold }}$值下各种位置异构体和顺/反异构体的$s$值,作为概念验证:图5b展示了三组邻/间位位置异构体,它们仅在取代基上有所不同。结果表明,溴取代的异构体比氯取代的异构体更容易分离,而甲氧基取代的异构体最难分离。我们给出的化学解释是,甲氧基是一个强供电子基团,具有显著的极性,无论其在苯环上的位置如何,都会产生相对一致的极性效应,导致位置异构体之间的极性差异最小,使其难以分离。氯的极性比甲氧基小,溴的极性最小但极化率较高,导致苯环上不同位置的取代基效应存在显著差异,使位置异构体更容易分离。图5c展示了三组卤代乙烯顺/反异构体,碘异构体最容易分离,其次是溴,氯异构体最难分离。化学解释是,碘原子较大,极化率高且极性弱,导致顺式和反式异构体之间的范德华力差异显著。这种原子大小和极化率的显著差异使得在固定相中更容易分离顺/反异构体。溴的极化率和大小适中,而氯原子最小,极化率最低,导致顺式和反式异构体之间的极性差异最小,使得分离最为困难。总之,不同的取代基导致异构体之间的极性差异不同,影响分离难度。数据驱动的结论与化学直觉一致。其他研究人员可以将我们的模型应用于他们感兴趣的异构体,以探索分子结构与色谱行为之间的关系,有助于在不进行实验的情况下做出实验决策。
2.6 Predicting RT using RI
2.6 使用保留指数预测保留时间
In the field of GC prediction research, the Retention Index (RI) is a fundamental parameter that reflects the retention capability of a specific stationary phase (SP) for molecules. Unique in its independence from chromatographic conditions, RI is predominantly influenced by the SP and molecular structure, represented as follows:
在气相色谱预测研究领域,保留指数(RI)是反映特定固定相对分子保留能力的基本参数。RI不受色谱条件影响,主要受固定相和分子结构影响,如下所示:
$$ \mathrm{{RI}} = f\left( {\mathrm{{SP}},\text{ Molecule }}\right) \tag{7} $$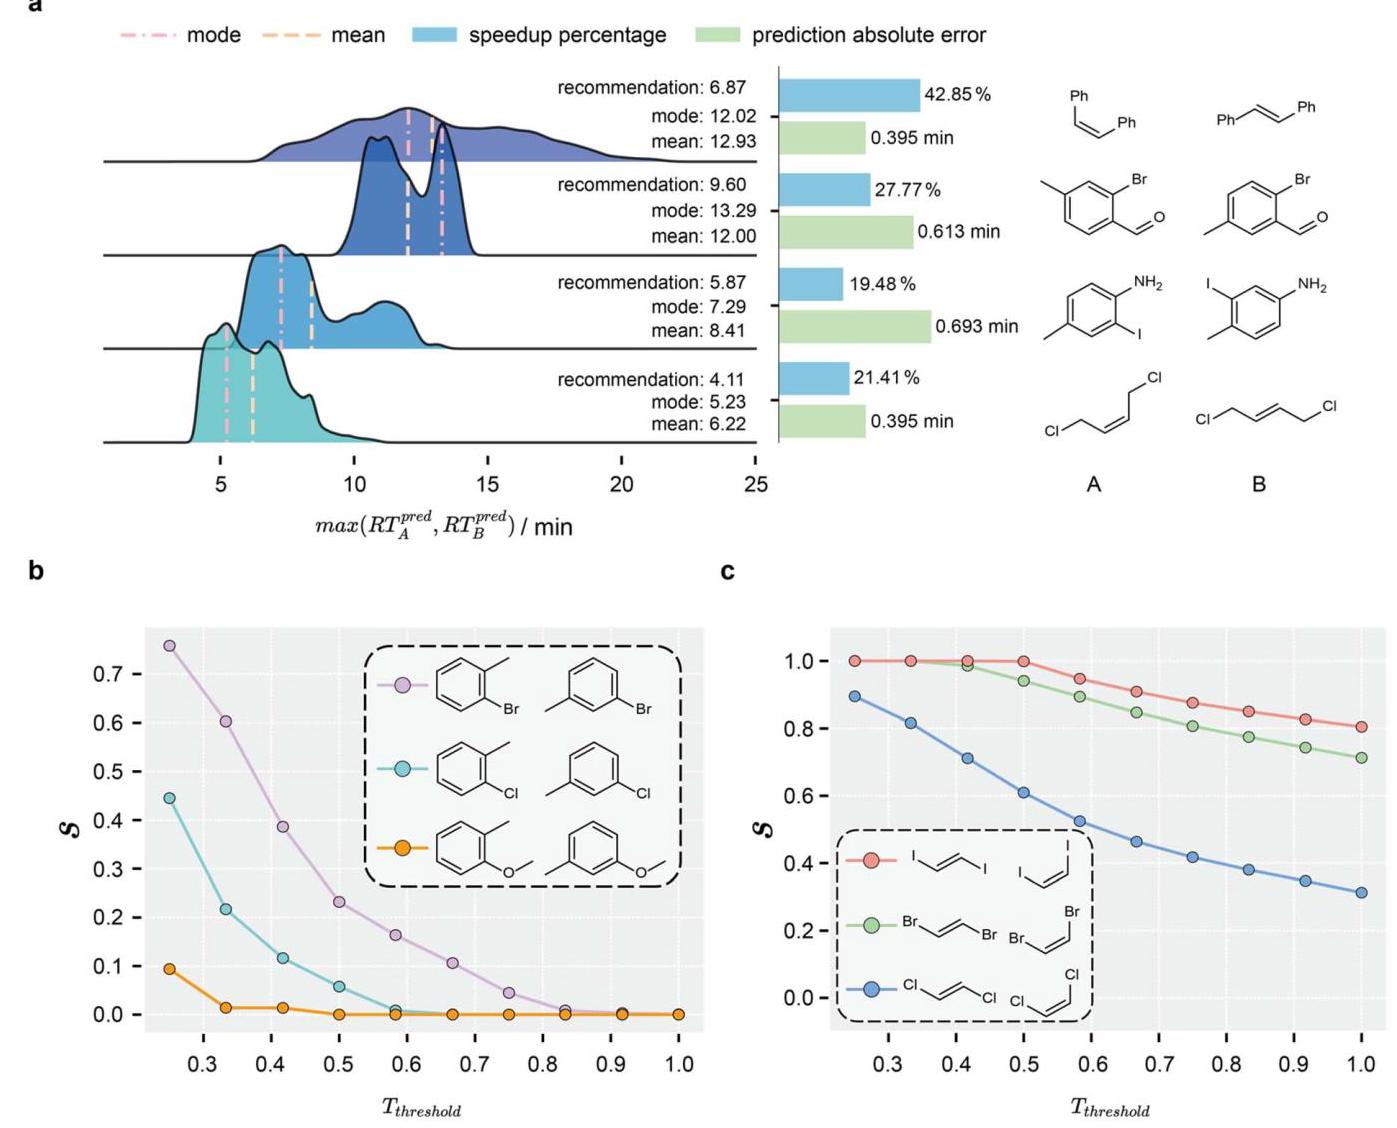
Fig. 5 Experimental validation of the search algorithm and exploration of isomer separation difficulty. (a) KDE curves of the max(RT ${}_{A}^{\text{ greed }}$ , RTBred) values for four groups of isomers, showing the acceleration ratios of the recommended temperature programs and the absolute errors between predicted and experimental values. (b) s value variation curves at different ${T}_{\text{ threshold }}$ for three groups of positional isomers. (c) s value variation curves at different ${T}_{\text{ threshold }}$ for three groups of halogenated ethylene cis/trans isomers.
图5搜索算法的实验验证和异构体分离难度探索。(a) 四组异构体的max(RT ${}_{A}^{\text{ greed }}$ , RTBred)值的KDE曲线,显示推荐温度程序的加速比以及预测值与实验值之间的绝对误差。(b) 三组位置异构体在不同${T}_{\text{ threshold }}$下的s值变化曲线。(c) 三组卤代乙烯顺/反异构体在不同${T}_{\text{ threshold }}$下的s值变化曲线。
This characteristic renders it a critical parameter for the identification of compounds. Researchers like Dmitriy and Aleksandar have advanced ML models to predict the RI of compounds under various SPs. ${}^{{13} - {16}}$ Given the applicability of the RI across various GC conditions and instrumentation, integrating RI to enhance the scalability of RT prediction models represents a promising direction.
这一特性使其成为化合物鉴定的关键参数。像德米特里和亚历山大这样的研究人员已经推进了机器学习模型,以预测各种固定相下化合物的RI。${}^{{13} - {16}}$ 鉴于RI在各种气相色谱条件和仪器中的适用性,整合RI以提高保留时间预测模型的可扩展性是一个有前景的方向。
RT is primarily influenced by the SP, the molecule, and the temperature program, which can be represented as follows:
保留时间主要受固定相、分子和温度程序影响,如下所示:
$$ \mathrm{{RT}} = g\left( {\mathrm{{SP}}\text{ , Molecule, Temperature Program) }}\right) \tag{8} $$Therefore, we used RI and the temperature program to predict RT, formulated as follows:
因此,我们使用RI和温度程序来预测保留时间,公式如下:
$$ \mathrm{{RT}} = z\left( {\mathrm{{RI}}\text{ , Temperature Program }}\right) \tag{9} $$Linearly temperature-programmed retention index (LTPRI) is the most commonly used type of RI that depends on the RT of adjacent standard alkanes. Its calculation formula is as follows:
线性程序升温保留指数(LTPRI)是最常用的RI类型,它取决于相邻标准烷烃的保留时间。其计算公式如下:
$$ I = {100} \times \left( {n + \frac{{t}_{\mathrm{R}} - {t}_{\mathrm{R}n}}{{t}_{\mathrm{R}n + 1} - {t}_{\mathrm{R}n}}}\right) \tag{10} $$In this context, $I$ represents the LTPRI of the target compound; $n$ is the number of carbon atoms in the nearest smaller $n$ -alkane relative to the target compound; ${t}_{\mathrm{R}}$ denotes the RT of the target compound; ${t}_{\mathrm{R}n}$ is the RT of the $n$ -alkane with $n$ carbon atoms; ${t}_{\mathrm{R}n + 1}$ is the RT of the $n$ -alkane with $n + 1$ carbon atoms. Under the stationary phase of 5% phenyl-95% dimethylpolysiloxane, we measured the RT of $n$ -alkanes from C5 to C25 across various temperature programs. Utilizing these data, we calculated the LTPRI RI values for compounds in the GCRT dataset according to formula (10). Ultimately, we established a database comprising RI-RT values for 219 compounds under different temperature programs, totaling 3316 data points.
在此,$I$ 表示目标化合物的LTPRI;$n$ 是相对于目标化合物最近的较小$n$ -烷烃中的碳原子数;${t}_{\mathrm{R}}$ 表示目标化合物的保留时间;${t}_{\mathrm{R}n}$ 是具有$n$ 个碳原子的$n$ -烷烃的保留时间;${t}_{\mathrm{R}n + 1}$ 是具有$n + 1$ 个碳原子的$n$ -烷烃的保留时间。在5%苯基-95%二甲基聚硅氧烷固定相下,我们测量了C5至C25的$n$ -烷烃在各种温度程序下的保留时间。利用这些数据,我们根据公式(10)计算了GCRT数据集中化合物的LTPRI RI值。最终,我们建立了一个数据库,包含219种化合物在不同温度程序下的RI-RT值,共3316个数据点。
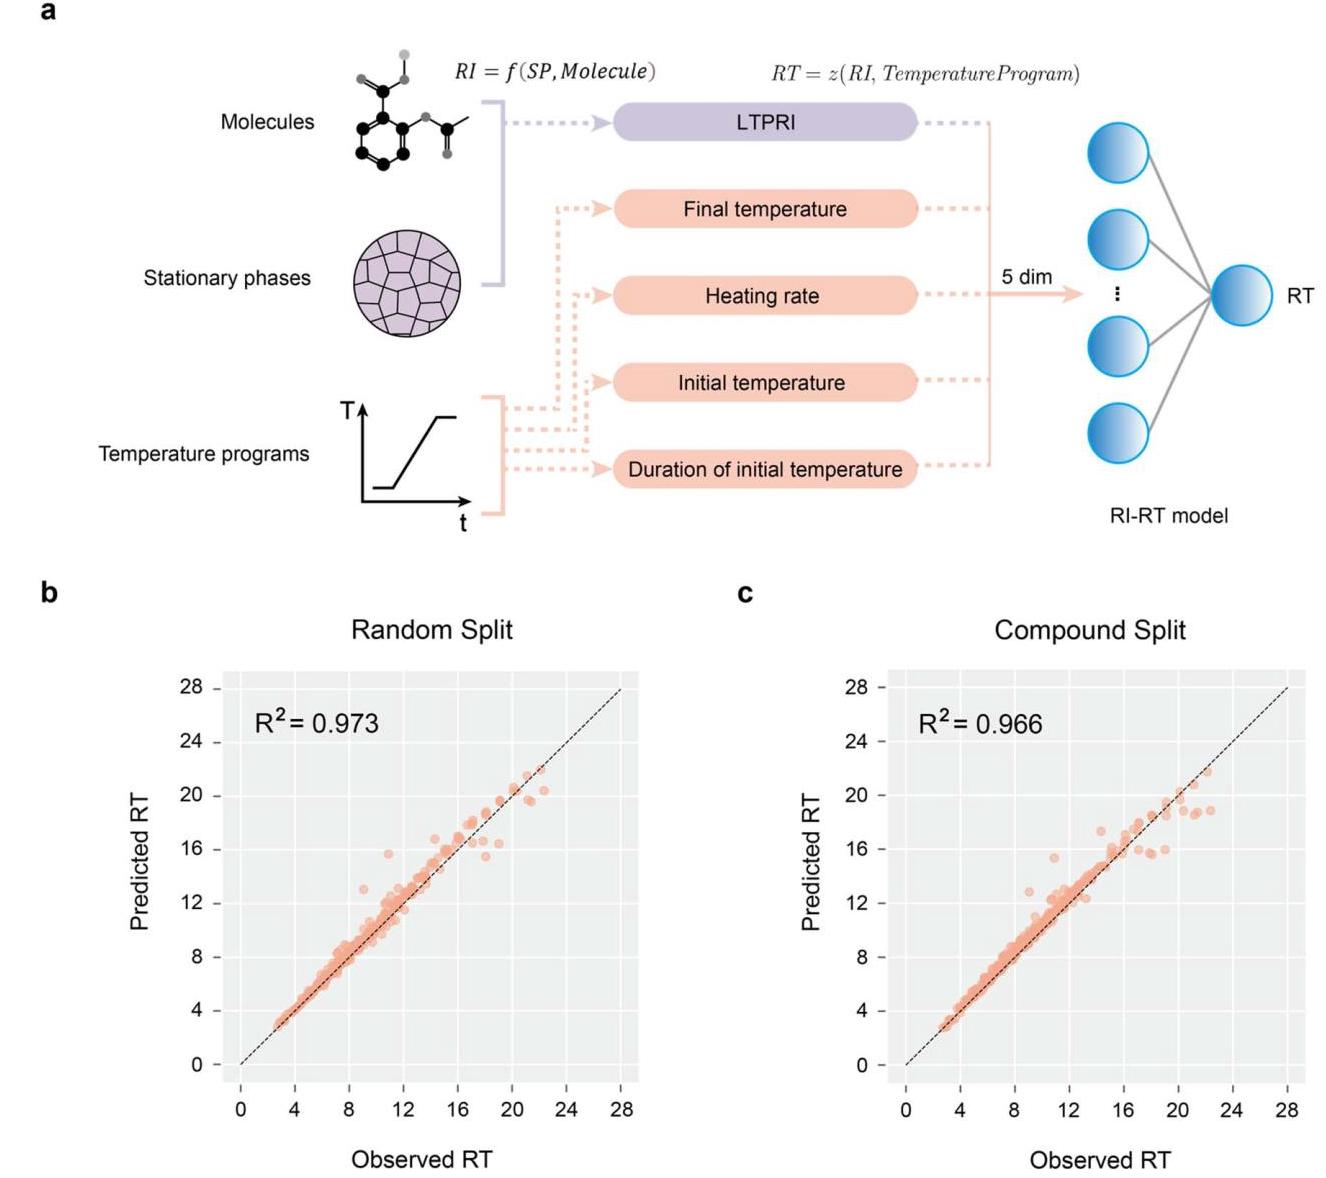
Fig. 6 Predictive performance of the RI-RT model. (a) The feature engineering approach of the RI-RT model. (b) Performance of the RI-RT model on the test set, with the dataset divided using the random split method, with training, validation, and test set ratios set at 8 :1 :1. (c) Performance of the RI-RT model on the test set, with the dataset divided using the compound split method, with training, validation, and test set ratios set at 8 : 1 : 1 .
图6 RI-RT模型的预测性能。(a) RI-RT模型的特征工程方法。(b) RI-RT模型在测试集上的性能,数据集使用随机分割方法划分,训练、验证和测试集比例设置为8:1:1。(c) RI-RT模型在测试集上的性能,数据集使用化合物分割方法划分,训练、验证和测试集比例设置为8:1:1。
We developed an ANN model with two hidden layers, referred to as the RI-RT model (see Section 8 of the SI Materials for details), to predict RT. The model incorporates five input dimensions: LTPRI, final temperature, heating rate, initial temperature, and duration of initial temperature (as illustrated in Fig. 6a). The LTPRI encapsulates information about the molecule and stationary phase, while the remaining four features describe the dynamics of the temperature program. The dataset was randomly divided in an $8 : 1 : 1$ ratio for training, validation, and test, achieving a predictive ${R}^{2}$ of 0.973 on the test set (shown in Fig. 6b). To assess the model’s generalization capability and prevent data leakage, we re-partitioned the dataset by compound type, maintaining the same distribution ratio. Under these conditions, the model’s predictive ${R}^{2}$ on the test set was 0.966 (as shown in Fig. 6c), surpassing the performance of the multimodal learning model.
我们开发了一个具有两个隐藏层的人工神经网络模型,称为RI-RT模型(详见补充材料第8节),用于预测保留时间。该模型包含五个输入维度:LTPRI、最终温度、升温速率、初始温度和初始温度持续时间(如图6a所示)。LTPRI包含有关分子和固定相的信息,而其余四个特征描述温度程序的动态变化。数据集以$8 : 1 : 1$ 比例随机划分为训练集、验证集和测试集,在测试集上的预测${R}^{2}$ 为0.973(如图6b所示)。为了评估模型的泛化能力并防止数据泄露,我们按化合物类型重新划分数据集,保持相同的分布比例。在这些条件下,模型在测试集上的预测${R}^{2}$ 为0.966(如图6c所示),超过了多模态学习模型的性能。
The exceptional performance of the RI-RT model validates the feasibility of using RI to predict RT, demonstrating that a single parameter, RI, can encompass information about both the molecule and the stationary phase, significantly broadening the applicability of RT prediction models. We offer a pre-trained RI-RT model. Researchers can first employ existing RI prediction models ${}^{{13} - {16}}$ to calculate the RI of different molecules on their specific stationary phases. Subsequently, with minimal temperature program testing, they can fine-tune the RI-RT pre-trained model to achieve universal RT prediction.
RI-RT模型的卓越性能验证了使用保留指数(RI)预测保留时间(RT)的可行性,表明单一参数RI可以涵盖有关分子和固定相的信息,显著拓宽了RT预测模型的适用性。我们提供了一个预训练的RI-RT模型。研究人员可以首先使用现有的RI预测模型${}^{{13} - {16}}$来计算不同分子在其特定固定相上的RI。随后,通过最少的程序升温测试,他们可以对预训练的RI-RT模型进行微调,以实现通用的RT预测。
3 Conclusions
3 结论
In this study, we firstly developed a GC peak extraction algorithm, termed GC-PIEA, and utilized it to construct the GCRT database. Subsequently, we explored the application of various conventional ML algorithms for predicting RT, accompanied by a thorough analysis of model interpretability. Furthermore, we investigated the impact of different molecular descriptors on RT from a chemical perspective. Following this, we constructed a multimodal prediction model integrating geometry-enhanced graph isomorphism network for extracting molecular information and Bi-GRU for analyzing the time-series information of temperature programs. This enabled us to achieve highly accurate predictions of GC-RT, outperforming conventional ML algorithms. Notably, despite being trained on linear temperature programs, the multimodal model demonstrated accurate predictions even under non-linear temperature conditions. As a highlight of our research, we developed a temperature program search algorithm that empowered the multimodal model to rapidly identify optimal chromatographic separation conditions. This facilitated effective separation of positional isomeric and cis/trans isomeric compounds while ensuring rapid peak elution, thereby avoiding traditional trial-and-error method and significantly enhancing analytical efficiency. Moreover, this search algorithm can be employed to investigate the separation difficulty of various isomers, thereby elucidating the relationship between molecular structure and chromatographic behavior, and providing an in-depth understanding of separation mechanisms.
在本研究中,我们首先开发了一种气相色谱峰提取算法,称为GC-PIEA,并利用它构建了GCRT数据库。随后,我们探索了各种传统机器学习算法在预测保留时间方面的应用,并对模型的可解释性进行了深入分析。此外,我们从化学角度研究了不同分子描述符对保留时间的影响。在此之后,我们构建了一个多模态预测模型,该模型集成了用于提取分子信息的几何增强图同构网络和用于分析温度程序时间序列信息的双向门控循环单元(Bi-GRU)。这使我们能够实现对气相色谱保留时间(GC-RT)的高精度预测,优于传统机器学习算法。值得注意的是,尽管该多模态模型是在线性温度程序上进行训练的,但即使在非线性温度条件下,它也能做出准确的预测。作为我们研究的一个亮点,我们开发了一种温度程序搜索算法,使多模态模型能够快速识别最佳色谱分离条件。这有助于有效分离位置异构体和顺反异构体化合物,同时确保快速出峰,从而避免了传统的试错方法,显著提高了分析效率。此外,这种搜索算法可用于研究各种异构体的分离难度,从而阐明分子结构与色谱行为之间的关系,并深入了解分离机制。
However, the multimodal model still exhibits limitations. Due to practical constraints, obtaining RT data for compounds across various stationary phases and temperature programs is difficult. Despite being trained on the widely used 5% phenyl- 95% dimethylpolysiloxane stationary phase, extending its application to other stationary phases remains challenging. To address this issue, we propose a strategy for predicting RT using RI and provide a corresponding pre-trained model. Since RI inherently contains information about the stationary phase, researchers can apply our pre-trained model to their specific stationary phases, fine-tuning it with minimal data to achieve universal RT prediction. Through this approach, we aim to overcome the limitations posed by different stationary phases and further enhance the model’s applicability. Additionally, in future work, the collection of chromatographic data under optimized flow rates and injection conditions would significantly enhance the quality of the dataset.
然而,该多模态模型仍然存在局限性。由于实际限制,获取各种固定相和温度程序下化合物的保留时间数据很困难。尽管该模型是在广泛使用的5%苯基-95%二甲基聚硅氧烷固定相上进行训练的,但将其应用扩展到其他固定相仍然具有挑战性。为了解决这个问题,我们提出了一种使用保留指数(RI)预测保留时间的策略,并提供了相应的预训练模型。由于保留指数本身包含有关固定相的信息,研究人员可以将我们的预训练模型应用于他们特定的固定相,用最少的数据进行微调以实现通用的保留时间预测。通过这种方法,我们旨在克服不同固定相带来的限制,并进一步提高模型的适用性。此外,在未来的工作中,在优化的流速和进样条件下收集色谱数据将显著提高数据集的质量。
Author contributions
作者贡献
L. S. conducted experiments and collected the GCRT dataset. J. L analyzed the data. J. L. performed chemoinformatic and machine learning studies. F. M. conceived the idea and designed the overall research. F. M. and S. C. supervised the whole project. All authors wrote the manuscript.
L. S. 进行了实验并收集了GCRT数据集。J. L分析了数据。J. L. 进行了化学信息学和机器学习研究。F. M. 构思了这个想法并设计了整体研究。F. M. 和S. C. 监督了整个项目。所有作者撰写了手稿。
Conflicts of interest
利益冲突
The authors declare no competing interests.
作者声明不存在利益冲突。
Data availability
数据可用性
The dataset and source code supporting the findings of this study are publicly available. The dataset used for training and evaluation is available on Zenodo at: https://zenodo.org/ records/16220196, and the complete source code used for gas chromatography retention time prediction and isomer separation optimization is archived on Figshare at: https:// doi.org/10.6084/m9.figshare.29634785.
支持本研究结果的数据集和源代码可公开获取。用于训练和评估的数据集可在Zenodo上获取:https://zenodo.org/ records/16220196,用于气相色谱保留时间预测和异构体分离优化的完整源代码存档于Figshare:https:// doi.org/10.6084/m9.figshare.29634785。
Supplementary information includes details of model architectures, outlier analysis, and experimental validation. See DOI: https://doi.org/10.1039/d4dd00369a.
补充信息包括模型架构细节、异常值分析和实验验证。见DOI:https://doi.org/10.1039/d4dd00369a。
Acknowledgements
致谢
This work is supported by the Natural Science Foundation of China (Grant No. 22071004, 21933001, 22150013, 22061031). We thank the High-Performance Computing Platform of Peking University for machine learning model training.
本工作得到了中国国家自然科学基金(项目编号:22071004、21933001、22150013、22061031)的支持。我们感谢北京大学高性能计算平台提供机器学习模型训练。
References
参考文献
1 M. I. Jordan and T. M. Mitchell, Machine learning: Trends, perspectives, and prospects, Science, 2015, 349(6245), 255- 260.
2 C. Janiesch, P. Zschech and K. Heinrich, Machine learning and deep learning, Electron. Mark., 2021, 31(3), 685-695.
3 S. Lu, M. Liu, L. Yin, Z. Yin, X. Liu and W. Zheng, The multimodal fusion in visual question answering: a review of attention mechanisms, PeerJ Comput. Sci., 2023, 9, e1400.
4 P. Nandwani and R. Verma, A review on sentiment analysis and emotion detection from text, Soc. Netw. Anal. Min., 2021, 11(1), 81.
5 H. Ko, S. Lee, Y. Park and A. Choi, A survey of recommendation systems: recommendation models, techniques, and application fields, Electronics, 2022, 11(1), 141.
6 X. Domingo-Almenara, A. Perera, N. Ramirez, N. Canellas, X. Correig and J. Brezmes, Compound identification in gas chromatography/mass spectrometry-based metabolomics by blind source separation, J. Chromatogr. A, 2015, 1409, 226-233.
7 X. Domingo-Almenara, A. Perera, N. Ramirez and J. Brezmes, Automated resolution of chromatographic signals by independent component analysis-orthogonal signal deconvolution in comprehensive gas chromatography/mass spectrometry-based metabolomics, Comput. Methods Programs Biomed., 2016, 130, 135-141.
8 X. Domingo-Almenara, A. Perera and J. Brezmes, Avoiding hard chromatographic segmentation: A moving window approach for the automated resolution of gas chromatography-mass spectrometry-based metabolomics signals by multivariate methods, J. Chromatogr. A, 2016, 1474, 145-151.
9 J. Novák. Quantitative analysis by gas chromatography, in Adv Chromatogr, Boca Raton (FL), CRC Press, 2021. pp. 1-71.
10 W. Wichitnithad, O. Sudtanon, P. Srisunak, K. Cheewatanakornkool, S. Nantaphol and P. Rojsitthisak, Development of a sensitive headspace gas chromatography-mass spectrometry method for the simultaneous determination of nitrosamines in losartan active pharmaceutical ingredients, ACS Omega, 2021, 6(16), 11048-11058.
Paper
论文
11 Y. Picó and D. Barceló, Pyrolysis gas chromatography-mass spectrometry in environmental analysis: Focus on organic matter and microplastics, TrAC, Trends Anal. Chem., 2020, 130, 115964.
12 R. L. Grob. Theory of gas chromatography, in Modern Practice of Gas Chromatography, Hoboken (NJ): Wiley, 2004, pp. 23- 63.
13 D. D. Matyushin, A. Y. Sholokhova and A. K. Buryak, A deep convolutional neural network for the estimation of gas chromatographic retention indices, J. Chromatogr. A, 2019, 1607, 460395.
14 D. D. Matyushin and A. K. Buryak, Gas chromatographic retention index prediction using multimodal machine learning, IEEE Access, 2020, 8, 223140-223155.
15 D. D. Matyushin, A. Y. Sholokhova and A. K. Buryak, Deep learning based prediction of gas chromatographic retention indices for a wide variety of polar and mid-polar liquid stationary phases, Int. J. Mol. Sci., 2021, 22(17), 9194.
16 A. M. Veselinović, D. Velimorović, B. Kaličanin, A. Toropova, A. Toropov and J. Veselinović, Prediction of gas chromatographic retention indices based on Monte Carlo method, Talanta, 2017, 168, 257-262.
17 F. Qiu, Z. Lei and L. W. Sumner, MetExpert: An expert system to enhance gas chromatography-mass spectrometry-based metabolite identifications, Anal. Chim. Acta, 2018, 1037, 316-326.
18 C. Jirayupat, K. Nagashima, T. Hosomi, T. Takahashi, W. Tanaka, B. Samransuksamer, et al., Image processing and machine learning for automated identification of chemo-/biomarkers in chromatography-mass spectrometry, Anal. Chem., 2021, 93(44), 14708-14715.
19 Y. Fan, C. Yu, H. Lu, Y. Chen, B. Hu, X. Zhang, et al., Deep learning-based method for automatic resolution of gas chromatography-mass spectrometry data from complex samples, J. Chromatogr. A, 2023, 1690, 463768.
20 C. Capitain and P. Weller, Non-targeted screening approaches for profiling of volatile organic compounds based on gas chromatography-ion mobility spectroscopy (GC-IMS) and machine learning, Molecules, 2021, 26(18), 5457.
21 H. Xu, J. Lin, Q. Liu, Y. Chen, J. Zhang, Y. Yang, et al., High-throughput discovery of chemical structure-polarity relationships combining automation and machine-learning techniques, Chem, 2022, 8(12), 3202-3214.
22 H. Xu, J. Lin, D. Zhang and F. Mo, Retention time prediction for chromatographic enantioseparation by quantile geometry-enhanced graph neural network, Nat. Commun., 2023, 14(1), 3095.
23 S. Kearnes, K. McCloskey, M. Berndl, V. Pande and P. Riley, Molecular graph convolutions: Moving beyond fingerprints, J. Comput.-Aided Mol. Des., 2016, 30, 595-608.
24 K. T. Schütt, H. E. Sauceda, P.-J. Kindermans, A. Tkatchenko and K.-R. Müller, Schnet-a deep learning architecture for molecules and materials, J. Chem. Phys., 2018, 148(24), 241722.
25 X. Fang, L. Liu, J. Lei, D. He, S. Zhang, J. Zhou, et al., Geometry-enhanced molecular representation learning for property prediction, Nat. Mach. Intell., 2022, 4(2), 127-134.
26 S.-W. Li, L.-C. Xu, C. Zhang, S.-Q. Zhang and X. Hong, Reaction performance prediction with an extrapolative and interpretable graph model based on chemical knowledge, Nat. Commun., 2023, 14(1), 3569.