Intelligent Column Chromatography Prediction Model Based on Automation and Machine Learning
英文原文与中文译文逐段对照 · English original with Chinese translation
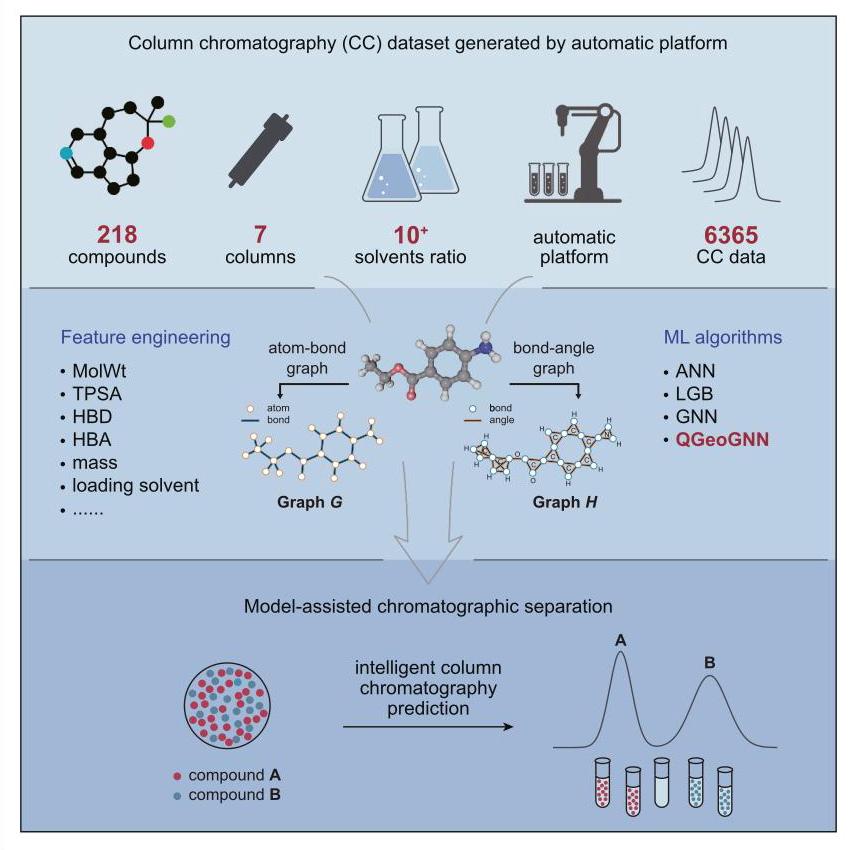
Highlights
亮点
Machine learning predicts chromatographic retention via 3D molecular features
机器学习通过三维分子特征预测色谱保留
Transfer learning enables model adaptation across column specifications
迁移学习使模型能够适应不同的色谱柱规格
Quantitative separation probability $\left( {S}_{p}\right)$ guides experimental optimization
定量分离概率$\left( {S}_{p}\right)$指导实验优化
Data-driven framework reduces empirical trial and error in purification
数据驱动框架减少了纯化过程中的经验性试错
Authors
作者
Wenchao Wu, Hao Xu, Yang Xu, …, Yan Xu, Dongxiao Zhang, Fanyang Mo
吴文超,徐浩,徐杨,……,许言,张东晓,莫凡洋
Correspondence
通信
In brief
简而言之
Chemists traditionally optimize column chromatography through tedious trial and error. This study demonstrates how machine learning models, trained on molecular structures and experimental data, predict compound separation behavior with quantifiable confidence. By translating chemical intuition into computational algorithms, the approach systematically guides purification design-particularly for synthetic intermediates and products. The open-source framework empowers researchers to replace guesswork with data-driven decisions, potentially accelerating chemical discovery while improving reproducibility across laboratories.
传统上,化学家通过繁琐的反复试验来优化柱色谱法。本研究展示了如何基于分子结构和实验数据训练机器学习模型,以可量化的置信度预测化合物的分离行为。通过将化学直觉转化为计算算法,该方法系统地指导纯化设计,特别是对于合成中间体和产品。这个开源框架使研究人员能够用数据驱动的决策取代猜测,这有可能加速化学发现,同时提高各实验室之间的可重复性。
Wu et al., 2025, Chem 11, 102598
吴等人,2025年,《化学》11卷,102598
November 13, 2025 © 2025 Elsevier Inc. All rights are reserved, including those for text and data mining, AI training, and similar technologies. https://doi.org/10.1016/j.chempr.2025.102598
2025年11月13日 © 2025爱思唯尔公司。保留所有权利,包括文本和数据挖掘、人工智能训练及类似技术的权利。https://doi.org/10.1016/j.chempr.2025.102598
Article
文章
Intelligent column chromatography prediction model based on automation and machine learning
#基于自动化和机器学习的智能柱色谱预测模型
Wenchao Wu, ${}^{1}$ Hao Xu, ${}^{2,3}$ Yang Xu, ${}^{4}$ Peijie Luo, ${}^{4}$ Qingrui Zeng, ${}^{4}$ Yuntian Chen, ${}^{2,3}$ Yan Xu, ${}^{4}$ Dongxiao Zhang, ${}^{2}$ and Fanyang Mo ${}^{1,5,6,7,8, * }$
吴文超,${}^{1}$ 徐浩,${}^{2,3}$ 徐杨,${}^{4}$ 罗佩杰,${}^{4}$ 曾庆瑞,${}^{4}$ 陈云天,${}^{2,3}$ 许言,${}^{4}$ 张东晓,${}^{2}$ 以及莫凡洋 ${}^{1,5,6,7,8, * }$
${}^{1}$ State Key Laboratory of Advanced Waterproof Materials, School of Materials Science and Engineering, Peking University, Beijing 100871, China
${}^{1}$ 先进防水材料国家重点实验室,北京大学材料科学与工程学院,北京 100871,中国
${}^{2}$ Zhejiang Key Laboratory of Industrial Intelligence and Digital Twin, Eastern Institute of Technology, Ningbo, Zhejiang 315200, China ${}^{3}$ Ningbo Institute of Digital Twin, Eastern Institute of Technology, Ningbo, Zhejiang 315200, China
${}^{2}$ 浙江省工业智能与数字孪生重点实验室,东方理工学院,宁波,浙江 315200,中国 ${}^{3}$ 东方理工学院宁波数字孪生研究院,宁波,浙江 315200,中国
${}^{4}$ College of Chemistry and Molecular Engineering, Peking University, Beijing 100871, China
${}^{4}$ 北京大学化学与分子工程学院,北京 **********,中国
${}^{5}$ School of Advanced Materials, Peking University Shenzhen Graduate School, Shenzhen 518000, China
${}^{5}$ 北京大学深圳研究生院先进材料学院,深圳 518000,中国
${}^{6}$ School of AI for Science, Peking University Shenzhen Graduate School, Shenzhen 518000, China
${}^{6}$ 北京大学深圳研究生院人工智能科学学院,深圳 518000,中国
${}^{7}$ Guangdong Provincial Key Laboratory of Nano-Micro Materials Research, Peking University Shenzhen Graduate School, Shenzhen 518000, China
${}^{7}$ 广东省纳米微材料研究重点实验室,北京大学深圳研究生院,深圳 518000,中国
${}^{8}$ Lead contact
${}^{8}$ 主要联系人
*Correspondence:
*通讯作者:
https://doi.org/10.1016/j.chempr.2025.102598
THE BIGGER PICTURE Column chromatography remains a cornerstone of chemical separation, yet its optimization heavily relies on empirical expertise, leading to inefficiencies and reproducibility challenges across laboratories. This study bridges the gap between traditional practice and data-driven methodologies by establishing a machine learning framework tailored for chromatographic predictions. The integration of automated experimental platforms with the QGeoGNN (quantum geometry-informed graph neural network) algorithm-a model encoding molecular 3D conformations, physicochemical descriptors, and operational parameters-enables systematic retention volume prediction. By employing transfer learning, the framework adapts to diverse column specifications, overcoming the “one-size-fits-all” limitation of conventional approaches. Crucially, the proposed separation probability $\left( {S}_{p}\right)$ quantifies resolution feasibility under target conditions, providing actionable guidance for experimental design.
整体情况 柱色谱仍然是化学分离的基石,但其优化严重依赖经验性专业知识,导致各实验室存在效率低下和可重复性挑战。本研究通过建立一个专门用于色谱预测的机器学习框架,弥合了传统实践与数据驱动方法之间的差距。将自动化实验平台与QGeoGNN(量子几何信息图神经网络)算法相结合——该模型编码分子三维构象、物理化学描述符和操作参数——能够系统地预测保留体积。通过采用迁移学习,该框架可适应不同的色谱柱规格,克服了传统方法“一刀切”的局限性。至关重要的是,所提出的分离概率 $\left( {S}_{p}\right)$ 量化了目标条件下的分离可行性,为实验设计提供了可操作的指导。
While the model currently focuses on characterized compounds (e.g., synthetic intermediates and products), its architecture inherently supports expansion to broader chemical spaces as datasets grow. The work highlights two paradigm shifts: (1) transitioning from heuristic trial and error to mechanism-informed optimization and (2) decoupling separation challenges into predictable (known components) versus technology-constrained (unknown impurities) categories. These advances not only accelerate reaction purification workflows but also establish a template for integrating domain knowledge into machine learning pipelines across analytical sciences. Future iterations incorporating temperature effects and stationary phase dynamics could further universalize the framework, while community-driven validation through open-source deployment promises to refine its practical utility. By transforming chromatography from an art to a computational-empirical hybrid discipline, this approach lays groundwork for AI-assisted experimentation in synthetic chemistry and beyond.
虽然该模型目前专注于已表征的化合物(如合成中间体和产物),但其架构本质上支持随着数据集的增长扩展到更广泛的化学空间。这项工作突出了两个范式转变:(1)从启发式试错法向基于机理的优化转变;(2)将分离挑战解耦为可预测的(已知成分)与受技术限制的(未知杂质)类别。这些进展不仅加速了反应纯化工作流程,还为将领域知识整合到整个分析科学的机器学习管道中建立了一个模板。未来纳入温度效应和固定相动力学的迭代可以进一步使该框架通用化,而通过开源部署由社区驱动的验证有望完善其实际效用。通过将色谱从一门艺术转变为一门计算 - 经验混合学科,这种方法为合成化学及其他领域的人工智能辅助实验奠定了基础。
SUMMARY
总结
Efficient compound separation remains a persistent challenge in synthetic chemistry, with column chromatography serving as a critical purification tool. Traditional methods require extensive expertise and repetitive labor-areas where AI offers significant advantages. This study introduces an AI-driven platform to automate data collection and optimize separation processes. By leveraging deep learning, the system predicts key separation parameters, while transfer learning enables adaptation to diverse column specifications. A novel metric, separation probability $\left( {S}_{p}\right)$ , quantifies the likelihood of successful component isolation and has been experimentally validated. The approach enhances precision, reduces manual intervention, and expands the scope of chromatographic applications, offering a more efficient and scalable solution for chemical purification.
在合成化学中,高效的化合物分离仍然是一个长期存在的挑战,柱色谱法是一种关键的纯化工具。传统方法需要广泛的专业知识和重复性劳动,而人工智能在这些方面具有显著优势。本研究引入了一个由人工智能驱动的平台,以实现数据收集自动化并优化分离过程。通过利用深度学习,该系统可以预测关键的分离参数,而迁移学习则能够适应不同的色谱柱规格。一种新的指标,分离概率$\left( {S}_{p}\right)$,量化了成功分离组分的可能性,并已通过实验验证。该方法提高了精度,减少了人工干预,扩大了色谱应用的范围,为化学纯化提供了一种更高效、可扩展的解决方案。
introduction
引言
Column chromatography (CC) is a crucial tool ${}^{1}$ in modern chemical research, primarily employed for separating and purifying substances. However, traditional CC methods pose significant challenges in terms of efficiency and accuracy, as they often rely on trial-and-error processes and accumulated experience. Even seasoned researchers often spend considerable time experimenting to identify optimal chromatographic conditions, a process typically marked by inefficiency and time consumption. Moreover, the process of CC necessitates a considerable amount of repetitive and physically demanding work, underscoring the urgent need for improvements in this area.
柱色谱法(CC)是现代化学研究中的一种关键工具${}^{1}$,主要用于分离和纯化物质。然而,传统的柱色谱法在效率和准确性方面面临重大挑战,因为它们通常依赖于反复试验的过程和积累的经验。即使是经验丰富的研究人员也常常花费大量时间进行实验,以确定最佳的色谱条件,这个过程通常效率低下且耗时。此外,柱色谱法的过程需要大量重复且体力要求高的工作,凸显了在这一领域进行改进的迫切需求。
In recent years, the rapid advancement of AI in the field of chemical analysis and process optimization ${}^{2 - 4}$ has opened up new possibilities for improving traditional methods. Due to their powerful expressiveness and ability to accurately model high-dimensional non-linear relationships between variables, data-driven AI methods have shown great potential in the recognition of complex biological samples ${}^{5,6}$ and drug development. ${}^{7,8}$ Chemists have increasingly turned to advanced techniques, including machine learning (ML) and deep learning, to uncover patterns and regularities in complex data, leading to new perspectives and breakthroughs in chemical research. ${}^{9 - {11}}$ In our group, we utilize ML methods in thin-layer chromatography ${\left( \mathrm{{TLC}}\right) }^{{12},{13}}$ and high-performance liquid chromatography ${\left( {HPLC}\right) }^{14}$ to predict the relationship between corresponding chemical structures and their chromatographic retention values. This approach enhances prediction accuracy and reduces experimental workload, providing a more efficient solution for chemical analysis.
近年来,人工智能在化学分析和过程优化领域的迅速发展${}^{2 - 4}$为改进传统方法开辟了新的可能性。由于其强大的表现力和准确建模变量之间高维非线性关系的能力,数据驱动的人工智能方法在复杂生物样品的识别${}^{5,6}$和药物开发中显示出巨大潜力。${}^{7,8}$化学家们越来越多地转向先进技术,包括机器学习(ML)和深度学习,以发现复杂数据中的模式和规律,从而在化学研究中带来新的视角和突破。${}^{9 - {11}}$在我们小组中,我们利用机器学习方法用于薄层色谱法${\left( \mathrm{{TLC}}\right) }^{{12},{13}}$和高效液相色谱法${\left( {HPLC}\right) }^{14}$,以预测相应化学结构与其色谱保留值之间的关系。这种方法提高了预测准确性,减少了实验工作量,为化学分析提供了更高效的解决方案。
From the perspective of a data-driven research paradigm, ML leverages large datasets composed of standardized data. However, despite the fact that CC has been developed for many years, ${}^{1}$ researchers often view it as a tool without systematically collecting experimental conditions and parameters related to the process. Chromatographic datasets often have a large number of missing values and low standardization, which can pose a challenge for further statistic research, even if some data are recorded. Although commercially available automated CC systems save researchers time, they are limited in data collection and device interaction because commercial restrictions prevent open monitoring and automated data processing.
从数据驱动的研究范式来看,机器学习利用由标准化数据组成的数据。然而,尽管柱色谱法已经发展了多年,${}^{1}$研究人员通常将其视为一种工具,而没有系统地收集与该过程相关的实验条件和参数。色谱数据集往往存在大量缺失值且标准化程度低,这对进一步的统计研究可能构成挑战,即使记录了一些数据。尽管市售的自动化柱色谱系统为研究人员节省了时间,但它们在数据收集和设备交互方面存在限制,因为商业限制阻碍了开放监测和自动化数据处理。
To advance the research and application of CC, it is crucial to develop an intelligent automated platform that not only consistently tests different samples and records standardized data but also includes a recommendation system based on ML algorithms. An automated experimental setup was developed first to collect standardized chromatographic data. Advanced ML algorithms were then used in conjunction with extensive experimental data to train and validate the model. The Al-based chromatography model for predicts and optimizing key parameters in the separation process, such as eluent ratio, solvent type, and column type, are crucial for determining separation efficiency, resolution, and purification quality. By accurately adjusting these parameters, the model can significantly enhance the precision and reliability of chromatographic separations, leading to improved outcomes in both research and industrial applications.
为了推进柱色谱法的研究和应用,开发一个智能自动化平台至关重要,该平台不仅要持续测试不同样品并记录标准化数据,还要包括一个基于机器学习算法的推荐系统。首先开发了一个自动化实验装置来收集标准化的色谱数据。然后,先进的机器学习算法与大量实验数据结合使用,以训练和验证模型。基于人工智能的色谱模型用于预测和优化分离过程中的关键参数,如洗脱液比例、溶剂类型和柱类型,这些参数对于确定分离效率、分辨率和纯化质量至关重要。通过准确调整这些参数,该模型可以显著提高色谱分离的精度和可靠性,从而在研究和工业应用中带来更好的结果。
RESULTS
结果
Data acquisition
数据采集
The research paradigm combining automation with ML technology has already demonstrated its significant advantages in the field of chemical research. This interdisciplinary integration has been successfully applied in various chemical studies, ranging from the optimization of reaction conditions ${}^{15}$ to the interpretation of mechanisms. ${}^{16}$ Through an automated platform, as the research pipeline shown in the Figure 1A, we can systematically collect a large volume of experimental data, and ML technology provides powerful tools to analyze these data, revealing hidden patterns and correlations, thereby deepening our understanding of chemical processes.
将自动化与机器学习技术相结合的研究范式已经在化学研究领域展现出显著优势。这种跨学科整合已成功应用于各种化学研究中,从反应条件的优化${}^{15}$到机理的阐释。${}^{16}$ 通过一个自动化平台,如图1A所示的研究流程,我们能够系统地收集大量实验数据,而机器学习技术提供了强大的工具来分析这些数据,揭示隐藏的模式和相关性,从而加深我们对化学过程的理解。
In response to the challenges encountered in CC experiments, an automated device was designed in this work for the efficient collection of standard data. The structural design and operational mechanism of the device are depicted in Figure 1B, with a photographic representation provided in Figure S1. The device comprises four independent modules: the pumping unit, which is responsible for eluent infusion and consists of two pumps and a mixer; the injector, which is responsible for sample loading; the UV detector, which is responsible for detecting spectral signal; and the control terminal, which is responsible for handling these modules for synergistic cooperation. A comprehensive description of the operational procedure can be found in the methods section. This hardware support is the foundation for breaking down the barriers to smart CC. For example, as shown in Figure 1C, a mixture of compounds $\mathbf{A}$ and $\mathbf{B}$ is inputted into the prediction model to obtain separation parameters. The model then sends instructions to the experimental platform, resulting in successful separation of the mixture.
为应对柱色谱实验中遇到的挑战,本研究设计了一种自动化装置用于高效收集标准数据。该装置的结构设计和运行机制如图1B所示,图S1提供了照片展示。该装置由四个独立模块组成:负责洗脱液输注的泵单元,由两个泵和一个混合器组成;负责进样的进样器;负责检测光谱信号的紫外检测器;以及负责处理这些模块以实现协同合作的控制终端。操作程序的详细描述可在方法部分找到。这种硬件支持是突破智能柱色谱障碍的基础。例如,如图1C所示,将化合物$\mathbf{A}$和$\mathbf{B}$的混合物输入预测模型以获得分离参数。然后模型向实验平台发送指令,从而成功分离该混合物。
In precision separation techniques such as CC, the accuracy and reproducibility of results hinge on the meticulous execution of several critical steps. These steps include the precise loading of the sample, the preparation of the mobile phase at a specific ratio, and the real-time capture and analysis of compound separation signals to ascertain the start $\left( {t}_{1}\right)$ and the end $\left( {t}_{2}\right)$ times (s) of the compound’s separation. Subsequently, the process proceeds to the next sample in accordance with the established protocol. Automation technology executes every step of the process, from the loading of samples to the calculation of separation volumes, with a level of precision and consistency that surpasses manual operations. This superior performance is facilitated by the meticulous control exerted over each procedural step. The automated control system ensures uniform experimental conditions, which in turn leads to results that are not only highly comparable but also remarkably reliable. In addition, the modules used in the automated experimental platform are generic and easy to parallel and replicate, which can improve the efficiency of the experiment.
在柱色谱等精密分离技术中,结果的准确性和可重复性取决于几个关键步骤的精心执行。这些步骤包括精确进样、按特定比例制备流动相以及实时捕获和分析化合物分离信号以确定化合物分离的起始$\left( {t}_{1}\right)$和结束$\left( {t}_{2}\right)$时间(s)。随后,按照既定方案对下一个样品进行处理。自动化技术执行从进样到分离体积计算的每一个步骤,其精度和一致性超过手动操作。这种卓越性能得益于对每个程序步骤的精细控制。自动化控制系统确保了统一的实验条件,这反过来又使得结果不仅具有高度可比性,而且非常可靠。此外,自动化实验平台中使用的模块具有通用性,易于并行和复制,这可以提高实验效率。
Nonetheless, the variability in preparative chromatography columns and the differing processes among manufacturers can influence data collection strategies. For example, the Agela Claricep Flash series of preparative chromatography columns, available in common sizes such as 25 and 40 g, are characterized by longer lengths and larger internal diameters, packed with a greater volume of material. This can result in experiments taking anywhere from tens of minutes to several hours to complete, which in turn leads to increased solvent consumption and elevated time-related costs. When planning chromatography experiments, it is crucial to take these experimental conditions into account to optimize the process effectively.
然而,制备色谱柱的差异以及不同制造商之间的不同工艺会影响数据收集策略。例如,常见尺寸为25 g和40 g的Agela Claricep Flash系列制备色谱柱,其特点是长度更长、内径更大,填充的材料体积更大。这可能导致实验耗时从几十分钟到几个小时不等,进而导致溶剂消耗增加和时间相关成本上升。在规划色谱实验时,考虑这些实验条件以有效优化过程至关重要。
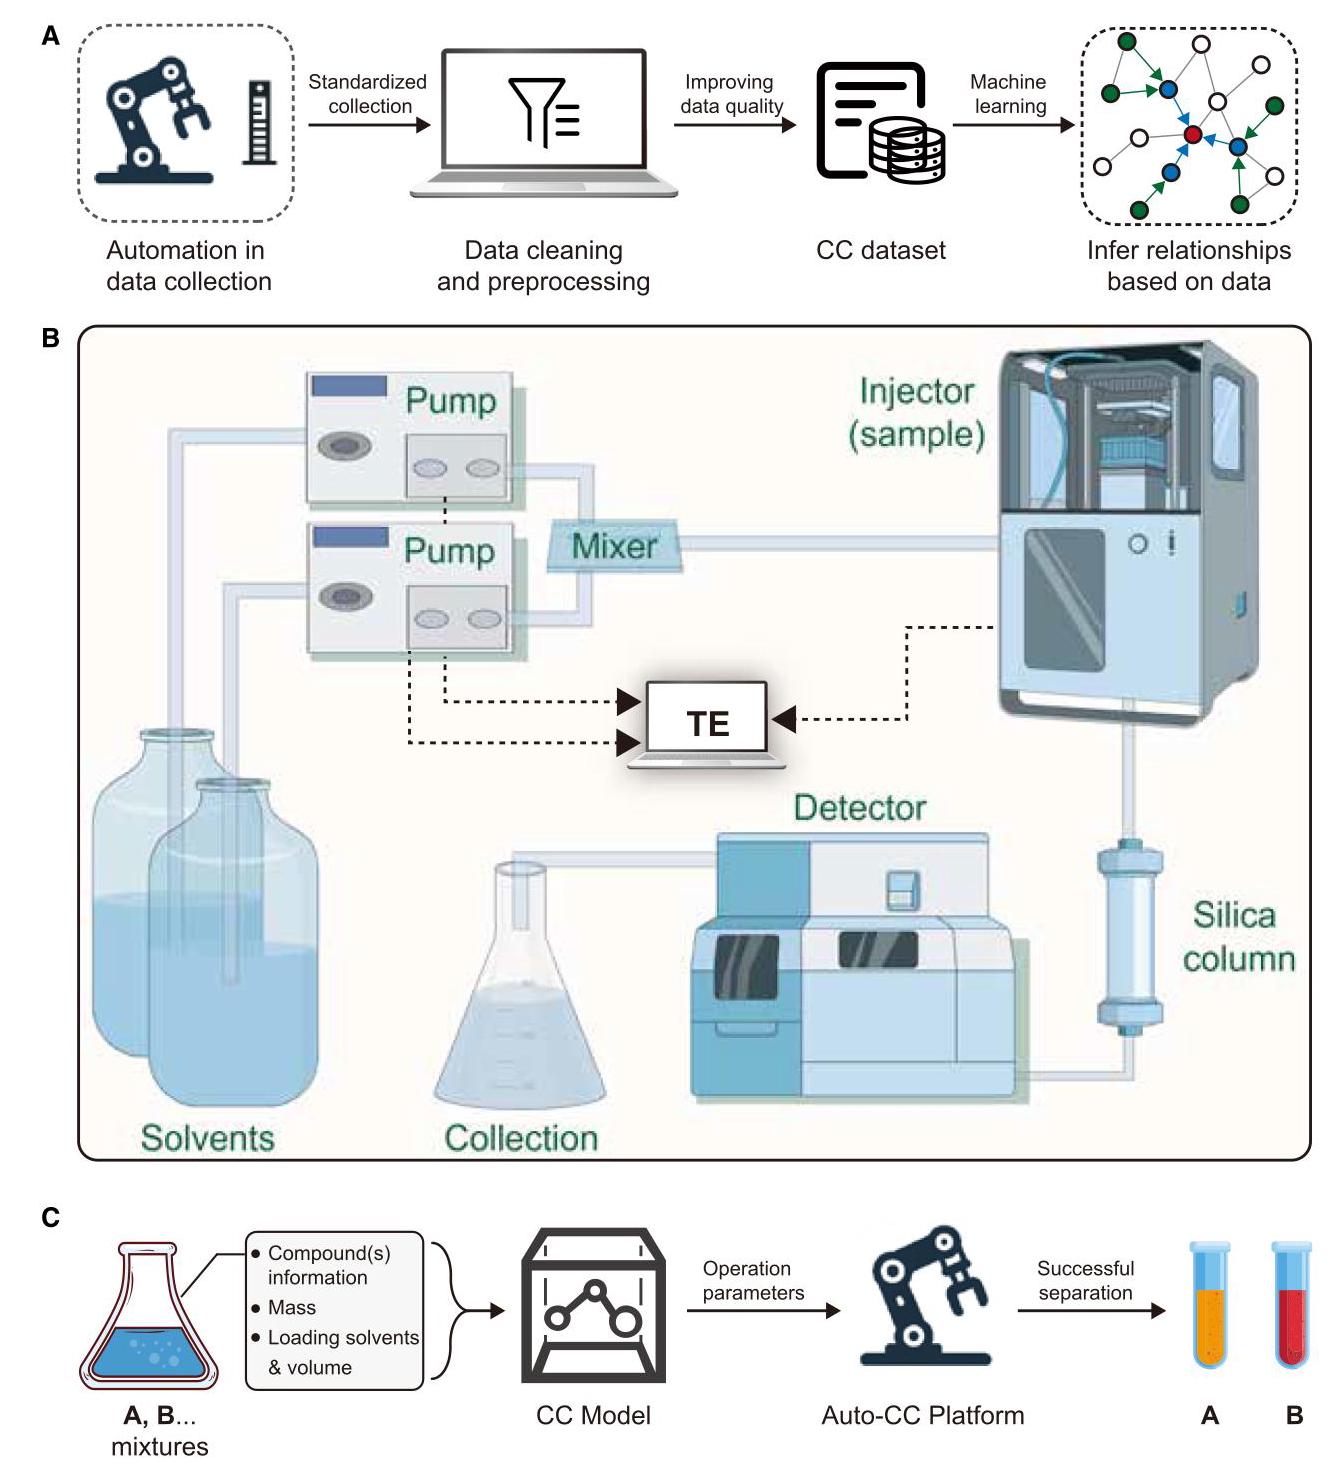
Figure 1. Schematic diagram of main parts
图1. 主要部件示意图
(A) Research pipeline (CC, column chromatography).
(A) 研究流程(CC,柱色谱)。
(B) Schematic of automation platform.
(B) 自动化平台示意图。
(C) Separation process schematic.
(C) 分离过程示意图。
In order to address the aforementioned issue, our investigation focused on employing smaller format columns, such as 4 g columns, for data collection. These columns offer the advantages of reduced experimental time frames and lower solvent usage,
为解决上述问题,我们的研究重点是采用较小规格的色谱柱,如4 g柱,用于数据收集。这些色谱柱具有减少实验时间和降低溶剂使用量的优点,
(legend on next page) which enables the rapid accumulation of a substantial dataset and facilitates the development of a foundational model. We successfully amassed a dataset comprising 4,684 standardized data points for 218 distinct compounds, spanning roughly 20 diverse compound classes, all analyzed using the 4 g columns. Detailed compound’s information can be found in Table S1. To enhance the generalizability of the experimental outcomes, each compound was subjected to testing across three distinct sample volumes and a range of seven eluent ratios at least. Moreover, we pursued selective data acquisition across columns with diverse specifications (Figure S2) and explored the application of transfer learning techniques to accommodate the variability in column characteristics; the forthcoming sections will delve into the specific applications and the effects of these methodologies with a detailed discussion.
(下一页图例) 这使得能够快速积累大量数据集,并有助于基础模型的开发。我们成功积累了一个包含218种不同化合物的4684个标准化数据点的数据集,涵盖约20种不同的化合物类别,所有这些都是使用4 g柱进行分析的。详细的化合物信息可在表S1中找到。为提高实验结果的通用性,每种化合物至少在三个不同的样品体积和七种洗脱液比例范围内进行了测试。此外,我们在具有不同规格的色谱柱上进行了选择性数据采集(图S2),并探索了迁移学习技术的应用以适应色谱柱特性中的变异性;后续章节将通过详细讨论深入探讨这些方法的具体应用和效果。
Basic model with ML techniques
采用机器学习技术的基本模型
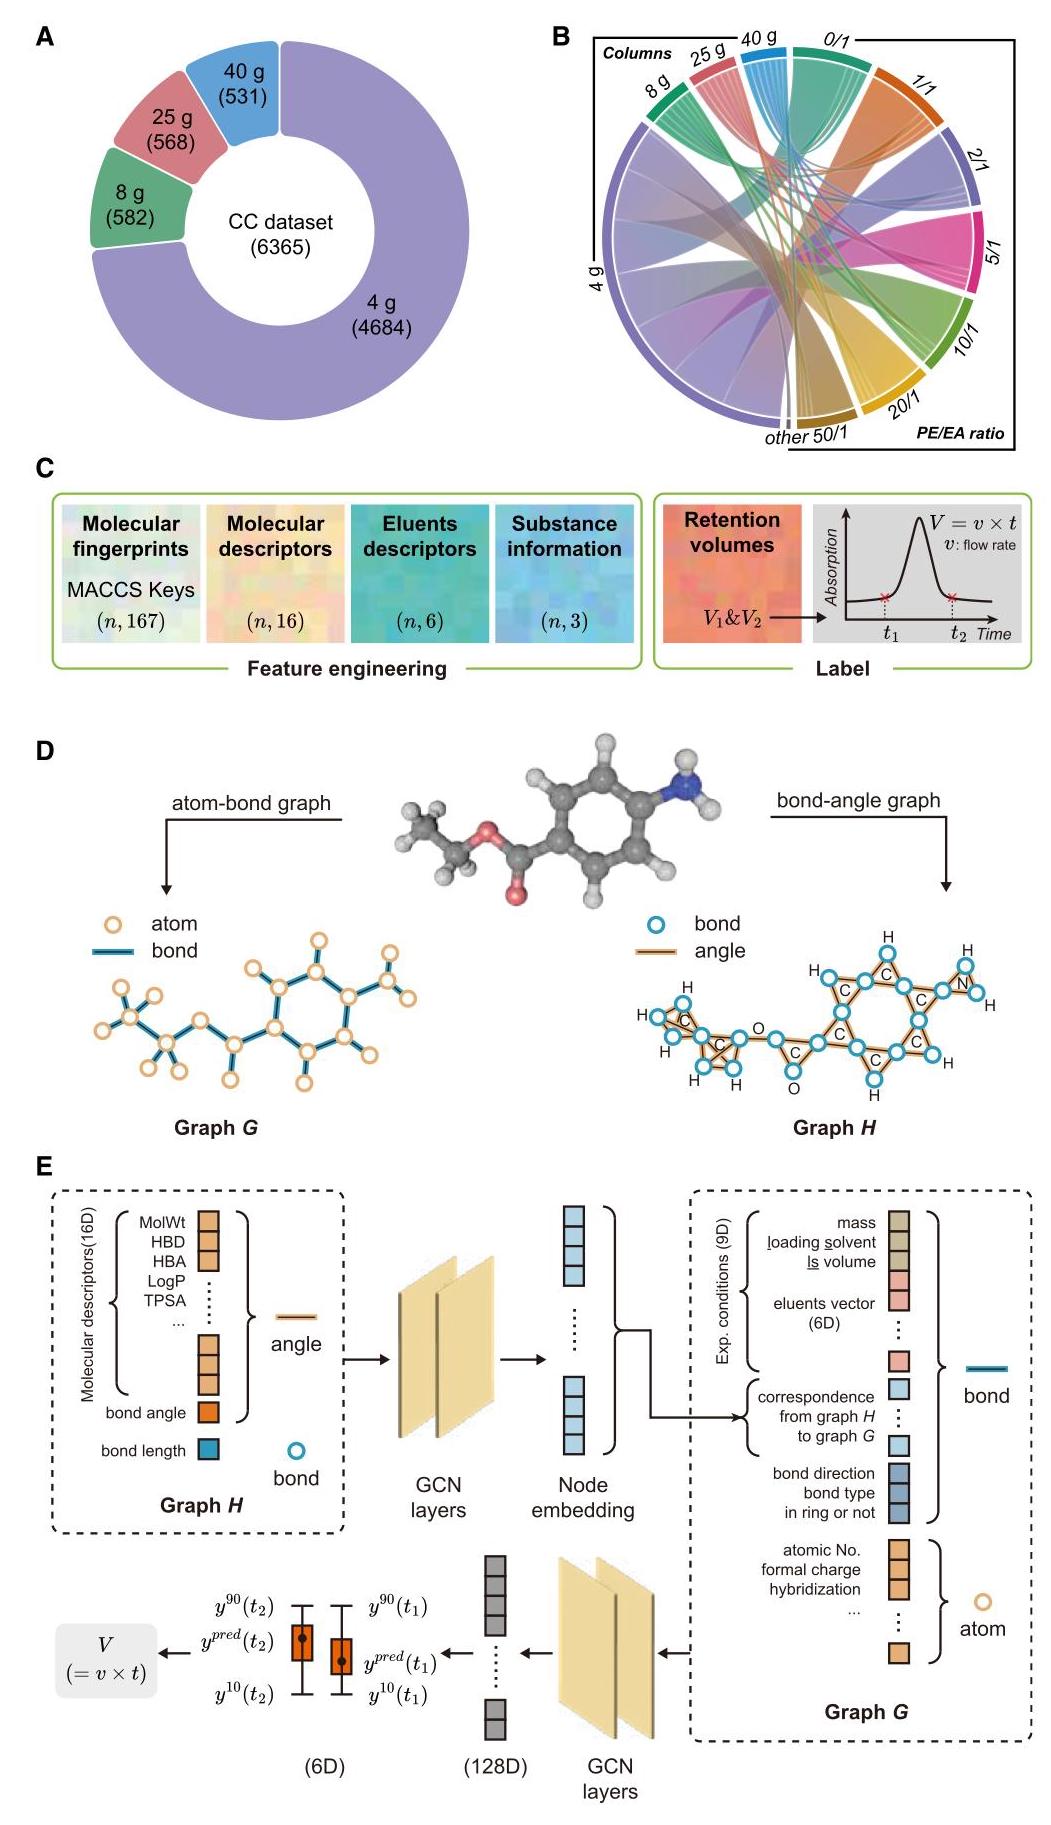
Following the completion of the data collection phase on the automated CC platform, we visualized the entire dataset, as depicted in Figures 2A and 2B. This visualization process clarified the structure of the dataset, which was compiled using four different specifications of chromatography columns, with data evenly distributed across the seven eluent ratios. For the reasons previously discussed, it was necessary to attempt the establishment of a basic model based on the $4\mathrm{\;g}$ dataset. Recognizing that the separation volume is a critical parameter in CC, we conducted an in-depth analysis of the UV spectral curves accurately determining it. This analysis allowed us to pinpoint the separation times for each compound $- {t}_{1}$ , marking the initial detection of the compound, and ${t}_{2}$ , indicating the moment when the compound was fully eluted out from the column. Figure 2C also gives a figurative definition of separation volume in this study, where ${V}_{1}$ and ${V}_{2}$ correspond to the volume of eluent consumed at the start of compound separation and at the time of complete elution, respectively. Thus, we have the following:
在自动柱色谱平台上完成数据收集阶段后,我们对整个数据集进行了可视化处理,如图2A和2B所示。这一可视化过程阐明了数据集的结构,该数据集是使用四种不同规格的色谱柱编译而成的,数据在七种洗脱液比例中均匀分布。出于之前讨论的原因,有必要尝试基于$4\mathrm{\;g}$数据集建立一个基本模型。认识到分离体积是柱色谱中的一个关键参数,我们对紫外光谱曲线进行了深入分析,以准确确定它。这一分析使我们能够精确找出每种化合物$- {t}_{1}$的分离时间,即化合物的初始检测时间,以及${t}_{2}$,即化合物从柱中完全洗脱出来的时刻。图2C还给出了本研究中分离体积的形象定义,其中${V}_{1}$和${V}_{2}$分别对应化合物分离开始时和完全洗脱时消耗的洗脱液体积。因此,我们有以下内容:
$$ {V}_{1} = v \times {t}_{1} $$(Equation 1)
$$ {V}_{2} = v \times {t}_{2}, $$(Equation 2)
(方程2)
$$ {\Delta V} = {V}_{2} - {V}_{1} = v \times \left( {{t}_{2} - {t}_{1}}\right) . $$(Equation 3)
Before constructing the ML model, appropriate feature engineering is needed to capture all the important factors that need to be considered in the experiment. Mechanistically, the main factors influencing the $V$ value are molecular polarity and experimental conditions. Molecular polarity is directly related to a compound’s structure and properties. The molecular access system (MACCS) keys are widely utilized structural keys that encapsulate information about the molecular structure, its fragments, and substructures. These keys allow for the transformation of any compound into a 167-dimensional representation. Additionally, the RDKit software facilitates the straightforward extraction of sixteen kinds of molecular properties (detailed in methods section), including total polar surface area (TPSA), molecular weight (MolWt), and the number of hydrogen bond donors (HBDs), etc. Moreover, there are several key parameters for CC experiments that need to be integrated, including the proportion of eluents, the type of loading eluent (e), compound mass (m), and the volume of loading eluent $\left( {V}_{e}\right)$ , converting these into algorithmic terms would result in a set of 9-dimensional experimental parameter features, consisting of 6-dimensional weighted descriptors for solvents and three-dimensional CC column information. In a systematic investigation to ascertain the predictive accuracy of diverse ML strategies, we scrutinized three distinct algorithms: light gradient boosting machine (LGB), artificial neural networks (ANNs), and graph neural networks (GNNs). Various algorithms handle parameters differently. For traditional algorithms such as LGB and ANN, parameters such as the feature engineering shown in Figure 2C are inputted directly into the training function without any special handling.
在构建机器学习模型之前,需要进行适当的特征工程,以捕捉实验中所有需要考虑的重要因素。从机理上讲,影响$V$值的主要因素是分子极性和实验条件。分子极性与化合物的结构和性质直接相关。分子访问系统(MACCS)键是广泛使用的结构键,它封装了有关分子结构、其片段和子结构的信息。这些键允许将任何化合物转化为167维表示。此外,RDKit软件便于直接提取十六种分子性质(在方法部分详细介绍),包括总极性表面积(TPSA)、分子量(MolWt)和氢键供体数量(HBDs)等。此外,柱色谱实验还有几个关键参数需要整合,包括洗脱液比例、加载洗脱液类型(e)、化合物质量(m)和加载洗脱液体积$\left( {V}_{e}\right)$,将这些转化为算法术语将得到一组9维实验参数特征,由6维溶剂加权描述符和3维柱色谱柱信息组成。在系统研究以确定各种机器学习策略的预测准确性时,我们仔细研究了三种不同的算法:轻梯度提升机(LGB)、人工神经网络(ANNs)和图神经网络(GNNs)。各种算法处理参数的方式不同。对于LGB和ANN等传统算法,如图2C所示的特征工程等参数直接输入训练函数,无需任何特殊处理。
In our previous study, ${}^{14}$ we explored a geometry-enhanced GNN approach to molecular representation. This approach utilizes the natural graphical properties of molecular structures and integrates problem-relevant features into the graph representation. It combines the 3D conformation of the molecule, experimental conditions, relevant descriptors, and quantile learning techniques ${}^{17}$ to meet the specific needs of the chemical domain. The use of the quantile learning technique is essential to capture the uncertainty in the training process, providing a reasonable confidence interval for the predicted results. Additionally, combining expertise in mathematical modeling of chromatographic processes and column properties with ML algorithms further enhances the predictive accuracy of the models. This integrated approach has improved the efficiency and quality of data collection. It also provides a solid foundation for predictive modeling in CC. This is expected to lead to significant advances in the field of chemical analysis and purification.
在我们之前的研究中,${}^{14}$我们探索了一种几何增强的图神经网络方法用于分子表示。这种方法利用分子结构的自然图形属性,并将与问题相关的特征整合到图形表示中。它结合了分子的3D构象、实验条件、相关描述符和分位数学习技术${}^{17}$,以满足化学领域的特定需求。分位数学习技术的使用对于捕捉训练过程中的不确定性至关重要,为预测结果提供了合理的置信区间。此外,将色谱过程和柱性质的数学建模专业知识与机器学习算法相结合,进一步提高了模型的预测准确性。这种综合方法提高了数据收集的效率和质量。它还为柱色谱中的预测建模提供了坚实的基础。这有望在化学分析和纯化领域带来重大进展。
Building on the foundation established by our geometry-enhanced GNN, this study further refines the application of GNNs in CC. The enhanced model not only maintains the integration of critical parameters but also leverages advanced algorithmic strategies to optimize the network structure. As illustrated in Figure 2D, the 3D conformation of a molecule can be divided into a graph G describing atom-bond and a graph H describing bond angle. Figure 2E provides a detailed illustration of the network architecture formation. The model’s feature input comprises 9-dimensional experimental parameter features and 16-dimensional molecular features, which are embedded into two distinct graph representations. In concrete terms, the 9-dimensional experimental parameter features are embedded
基于我们的几何增强图神经网络建立的基础,本研究进一步完善了图神经网络在柱色谱中的应用。增强后的模型不仅保持了关键参数的整合,还利用先进的算法策略优化了网络结构。如图2D所示,分子的3D构象可分为描述原子键的图G和描述键角的图H。图2E提供了网络架构形成的详细说明。模型的特征输入包括9维实验参数特征和16维分子特征,它们被嵌入到两个不同的图形表示中。具体来说,9维实验参数特征被嵌入
Figure 2. Dataset distribution and feature engineering
图2. 数据集分布和特征工程
(A) Column specifications for number distribution.
(A) 柱规格的数量分布。
(B) Distribution of the amount of data according to the proportion of eluents.
(B) 根据洗脱液比例的数据量分布。
(C) Feature engineering for ANN and LGB.
(C) 人工神经网络和轻梯度提升机的特征工程。
(D) The schematic instruction of atom-bond graph G and bond-angle graph H.
(D) 原子键图G和键角图H的示意图说明。
(E) Schematic diagram of QGeoGNN hierarchy. into the edge features of graph G, representing experimental data. These edge features reflect the various proportions of eluents used in the chromatography experiments and other key experimental parameters, providing specific information about the experimental conditions to the model. Afterward, the 16-dimensional molecular features are embedded into the edge features of graph H. These molecular features, which include chemical and physical properties of the molecules, are crucial for capturing the interaction between molecules and silica particles, essential for predicting their behavior in CC. By utilizing graph isomorphism convolution (GIC) techniques, ${}^{18}$ the model effectively captures complex relationships and patterns between molecules and silica particles. This approach demonstrates superior performance compared with traditional methods, making it a valuable tool for predicting molecular behavior in CC. In the case of GNN, the column information is structured in a comparable manner and integrated into graph G. Further implementation details of these models are outlined in the methods section.
(E) QGeoGNN层次结构示意图。进入图G的边特征,代表实验数据。这些边特征反映了色谱实验中使用的洗脱剂的各种比例以及其他关键实验参数,为模型提供了有关实验条件的特定信息。之后,将16维分子特征嵌入到图H的边特征中。这些分子特征包括分子的化学和物理性质,对于捕获分子与硅胶颗粒之间的相互作用至关重要,而这对于预测它们在柱色谱中的行为至关重要。通过利用图同构卷积(GIC)技术,${}^{18}$模型有效地捕获了分子与硅胶颗粒之间的复杂关系和模式。与传统方法相比,这种方法表现出卓越的性能,使其成为预测柱色谱中分子行为的有价值工具。在GNN的情况下,柱信息以类似的方式构建并集成到图G中。这些模型的进一步实现细节在方法部分中概述。
These models, each with inherent advantages and idiosyncrasies, were evaluated to furnish a holistic view of the efficacy of varied algorithms in processing chemical datasets. For this analysis, the dataset pertaining to CC was judiciously partitioned into three subsets: 80% was dedicated to the training set, with the remainder equally divided between validation and test sets (10% each). This stratagem was intended to allocate ample data for model training while reserving independent subsets for validation and testing, thereby facilitating a robust assessment of the models’ generalization capacities and empirical predictive prowess. The training set underpinned model learning and parameter optimization, the validation set served for model selection and hyperparameter refinement, and the test set was utilized for the ultimate evaluation of predictive performance. This methodological approach enabled a rigorous comparison of the performances of diverse ML algorithms on a uniform dataset, laying a scientific foundation for the selection of the most apt model for predicting outcomes in CC. Such a step is indispensable for guaranteeing the model’s reliability and precision, particularly when navigating the complexities inherent in chemical data analysis, where disparate ML models may demonstrate markedly different performance profiles.
这些模型各有其固有优势和特性,经过评估以全面了解各种算法在处理化学数据集方面的功效。对于此分析,与柱色谱相关的数据集被明智地划分为三个子集:80%用于训练集,其余部分平均分为验证集和测试集(各10%)。这种策略旨在为模型训练分配充足的数据,同时保留独立的子集用于验证和测试,从而便于对模型的泛化能力和经验预测能力进行稳健评估。训练集为模型学习和参数优化提供支持,验证集用于模型选择和超参数细化,测试集用于预测性能的最终评估。这种方法能够在统一数据集上对各种机器学习算法性能进行严格比较,为选择最适合预测柱色谱结果的模型奠定科学基础。这一步骤对于确保模型的可靠性和精度至关重要,特别是在处理化学数据分析中固有的复杂性时,不同的机器学习模型可能表现出明显不同的性能特征。
The study’s model learning was based on data from a $4\mathrm{\;g}$ chromatography column, with the results shown in Figure 3A and Table 1. These results indicate that the LGB, a tree-based model, has somewhat limited predictive accuracy, with ${R}^{2}$ values for ${V}_{1}$ and ${V}_{2}$ being only around 0.69. While both ANN and QGeoGNN (quantum geometry-informed graph neural network) achieve comparable performance (with closely aligned ${R}^{2}$ values), their underlying mechanisms differ: ANN, as a general-purpose neural network, excels at processing structured data but may struggle to capture nuanced molecular interactions, whereas QGeoGNN integrates GNNs with molecular geometric features (e.g., conformations and stereochemistry) that critically influence chromatographic retention dynamics. Drawing from prior work in the HPLC domain, it is noted that QGeoGNN is capable of integrating both experimental parameters and molecular features effectively. Importantly, as the volume of data increases, the predictive performance of QGeoGNN shows an upward trend, which is crucial for handling large-scale chromatography data. Furthermore, it is observed that traditional GNN, which only include a single graph representation (graph G), perform relatively poorly in terms of ${R}^{2}$ . Based on the analysis and findings, the decision to utilize the QGeoGNN to construct a predictive model for CC is well founded. This choice is predicated on the advantages of QGeoGNN in handling complex chemical data, as well as its potential for enhanced performance in a big data environment. The implementation of QGeoGNN is expected to make the CC prediction model more promising, offering more accurate predictions for compound separation.
该研究的模型学习基于来自$4\mathrm{\;g}$色谱柱的数据,结果如图3A和表1所示。这些结果表明,基于树的模型LGB的预测准确性有些有限,${R}^{2}$对于${V}_{1}$和${V}_{2}$的值仅约为0.69。虽然人工神经网络(ANN)和量子几何信息图神经网络(QGeoGNN)都取得了可比的性能(${R}^{2}$值相近),但其底层机制不同:作为通用神经网络,ANN擅长处理结构化数据,但可能难以捕捉细微的分子相互作用,而QGeoGNN将图神经网络与对色谱保留动力学有关键影响的分子几何特征(如构象和立体化学)相结合。借鉴高效液相色谱(HPLC)领域的先前工作,注意到QGeoGNN能够有效地整合实验参数和分子特征。重要的是,随着数据量的增加,QGeoGNN的预测性能呈上升趋势,这对于处理大规模色谱数据至关重要。此外,观察到仅包括单个图表示(图G)的传统图神经网络在${R}^{2}$方面表现相对较差。基于分析和发现,利用QGeoGNN构建柱色谱预测模型的决定是有充分依据的。这一选择基于QGeoGNN在处理复杂化学数据方面的优势及其在大数据环境中性能提升的潜力。预计QGeoGNN的实现将使柱色谱预测模型更具前景,为化合物分离提供更准确的预测。
To comprehensively assess the performance of our developed predictive model, a series of tests were conducted. These tests were designed to reveal the model’s behavior under various conditions, including the relationship between compound structural similarity (tanimoto coefficient) and model prediction error (i.e., mean absolute error [MAE]), as well as the impact of training set proportion and noise ratio on model prediction accuracy $\left( {R}^{2}\right)$ . Initially, we explored the relationship between compound similarity and MAE through 20-fold cross-validation (Figure 3B). The results indicate that higher compound similarity corresponds to lower error in predicting separation volume, aligning with the general expectation that models predict chromatographic behavior more accurately when the structural similarity of compounds is high. Experimental data demonstrated that the ${R}^{2}$ value tends to stabilize when the training set proportion exceeds 50% and the noise ratio is maintained below 20% (Figures 3C and 3D). This suggests that under these conditions of dataset size and noise level, the model achieves robust predictive performance, indicating its resilience to training data quantity and noise. Furthermore, validation experiments were conducted to determine whether different compounds mixed together have the same retention volume as they do when in pure form. The experiments were performed on a few compounds that separated under specified conditions. The results (Figure S3) demonstrated that when the compounds have no interaction with each other and are within the appropriate mass range, their retention volume remains the same when mixed together as it does when they are in pure form.
为了全面评估我们开发的预测模型的性能,我们进行了一系列测试。这些测试旨在揭示模型在各种条件下的行为,包括化合物结构相似性(Tanimoto系数)与模型预测误差(即平均绝对误差[MAE])之间的关系,以及训练集比例和噪声率对模型预测准确性$\left( {R}^{2}\right)$的影响。最初,我们通过20倍交叉验证探索了化合物相似性与MAE之间的关系(图3B)。结果表明,化合物相似性越高,预测分离体积时的误差越低,这与一般预期一致,即当化合物的结构相似性较高时,模型能更准确地预测色谱行为。实验数据表明,当训练集比例超过50%且噪声率保持在20%以下时,${R}^{2}$值趋于稳定(图3C和3D)。这表明在数据集大小和噪声水平的这些条件下,模型实现了稳健的预测性能,表明其对训练数据量和噪声的适应性。此外,进行了验证实验,以确定不同化合物混合在一起时的保留体积是否与它们以纯形式存在时相同。这些实验是在一些在特定条件下分离的化合物上进行的。结果(图S3)表明,当化合物彼此之间没有相互作用且在适当的质量范围内时,它们混合在一起时的保留体积与以纯形式存在时相同。
Transfer learning
迁移学习
In the context of this study, 90% of our dataset comprises data from 4 g chromatography columns, resulting in a relatively homogeneous dataset and limited model generalization. However, in real experimental scenarios, chromatography columns come in various specifications. To address this, we implemented a transfer learning strategy, ${}^{{19} - {21}}$ enabling the model trained on $4\mathrm{\;g}$ data to be applicable to a wider range of column specifications, thereby enhancing its adaptability and performance across diverse datasets. The quintessence of transfer learning lies in its capacity to leverage knowledge acquired from one task to bolster learning efficiency and performance on another, closely related task. In this vein, specific segments of the extant model were meticulously adjusted to more aptly align with the requirements of the new dataset, thus epitomizing the strategic application of transfer learning principles in our research.
在本研究的背景下,我们90%的数据集由来自4g色谱柱的数据组成,导致数据集相对同质化,模型泛化能力有限。然而,在实际实验场景中,色谱柱有各种规格。为了解决这个问题,我们实施了一种迁移学习策略,${}^{{19} - {21}}$使在$4\mathrm{\;g}$数据上训练的模型能够适用于更广泛的色谱柱规格,从而提高其在不同数据集上的适应性和性能。迁移学习的精髓在于其能够利用从一项任务中获得的知识来提高另一项密切相关任务的学习效率和性能。在这方面,对现有模型的特定部分进行了精心调整,以更恰当地符合新数据集的要求,从而体现了迁移学习原理在我们研究中的战略应用。
In the input layer of the model, we integrated information pertinent to new chromatographic column specifications (Figure 4A). This integration is a critical step as it enables the model to accommodate and process the unique characteristics of new chromatographic columns, ensuring the model’s ability to recognize and adapt to these novel operational conditions. The output layer of the model underwent updates to account for variations that different column specifications might introduce to the final results. Consequently, adjustments to the model’s final stages were necessary to accurately predict outputs for new specifications. This approach allows the model to adapt to new output requirements while retaining its existing knowledge base.
在模型的输入层,我们整合了与新色谱柱规格相关的信息(图4A)。这种整合是关键的一步,因为它使模型能够适应和处理新色谱柱的独特特性,确保模型识别和适应这些新操作条件的能力。模型的输出层进行了更新,以考虑不同色谱柱规格可能对最终结果产生的变化。因此,有必要对模型的最后阶段进行调整,以准确预测新规格的输出。这种方法使模型能够适应新的输出要求,同时保留其现有的知识库。
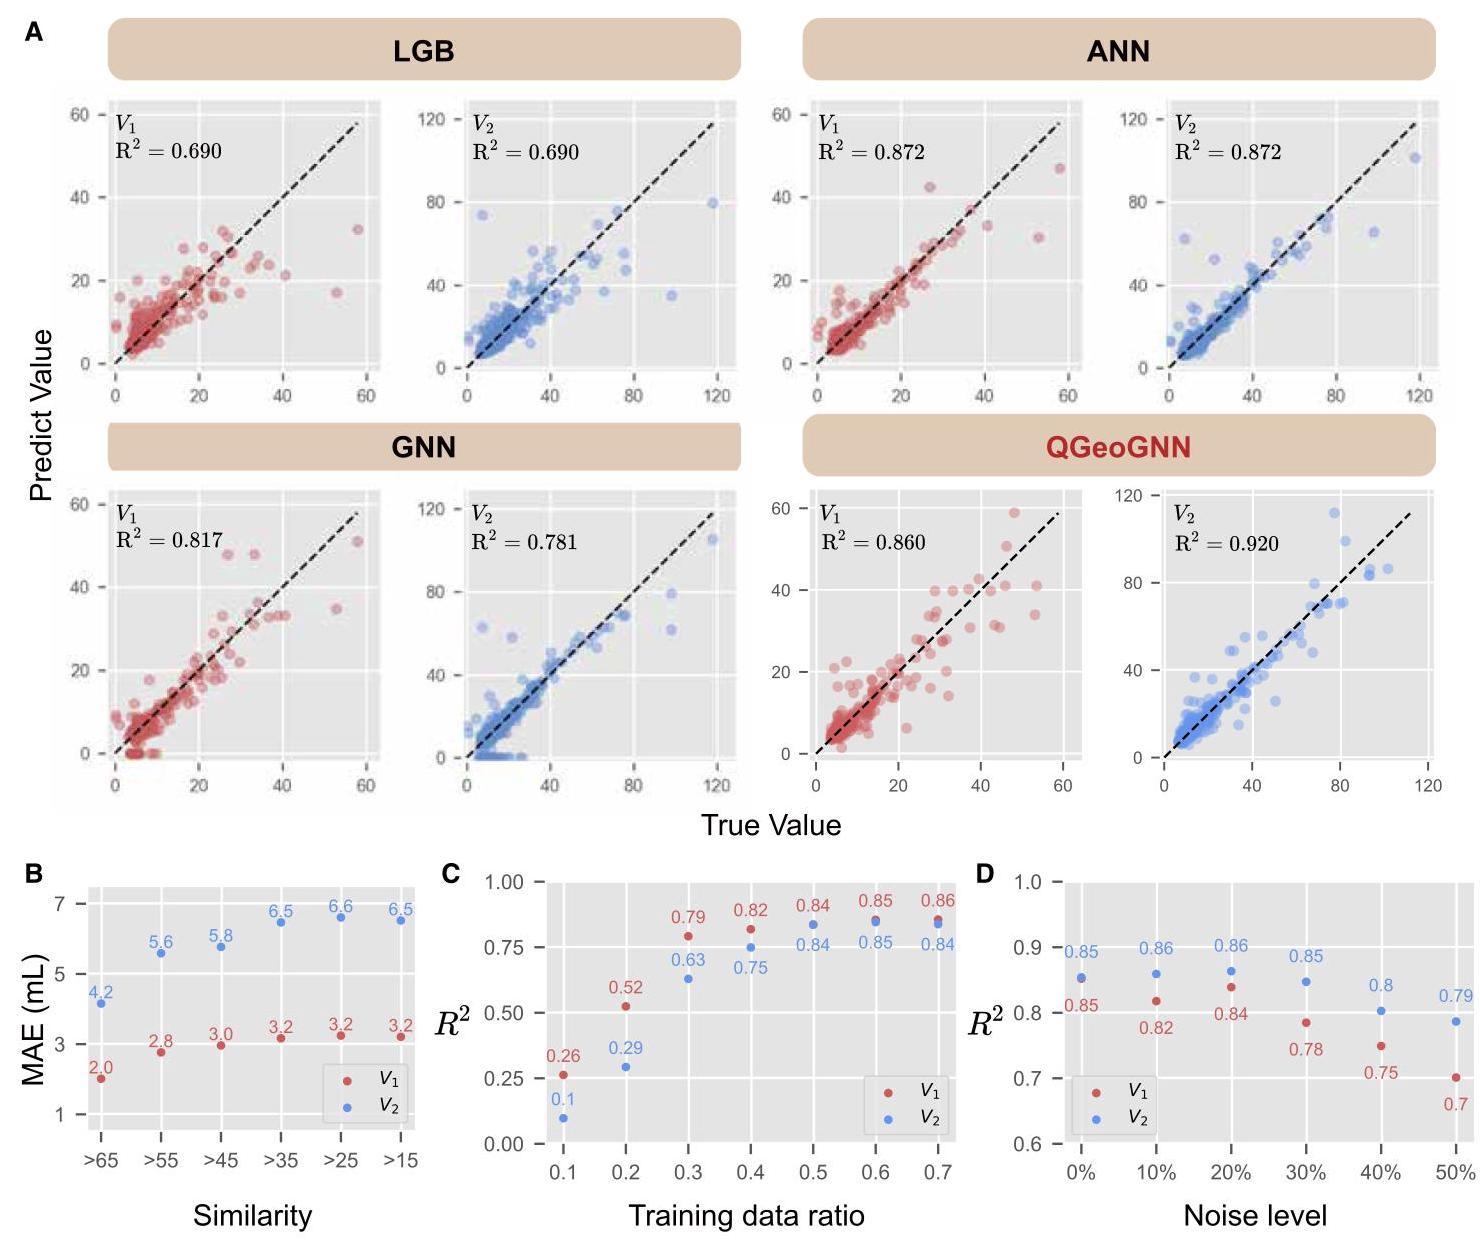
Figure 3. The training results of the basic model
图3. 基本模型的训练结果
(A) Training outcomes of different ML algorithms based on 4 g-dataset.
(A) 基于4g数据集的不同机器学习算法的训练结果。
(B) Dependence of MAE on structural similarity (tanimoto coefficient).
(B) 平均绝对误差对结构相似性(塔尼莫托系数)的依赖性。
(C) Impact of the training set proportion on ${R}^{2}$ .
(C) 训练集比例对${R}^{2}$的影响。
(D) Influence of Gaussian noise ratio on ${R}^{2}$ .
(D) 高斯噪声比例对${R}^{2}$的影响。
Table 1. Quantitative metrics for $4\mathrm{\;g}$ base models using distinct algorithms
表1. 使用不同算法的$4\mathrm{\;g}$基础模型的定量指标
| Algo | ${R}^{2}\left( {V}_{1}\right) \uparrow$ | ${R}^{2}\left( {V}_{2}\right) \uparrow$ | MAE $\left( {V}_{1}\right) \downarrow$ | MAE $\left( {V}_{2}\right) \downarrow$ | RMSE $\left( {V}_{1}\right) \downarrow$ | RMSE $\left( {V}_{2}\right) \downarrow$ |
| LGB | 0.690 | 0.690 | 1.792 | 3.504 | 3.307 | 5.991 |
| ANN | 0.872 | 0.872 | 1.381 | 2.218 | 2.512 | 4.483 |
| GNN | 0.817 | 0.781 | 1.744 | 3.322 | 2.901 | 6.303 |
| QGeoGNN | 0.859 | 0.913 | 1.452 | 2.475 | 2.649 | 4.235 |
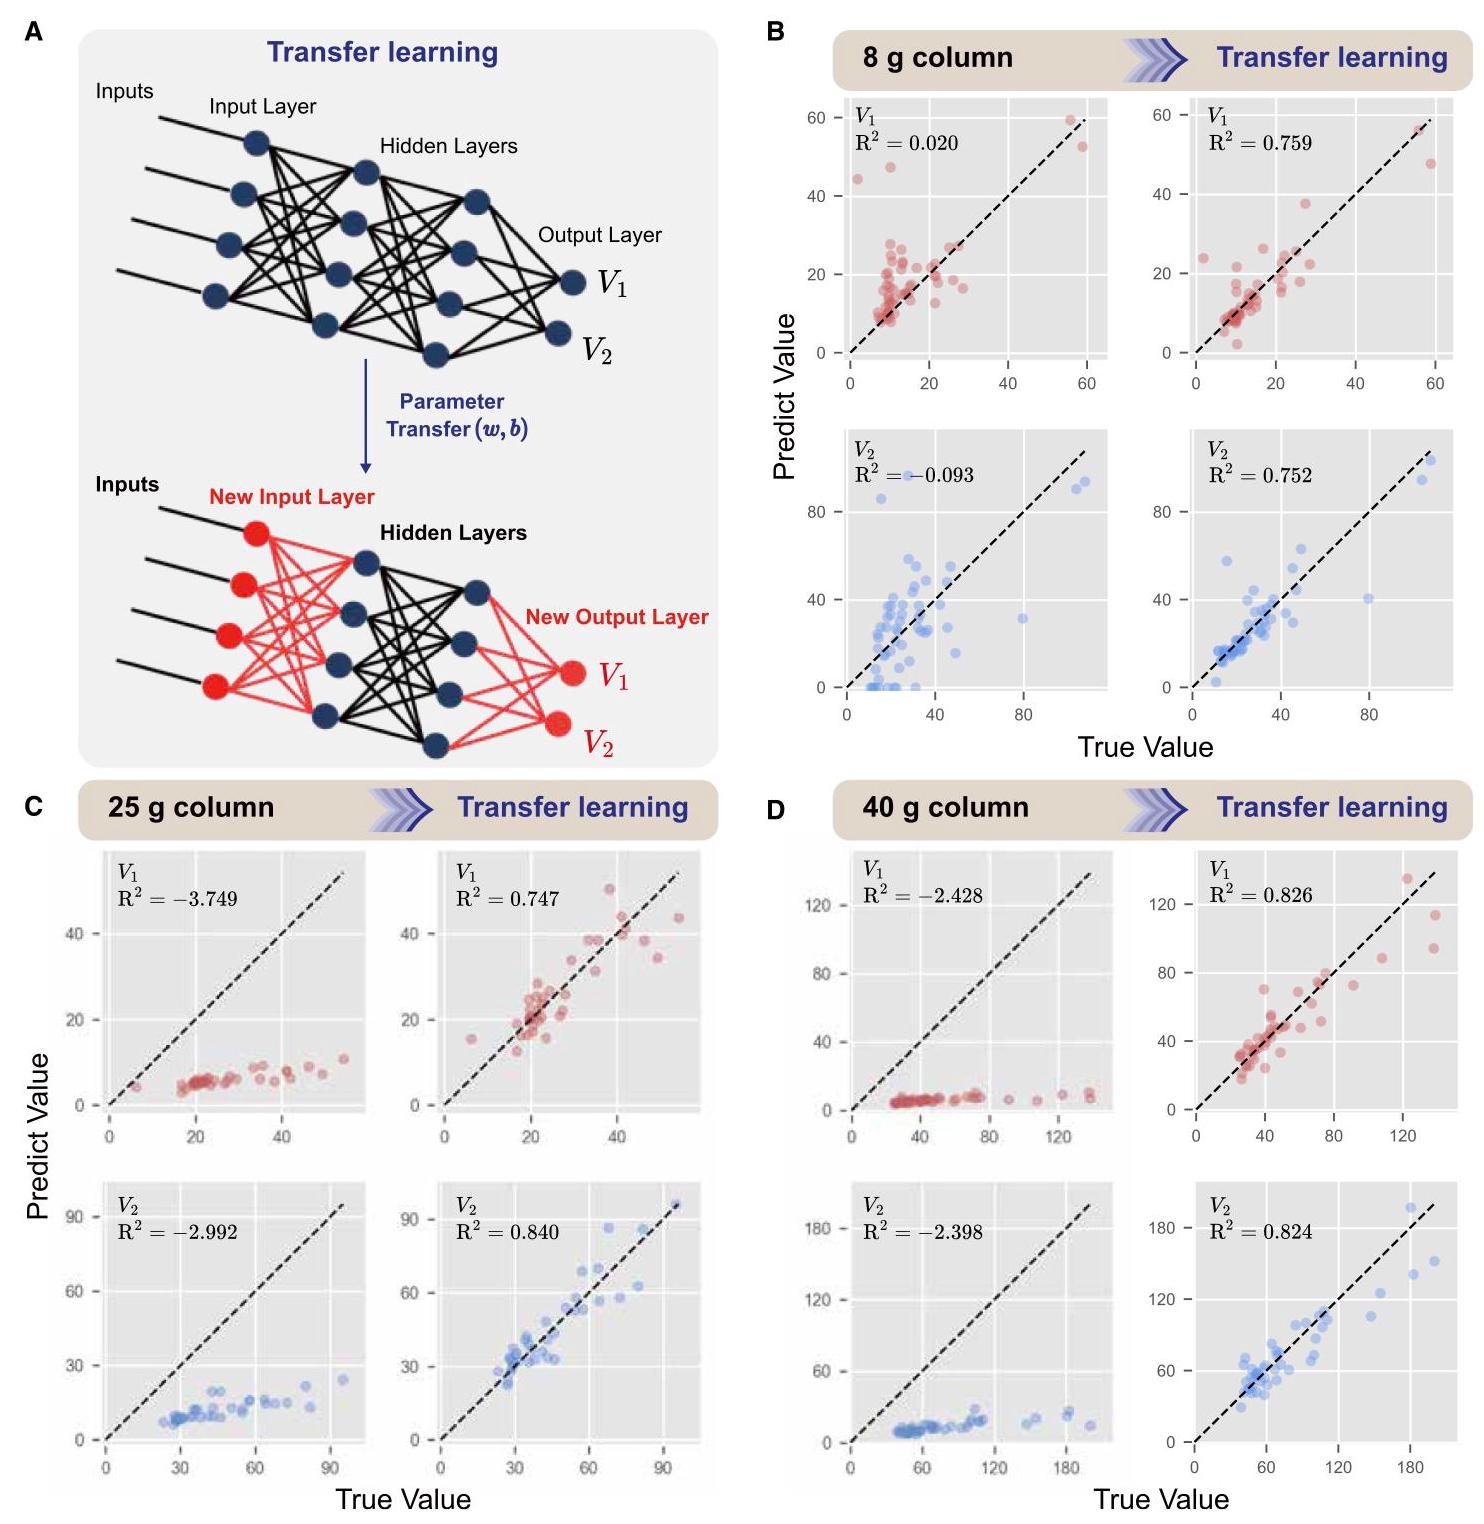
Figure 4. Transfer learning and training results
图4. 迁移学习和训练结果
(A) Transfer learning process.
(A) 迁移学习过程。
(B-D) Training results from the application of transfer learning to the 8, 25, and 40 g column datasets using the QGeoGNN model initially developed for the 4 g.
(B - D) 使用最初为4g开发的QGeoGNN模型对8g、25g和40g色谱柱数据集应用迁移学习的训练结果。
During the application of transfer learning, we opted for a strategy that involved transferring the parameters of the original network to a new network and adopted a lower learning rate $\left( {10}^{-4}\right)$ during the training part. Compared with the data volume for the $4\mathrm{\;g}$ column, these smaller-scale tasks could lead to over-fitting ${}^{{22},{23}}$ when training complex models like QGeoGNN from scratch. This decision was primarily based on the following considerations: due to the limited amount of data, it is crucial to avoid overfitting. ${}^{24}$ To achieve this, we employed a pre-trained model and applied a lower learning rate to fine-tune it, thus ensuring more stable and generalized performance. ${}^{25}$ Additionally, we leveraged features learned from the $4\mathrm{\;g}$ base model,
在应用迁移学习时,我们选择了一种将原始网络的参数转移到新网络的策略,并在训练部分采用了较低的学习率$\left( {10}^{-4}\right)$。与$4\mathrm{\;g}$色谱柱的数据量相比,这些规模较小的任务在从头开始训练像QGeoGNN这样的复杂模型时可能会导致过拟合${}^{{22},{23}}$。这一决定主要基于以下考虑:由于数据量有限,避免过拟合至关重要。${}^{24}$为了实现这一点,我们采用了预训练模型并应用较低的学习率对其进行微调,从而确保更稳定和泛化的性能。${}^{25}$此外,我们利用从$4\mathrm{\;g}$基础模型中学到的特征,
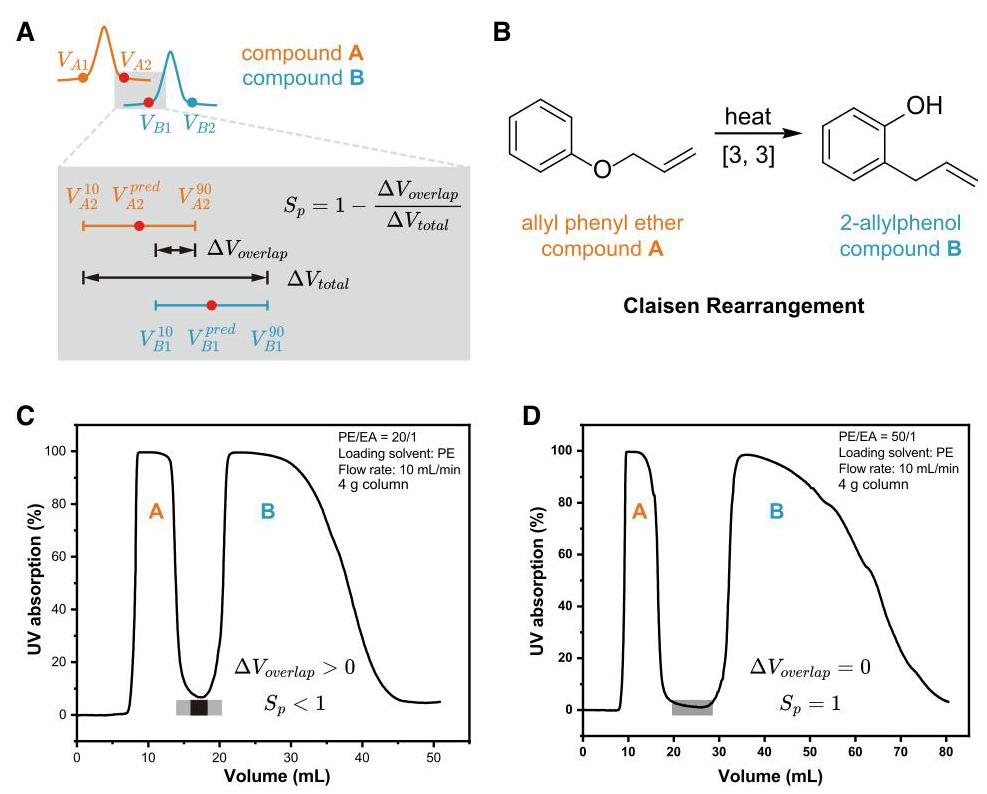
Figure 5. Application of ${S}_{p}$ in CC predictive model
图5. ${S}_{p}$在CC预测模型中的应用
(A) Schematic diagram of ${S}_{p}$ calculation. (B) The classic Claisen rearrangement reaction. (C and D) Wet laboratory validation based on model prediction results. such as 3D molecular information, to expedite training and conserve computational resources and time for the new models. ${}^{26}$ By gradually adjusting the model weights, we can more effectively balance the knowledge between the new and the old datasets, thereby enhancing the model’s generalization performance in new chromatographic column specifications.
(A) ${S}_{p}$计算示意图。(B) 经典克莱森重排反应。(C和D) 基于模型预测结果的湿实验室验证。例如3D分子信息,以加快训练速度,并为新模型节省计算资源和时间。${}^{26}$通过逐步调整模型权重,我们可以更有效地平衡新旧数据集之间的知识,从而提高模型在新色谱柱规格下的泛化性能。
Operationally, we selected the basic model with the minimum MAE on the $4\mathrm{\;g}$ column, updated its output layer, and fine-tuned these parts using parameters from the new tasks. The application of transfer learning methods to chromatography column datasets of different specifications (8, 25, and 40 g) and the comparison of their effectiveness against direct training methods reveal significant insights. Specifically, for the $8\mathrm{\;g}$ column (Figure 4B), we initially employed the same direct training approach used for the $4\mathrm{\;g}$ column. However, this approach yielded lower prediction accuracy, with ${R}^{2}$ values for ${V}_{1}$ and ${V}_{2}$ being only 0.02 and -0.093 , respectively. This outcome indicates that the direct training method is not sufficiently effective when dealing with new chromatography column specifications. In contrast, the application of the transfer learning method resulted in a significant improvement in the model’s predictive capabilities. Specifically, on the $8\mathrm{\;g}$ chromatography column dataset, the model adjusted through transfer learning achieved ${R}^{2}$ values of 0.759 and 0.752 for ${V}_{1}$ and ${V}_{2}$ , respectively. Similarly, we observed a comparable trend in datasets for the 25 and 40 g chromatography columns (Figures 4C and 4D). Furthermore, we investigated the potential for extending the dichloromethane/methanol (DCM/MeOH) eluent system and conducted additional experiments on bonded columns. We discovered that transfer learning improved performance in both scenarios, with the ${R}^{2}$ values increasing from approximately 0 to nearly 0.6 (Figure S4). This substantial improvement not only validates the effectiveness of transfer learning in enhancing model predictive capability but also highlights its suitability for handling data from chromatography columns of varying specifications and eluent systems.
在操作上,我们在$4\mathrm{\;g}$柱上选择了具有最小平均绝对误差(MAE)的基本模型,更新其输出层,并使用新任务的参数对这些部分进行微调。将迁移学习方法应用于不同规格(8克、25克和40克)的色谱柱数据集,并将其有效性与直接训练方法进行比较,揭示了重要的见解。具体而言,对于$8\mathrm{\;g}$柱(图4B),我们最初采用了与$4\mathrm{\;g}$柱相同的直接训练方法。然而,这种方法产生的预测准确率较低,${V}_{1}$和${V}_{2}$的${R}^{2}$值分别仅为0.02和-0.093。这一结果表明,直接训练方法在处理新的色谱柱规格时不够有效。相比之下,迁移学习方法的应用显著提高了模型的预测能力。具体而言,在$8\mathrm{\;g}$色谱柱数据集上,通过迁移学习调整后的模型,${V}_{1}$和${V}_{2}$的${R}^{2}$值分别达到0.759和0.752。同样,我们在25克和40克色谱柱的数据集上也观察到了类似的趋势(图4C和4D)。此外,我们研究了扩展二氯甲烷/甲醇(DCM/MeOH)洗脱液系统的潜力,并在键合柱上进行了额外的实验。我们发现,迁移学习在这两种情况下都提高了性能,${R}^{2}$值从大约0增加到近0.6(图S4)。这一显著改进不仅验证了迁移学习在增强模型预测能力方面的有效性,还突出了其适用于处理来自不同规格色谱柱和洗脱液系统的数据。
Application: Separation probability
应用:分离概率
To quantitatively assess the separation probability $\left( {S}_{p}\right)$ of compounds under specific conditions, we introduced an ${S}_{p}$ formula based on confidence interval. This formula calculates the ${S}_{p}$ based on the quantiles of elution volumes $\left( V\right)$ of two compounds during the chromatographic process. The calculation method for the ${S}_{p}$ involves specific quantile-based measurements. We define the 90th percentile of the ${V}_{2}$ of the compound $\mathbf{A}$ as ${V}_{A2}^{90}$ and the 10th percentile of the ${V}_{1}$ of the compound $\mathbf{B}$ as ${V}_{B1}^{10}$ . Similarly, the 90th percentile of the ${V}_{1}$ of the compound $\mathbf{B}$ is ${V}_{B1}^{90}$ , and the 10th percentile of the ${V}_{2}$ of the compound $\mathbf{A}$ is ${V}_{A2}^{10}$ .
为了定量评估特定条件下化合物的分离概率$\left( {S}_{p}\right)$,我们引入了一个基于置信区间的${S}_{p}$公式。该公式根据色谱过程中两种化合物洗脱体积$\left( V\right)$的分位数来计算${S}_{p}$。${S}_{p}$的计算方法涉及基于特定分位数的测量。我们将化合物$\mathbf{A}$的${V}_{2}$的第90百分位数定义为${V}_{A2}^{90}$,将化合物$\mathbf{B}$的${V}_{1}$的第10百分位数定义为${V}_{B1}^{10}$。同样,化合物$\mathbf{B}$的${V}_{1}$的第90百分位数是${V}_{B1}^{90}$,化合物$\mathbf{A}$的${V}_{2}$的第10百分位数是${V}_{A2}^{10}$。
As depicted in Figure 5A, assuming that compound $\mathbf{A}$ be eluted out first, the ${S}_{p}$ is then derived based on these quantile values:
如图5A所示,假设化合物$\mathbf{A}$先洗脱出来,然后根据这些分位数得出${S}_{p}$:
$$ {S}_{p} = 1 - \frac{\max \left( {0,{V}_{A2}^{90} - {V}_{B1}^{10}}\right) }{{V}_{B1}^{90} - {V}_{A2}^{10}}. $$(Equation 4)
The logic of this formula is based on the overlap of the elution times of the two compounds in chromatography column. If the value of $\left( {{V}_{A2}^{90} - {V}_{B1}^{10}}\right)$ is positive, it suggests that ${V}_{B1}$ could be less than ${V}_{A2}$ , indicating that the separation of the two compounds may not be fully achieved. If the value is negative, it indicates complete separation of the two compounds, with an ${S}_{p}$ close to 1.
该公式的逻辑基于两种化合物在色谱柱中洗脱时间的重叠情况。如果$\left( {{V}_{A2}^{90} - {V}_{B1}^{10}}\right)$的值为正,则表明${V}_{B1}$可能小于${V}_{A2}$,这意味着两种化合物的分离可能未完全实现。如果值为负,则表明两种化合物已完全分离,${S}_{p}$接近1。
To provide a more concrete and visual explanation of ${S}_{p}$ and to demonstrate its practical application in real experiments, we selected a classic chemical reaction, the Claisen reaction, ${}^{27}$ as the experimental subject (Figure 5B). Due to the reversibility of this reaction, both reactants and products coexist in the post-reaction mixture, making the separation of high-purity products essential. Initially, we utilized the predictive model to determine the parameters required for effective separation. In order to facilitate the procedure, pure allylphenyl ester (compound A) and 2-allylphenol (compound B) are combined directly in a 1:1 ratio as an alternative to the reaction mixture. Subsequently, an adequate quantity of the up-sampling solvent was introduced to satisfy the minimum sample volume requirement of the injector. Subsequently, the experiment was initiated at the control terminal, yielding the corresponding experimental results as shown in Figures 5C and 5D. The corresponding ${S}_{p}$ is obtained by quantile calculation, when petroleum ether (PE)/ethyl acetate (EA) $= {20}/1$ , the predicted value of ${S}_{p}$ is 0.51 . It is clear that there is indeed some intersection in the separation process of A and B, which means that they are not completely separate. Also, when PE/EA = 50/1, the predicted value of ${S}_{p}$ is 1.0, there is no intersection in the separation process of A and B, which means that they are completely separated. This validation result demonstrates the practical value of ${S}_{p}$ in guiding the separation of actual products. Using the Claisen reaction as an example, our model accurately predicted outcomes under different experimental conditions. Detailed prediction data can be found in Table S2.
为了更具体直观地解释${S}_{p}$并展示其在实际实验中的应用,我们选择了一个经典化学反应——克莱森反应${}^{27}$作为实验对象(图5B)。由于该反应具有可逆性,反应后混合物中反应物和产物共存,因此分离高纯度产物至关重要。最初,我们利用预测模型确定有效分离所需的参数。为了便于操作,将纯烯丙基苯基酯(化合物A)和2-烯丙基苯酚(化合物B)按1:1的比例直接混合作为反应混合物的替代物。随后,引入适量的上样溶剂以满足进样器的最小样品体积要求。随后,在控制终端启动实验,得到如图5C和5D所示的相应实验结果。通过分位数计算得到相应的${S}_{p}$,当石油醚(PE)/乙酸乙酯(EA)$= {20}/1$时,${S}_{p}$的预测值为0.51。显然,A和B的分离过程中确实存在一些交叉,这意味着它们没有完全分离。同样,当PE/EA = 50/1时,${S}_{p}$的预测值为1.0,A和B的分离过程中没有交叉,这意味着它们已完全分离。这一验证结果证明了${S}_{p}$在指导实际产物分离方面的实用价值。以克莱森反应为例,我们的模型准确预测了不同实验条件下的结果。详细的预测数据可参见表S2。
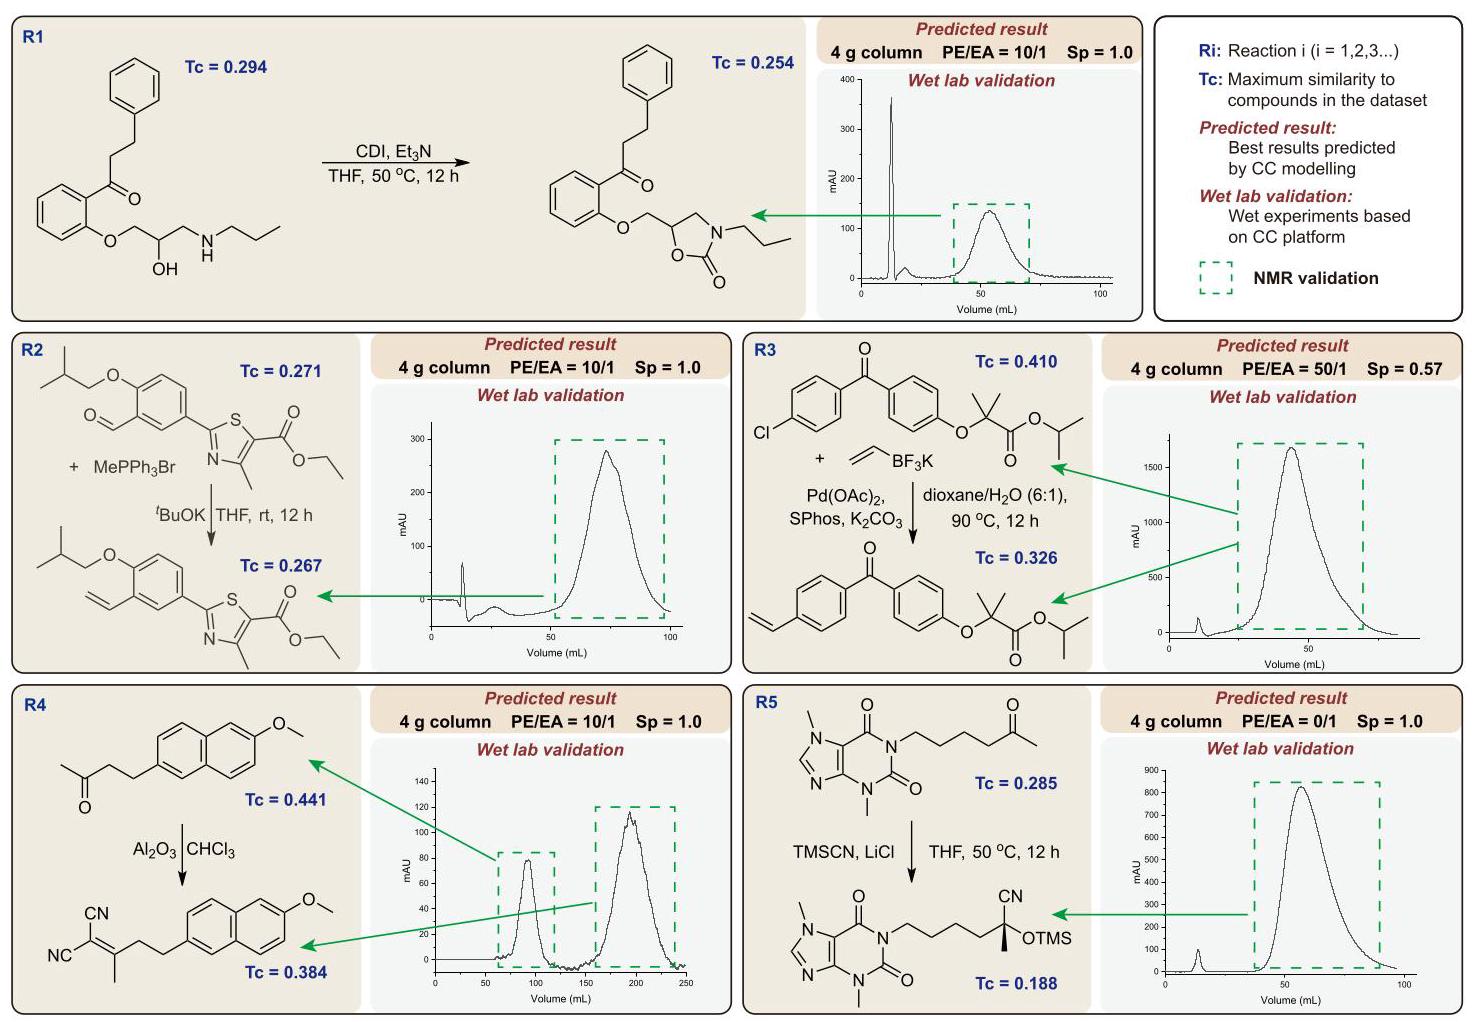
Figure 6. Prediction and validation of ${S}_{p}$ for complex compound reactions
图6. 复杂化合物反应中${S}_{p}$的预测与验证
As previously demonstrated, the model exhibits satisfactory prediction accuracy within the dataset. However, this alone is insufficient to address the complexities of CC comprehensively. A more critical aspect is the model’s ability to predict ${S}_{p}$ values for separating compounds outside the dataset. To evaluate this, we selected several products of classical organic reactions (Figure S5A) for experimental validation. The model demonstrated 90% accuracy in predicting separation outcomes ( ${S}_{p}$ values) across 70 experimental validation points from 10 compound groups, successfully correlating PE/EA solvent ratio effects with experimental results (Figures S5B and S5C). This demonstrates that the ${S}_{p}$ values generated by our CC prediction model provide reliable guidance for compound separation processes.
如前所述,该模型在数据集中表现出令人满意的预测准确性。然而,仅凭这一点不足以全面解决柱色谱法的复杂性。一个更关键的方面是该模型预测数据集中之外的化合物分离的${S}_{p}$值的能力。为了评估这一点,我们选择了几种经典有机反应的产物(图S5A)进行实验验证。该模型在预测来自10个化合物组的70个实验验证点的分离结果(${S}_{p}$值)时表现出90%的准确率,成功地将PE/EA溶剂比效应与实验结果相关联(图S5B和S5C)。这表明我们的柱色谱法预测模型生成的${S}_{p}$值为化合物分离过程提供了可靠的指导。
While the examples based on classic name reactions may appear basic, they effectively establish the model’s feasibility for large-scale application beyond the dataset. To further assess the model’s performance in complex compound reactions, we performed CC separations on mixtures from five distinct reactions under model-predicted optimal conditions (Figure 6). For reactions R1 and R2, where substrates were more polar than their respective products, the products eluted first as anticipated. Subsequent NMR analysis confirmed the high purity of these isolated products. Reaction R3 demonstrated limited separation potential due to negligible polarity differences between substrate and product, which was corroborated by NMR showing inseparable components. In R4, the predicted elution sequence (substrate followed by product) was validated through two distinct UV absorption peaks, with NMR confirming peak assignments. For the highly polar system in R5, exclusive use of pure EA as eluent successfully yielded high-purity product as predicted, with NMR verification. Complete NMR spectra are provided in the appendix in Document S1.
虽然基于经典命名反应的例子可能看起来很基础,但它们有效地确立了该模型在数据集之外大规模应用的可行性。为了进一步评估该模型在复杂化合物反应中的性能,我们在模型预测的最佳条件下对来自五个不同反应的混合物进行了柱色谱分离(图6)。对于反应R1和R2,其中底物比各自的产物极性更大,产物如预期的那样首先洗脱。随后的核磁共振分析证实了这些分离产物的高纯度。反应R3由于底物和产物之间的极性差异可忽略不计,显示出有限的分离潜力,核磁共振显示各组分无法分离证实了这一点。在R4中,预测的洗脱顺序(底物后接产物)通过两个不同的紫外吸收峰得到验证,核磁共振证实了峰归属。对于R5中的高极性体系,仅使用纯EA作为洗脱剂成功地如预测那样得到了高纯度产物,并经核磁共振验证。完整的核磁共振谱图在文件S1的附录中提供。
Moreover, the predictive models obtained through transfer learning (8, 25, and 40 g models, with three sets of experiments each) were further validated to demonstrate their generalization guidance capability. The results (Figures S6-S8) demonstrated that the parameters predicted by these models could effectively optimize the compound separation process under different chromatographic column specifications. Current CC prediction models rely on UV detection, but there are compounds with weak or no UV absorption. To address this, we selected a set of compounds labeled L and M (Figure S9). Compound L has no UV absorption, whereas compound M does. Their SMILES were input into the prediction model to obtain separation conditions, which were then tested on the CC experimental platform. TLC results were clear, showing distinct spots for both compounds. Compound L, without UV absorption, appeared in tube 3, and compound M, with UV absorption, was found in tubes 12 and 13. These results demonstrate that the CC prediction model can predict separation conditions regardless of UV absorption, though there is potential for improving detection methods. The validation results confirm that our model can successfully predict the ${S}_{p}$ of complex mixtures, validating its effectiveness and robustness.
此外,通过迁移学习获得的预测模型(8克、25克和40克模型,每组进行三组实验)经过进一步验证,以证明其泛化指导能力。结果(图S6 - S8)表明,这些模型预测得到的参数能够有效地在不同色谱柱规格下优化化合物分离过程。当前的柱色谱法预测模型依赖于紫外检测,但存在一些具有弱紫外吸收或无紫外吸收的化合物。为了解决这个问题,我们选择了一组标记为L和M的化合物(图S9)。化合物L无紫外吸收,而化合物M有。它们的SMILES输入到预测模型中以获得分离条件,然后在柱色谱实验平台上进行测试。薄层色谱结果清晰,两种化合物都显示出明显的斑点。无紫外吸收的化合物L出现在第3管中,有紫外吸收的化合物M在第12管和第13管中被发现。这些结果表明,柱色谱法预测模型能够预测无论有无紫外吸收的分离条件,尽管在检测方法上仍有改进的空间。验证结果证实我们的模型能够成功预测复杂混合物的${S}_{p}$,验证了其有效性和稳健性。
DISCUSSION
讨论
This study developed ML models tailored for CC to address the challenges of inaccuracy and reproducibility in traditional empirical workflows. An automated chromatography platform enabled standardized data acquisition, while the QGeoGNN algorithm - incorporating molecular 3D conformations, experimental parameters, and domain-specific descriptors - was optimized through transfer learning for diverse column specifications. A novel ${S}_{p}$ metric was established to guide experimental design, with validation confirming the baseline and transfer learning-adapted models effectively predict retention volumes. Critically, the model focuses on predicting retention behavior for known components (e.g., reactants, products, and pre-characterized byproducts) under controlled separation scenarios, offering a mechanism-driven pathway to reduce empirical optimization efforts in deterministic systems.
本研究开发了针对柱色谱的机器学习模型,以应对传统经验方法中存在的准确性和可重复性挑战。一个自动化色谱平台实现了标准化的数据采集,同时通过迁移学习对结合分子三维构象、实验参数和特定领域描述符的QGeoGNN算法进行了优化,以适用于不同的色谱柱规格。建立了一种新颖的${S}_{p}$指标来指导实验设计,验证结果证实基线模型和迁移学习适配模型能够有效预测保留体积。至关重要的是,该模型专注于在可控分离场景下预测已知组分(如反应物、产物和预先表征的副产物)的保留行为,为减少确定性系统中的经验优化工作提供了一条由机制驱动的途径。
The model’s scope and validation logic align with its theoretical framework. While chromatographic separation inherently depends on structural information-limiting its utility for unknown impurities - the approach demonstrates universal applicability to any characterized compounds. Challenges in separating unidentified components stem from the technology’s intrinsic constraints, not the model itself. For systems with speculatively identifiable species, the framework provides actionable elution prediction schemes, as validated in raw material-product separation cases.
该模型的范围和验证逻辑与其理论框架一致。虽然色谱分离本质上依赖于结构信息,这限制了其对未知杂质的适用性,但该方法对任何已表征的化合物都具有普遍适用性。分离未鉴定组分的挑战源于该技术的内在限制,而非模型本身。对于具有推测可鉴定物种的系统,该框架提供了可操作的洗脱预测方案,如在原料 - 产物分离案例中得到验证。
Nevertheless, limitations persist. The dataset’s compound diversity remains constrained, and the current eluent system (PE/ EA) prioritizes less polar compounds, though transfer learning extends applicability to DCM/MeOH. Other systems (e.g., MeOH/TCM) require further data integration. Additionally, ${S}_{p}$ -defined based on empirical chromatography principles-does not yet incorporate factors such as column temperature or stationary phase effects. Future work will explore these variables and expand community-driven validation through open-source model iterations to enhance adaptability across broader chemical scenarios.
然而,局限性仍然存在。数据集的化合物多样性仍然受限,当前的洗脱液系统(PE/EA)优先考虑极性较小的化合物,尽管迁移学习将适用性扩展到了DCM/MeOH。其他系统(如MeOH/TCM)需要进一步的数据整合。此外,基于经验色谱原理定义的${S}_{p}$尚未纳入柱温或固定相效应等因素。未来的工作将探索这些变量,并通过开源模型迭代扩大社区驱动的验证,以增强在更广泛化学场景中的适应性。
METHODS
方法
Construction and control of automation equipment
自动化设备的构建与控制
To address the challenges encountered in CC experiments, we have designed and assembled an advanced automated apparatus specifically for the collection of CC data. The construction and operational principle of the device are depicted in Figure 1B (a photograph of the apparatus is provided in Figure S1). The system incorporates two medium-pressure pumps (manufactured by Beijing Qingbohua Technology), each delivering different pure solvents (PE and EA) with a flow accuracy of ${0.01}\mathrm{{mL}}/\mathrm{{min}}$ and a maximum flow capacity of ${200}\mathrm{\;{mL}}/\mathrm{{min}}$ . To facilitate the mixing of eluents in multiple proportions, the outlets of these pumps are connected to a mixer, ensuring that the mobile phase can be thoroughly mixed in predetermined ratios before the elution step. The centerpiece of the system is an autosampler, which stores and automatically transports the prepared sample solutions, activating automatically upon receiving programmed instructions. Real-time signals during the separation process are captured and recorded by an ultraviolet detector operating at a wavelength of 254 nm. For real-time response and data synchronization, the pumps, detector, and autosampler are all connected via RS232 serial ports for real-time communication. Control over the entire automated platform is executed through a Python program, which manages sample positioning, flow rate adjustments, eluent proportioning, and the collection, conversion, analysis, and archiving of real-time detection signals. A video of the experiment is provided in the supplemental information (Data S2).
为应对CC实验中遇到的挑战,我们设计并组装了一种先进的自动化装置,专门用于收集CC数据。该装置的构建和工作原理如图1B所示(图S1提供了该装置的照片)。该系统包含两个中压泵(由北京清波华科技制造),每个泵输送不同的纯溶剂(PE和EA),流量精度为${0.01}\mathrm{{mL}}/\mathrm{{min}}$,最大流量为${200}\mathrm{\;{mL}}/\mathrm{{min}}$。为便于以多种比例混合洗脱液,这些泵的出口连接到一个混合器,确保流动相在洗脱步骤之前能够以预定比例充分混合。系统的核心是一个自动进样器,它存储并自动输送制备好的样品溶液,在接收到编程指令后自动启动。分离过程中的实时信号由一个工作在254nm波长的紫外检测器捕获和记录。为实现实时响应和数据同步,泵、检测器和自动进样器均通过RS232串行端口连接以进行实时通信。整个自动化平台由一个Python程序控制,该程序管理样品定位、流速调整、洗脱液配比以及实时检测信号的采集、转换、分析和存档。补充信息(数据S2)中提供了实验视频。
Construction of the CC dataset
CC数据集的构建
In this study, a CC dataset comprising separation volume data for 218 compounds was collected using an automated experimental platform. The dataset encompasses 6,365 records of separation volumes, along with experimental conditions and column information. The dataset utilized for pre-training the basic model consists of 4,684 entries of 218 compounds, employing columns of $4\mathrm{\;g}$ specifications and includes comparisons of two different flow rates. The datasets for transfer learning correspond to different column specifications, with 582 data points of 90 compounds using 8 g columns, 568 data points of 80 compounds using 25 g columns, and 531 data points of 81 compounds using ${40}\mathrm{\;g}$ columns. Notably, the compounds for different columns are all within the scope of the 218 compounds, with detailed distributions available in the supplemental methods.
在本研究中,使用自动化实验平台收集了包含218种化合物分离体积数据的CC数据集。该数据集包含6365条分离体积记录,以及实验条件和色谱柱信息。用于预训练基本模型的数据集由218种化合物的4684条记录组成,采用$4\mathrm{\;g}$规格的色谱柱,并包括两种不同流速的比较。迁移学习的数据集对应不同的色谱柱规格,90种化合物的582个数据点使用8g色谱柱,80种化合物的568个数据点使用25g色谱柱,81种化合物的531个数据点使用${40}\mathrm{\;g}$色谱柱。值得注意的是,不同色谱柱的化合物都在218种化合物的范围内,补充方法中有详细的分布情况。
Flow rates were set based on the manufacturer’s recommendations: ${10}\mathrm{\;{mL}}/\mathrm{{min}}$ for a $4\mathrm{\;g}$ column, ${10}\mathrm{\;{mL}}/\mathrm{{min}}$ for an $8\mathrm{\;g}$ column consisting of two $4\mathrm{\;g}$ columns connected in series, ${15}\mathrm{\;{mL}}/\mathrm{{min}}$ for a 25 g column, and ${30}\mathrm{\;{mL}}/\mathrm{{min}}$ for a ${40}\mathrm{\;g}$ column. These settings were found to be reasonable and efficient during pre-tests, resulting in high-quality data collection. The photos of the chromatographic columns are also displayed in Figure S3. It took 6 months to collect the data, using approximately 600 L of PE, 180 L of EA, and 20 L of DCM). The DCM is utilized to load samples and clean the injection syringe.
流速根据制造商的建议设置:${10}\mathrm{\;{mL}}/\mathrm{{min}}$用于$4\mathrm{\;g}$色谱柱,${10}\mathrm{\;{mL}}/\mathrm{{min}}$用于由两个串联的$4\mathrm{\;g}$色谱柱组成的$8\mathrm{\;g}$色谱柱,${15}\mathrm{\;{mL}}/\mathrm{{min}}$用于25g色谱柱,${30}\mathrm{\;{mL}}/\mathrm{{min}}$用于${40}\mathrm{\;g}$色谱柱。在预测试中发现这些设置是合理且有效的,从而实现了高质量的数据收集。色谱柱的照片也显示在图S3中。收集数据耗时6个月,使用了约600L的PE、180L的EA和20L的DCM)。DCM用于加载样品和清洁进样注射器。
All data indices are compiled in a comma-separated values (CSV) spreadsheet, where compounds are indexed by their Chemical Abstracts Service (CAS) numbers, and column specifications are differentiated in the column specification field. Recorded variables include flow rate, eluent ratio, compound purity, compound density, sample loading mass/volume, solvent volume for sample loading, with the “ending time” denoting the name of the UV original data. These identifiers are used to index corresponding data for subsequent analysis. Upon analysis completion, two columns, ${t}_{1}$ and ${t}_{2}$ , are generated, representing the start and end times of separation, respectively. A value of -1 for ${t}_{1}$ and ${t}_{2}$ indicates invalid data. The SMILES descriptors for compounds are generated using a Python script that converts molecular names into SMILES notation.
所有数据索引都汇编在一个逗号分隔值(CSV)电子表格中,其中化合物按其化学文摘社(CAS)编号索引,色谱柱规格在色谱柱规格字段中区分。记录的变量包括流速、洗脱液比例、化合物纯度、化合物密度、样品加载质量/体积、样品加载的溶剂量,“结束时间”表示紫外原始数据的名称。这些标识符用于索引相应的数据以进行后续分析。分析完成后,生成两列,${t}_{1}$和${t}_{2}$,分别代表分离的开始和结束时间。${t}_{1}$和${t}_{2}$的值为-1表示无效数据。化合物的SMILES描述符使用Python脚本生成,该脚本将分子名称转换为SMILES表示法。
The graph representation for molecules
分子的图形表示
In this study, molecular representation was achieved by constructing two graphs, graph G and graph H, as illustrated in Figure 2D. Graphs are frequently employed in data science to depict unstructured data such as social networks, chemical molecules, and transportation networks. A typical graph consists of multiple nodes and edges that represent the connection relationships between them. ${}^{14}$ As shown in Figure 2E; graph G represents the planar structure of a chemical molecule, with nodes corresponding to atoms and edges representing chemical bonds. Each node in graph G encompasses nine attributes of the corresponding atom, including atomic number, chiral tag, degree, explicit valence, formal charge, hybridization, implicit valence, aromaticity, and the number of connected hydrogen atoms. The features of each edge in graph G include three properties of the bond and four experimental condition attributes; the bond properties comprise bond direction, bond type, and whether it is part of a ring, while the four experimental condition attributes include eluent ratio, sample mass, type of sample solvent, and mass of sample solvent.
在本研究中,通过构建两个图,即图G和图H来实现分子表示,如图2D所示。图在数据科学中经常用于描绘非结构化数据,如社交网络、化学分子和交通网络。一个典型的图由多个节点和边组成,这些节点和边表示它们之间的连接关系。${}^{14}$ 如图2E所示;图G表示化学分子的平面结构,节点对应于原子,边表示化学键。图G中的每个节点包含相应原子的九个属性,包括原子序数、手性标签、度数、显式化合价、形式电荷、杂化、隐式化合价、芳香性和连接氢原子的数量。图G中每条边的特征包括键的三个属性和四个实验条件属性;键的属性包括键的方向、键的类型以及它是否是环的一部分,而四个实验条件属性包括洗脱液比例、样品质量、样品溶剂类型和样品溶剂质量。
Graph H encodes the quantum-geometric relationships by representing the 3D molecular conformation. The 3D conformation generation protocol is as follows: the process begins with RDKit’s ETKDGv3 algorithm, which performs stochastic conformer sampling to generate an initial ensemble of molecular conformations. Subsequently, these sampled conformers undergo molecular mechanics optimization using the MMFF94 force field, incorporating default partial charge assignments to refine their energy profiles. Finally, the lowest-energy conformer from the optimized set is systematically selected and utilized as the geometric input for the QGeoGNN framework, ensuring energy-minimized and physically plausible molecular representations for downstream computations. In this graph, nodes represent bond vectors and edges encode angular relationships between bonds. Each node in graph $H$ contains the length of the corresponding bond, while edges feature 17 geometric-chemical descriptors: the bond angle complemented by 16 quantum chemically relevant features including MolWt, HBDs, hydrogen bond acceptors (HBAs), octanol/water partition coefficient (LogP), TPSA, and 11 Mordred-calculated descriptors (Table S3). The core mechanism for integrating global molecular features is detailed in the supplemental methods. These descriptors were selected based on Spearman correlation analysis with separation time measurements.
图H通过表示3D分子构象来编码量子几何关系。3D构象生成协议如下:该过程从RDKit的ETKDGv3算法开始,该算法执行随机构象采样以生成分子构象的初始集合。随后,这些采样的构象使用MMFF94力场进行分子力学优化,并结合默认的部分电荷分配来优化其能量分布。最后,从优化后的集合中系统地选择能量最低的构象,并将其用作QGeoGNN框架的几何输入,以确保为下游计算提供能量最小化且物理上合理的分子表示。在这个图中,节点表示键向量,边编码键之间的角度关系。图$H$ 中的每个节点包含相应键的长度,而边具有17个几何化学描述符:键角辅以16个与量子化学相关的特征,包括分子量(MolWt)、氢键供体(HBDs)、氢键受体(HBAs)、辛醇/水分配系数(LogP)、拓扑极性表面积(TPSA)和11个由Mordred计算的描述符(表S3)。补充方法中详细介绍了整合全局分子特征的核心机制。这些描述符是基于与分离时间测量的斯皮尔曼相关性分析选择的。
Strategies for transfer learning
迁移学习策略
To elucidate the generality and adaptability of our model across various chemical datasets, the current research adopts a strategy of transfer learning. In the regime of transfer learning, the model is primed with weights acquired from antecedent training endeavors. This approach is eminently suited for contexts with constrained data availability or inherent similarities across tasks, thereby augmenting the model’s proficiency in assimilating data from novel domains. Training of the model engaged the mean-squared error (MSE) as the criterion for loss, appraising the divergence between predicted outcomes and actual observations. A learning rate scheduler (StepLR) was employed to dynamically modulate the learning rate, enhancing the training protocol, with the ultimate learning rate established at 0.0001 . Through relentless performance evaluations on the validation dataset, the generalization capacity of the model was meticulously monitored, culminating in a definitive performance appraisal on the test dataset to validate the model’s effectiveness and precision.
为了阐明我们的模型在各种化学数据集上的通用性和适应性,当前的研究采用了迁移学习策略。在迁移学习机制中,模型用从先前训练中获得的权重进行初始化。这种方法非常适合数据可用性受限或任务之间存在内在相似性的情况,从而提高模型从新领域吸收数据的能力。模型训练采用均方误差(MSE)作为损失标准,评估预测结果与实际观测值之间的差异。使用学习率调度器(StepLR)动态调整学习率,改进训练方案,最终学习率设定为0.0001。通过在验证数据集上进行持续的性能评估,精心监测模型的泛化能力,最终在测试数据集上进行最终性能评估,以验证模型的有效性和精度。
Experimental verification
实验验证
In this study, several similarity thresholds are utilized to differentiate the similarity level including 65%, 55%, 45%, 35%, 25%, and 15%. Therefore, all data are categorized into six groups where the molecules in each group as the testing dataset have at least one similar molecule in the training dataset above a specific similarity (tanimoto similarity) threshold. Our objective was to assess the impact of training set size and data noise ratio on the performance of ML models. The noise follows a uniform distribution and is proportionally scaled to the original data. To systematically investigate the effects, we varied the proportions of the training set and the noise ratios. The training set proportions were set at 0.1, 0.2, 0.3, 0.4, 0.5, 0.6 , and 0.7 , while the noise ratios were adjusted to 0%, 10%, 20%, 30%, 40%, and 50%. Through this approach, we explored the robustness and generalization capabilities of the model when faced with varying degrees of data noise and different magnitudes of training data. Data preprocessing, including cleaning, normalization, and feature selection, was undertaken to ensure data quality. The dataset was partitioned according to the specified proportions of the training set to evaluate the influence of different volumes of training data on model performance. In each experiment, a certain proportion of the data was reserved as a test set to assess the model’s generalization ability.
在本研究中,使用了几个相似性阈值来区分相似性水平,包括65%、55%、45%、35%、25%和15%。因此,所有数据被分为六组,其中每组中的分子作为测试数据集,在训练数据集中至少有一个相似分子高于特定的相似性(塔尼莫托相似性)阈值。我们的目标是评估训练集大小和数据噪声率对机器学习模型性能的影响。噪声遵循均匀分布,并按比例缩放到原始数据。为了系统地研究这些影响,我们改变了训练集的比例和噪声率。训练集比例设置为0.1、0.2、0.3、0.4、0.5、0.6和0.7,而噪声率调整为0%、10%、20%、30%、40%和50%。通过这种方法,我们探索了模型在面对不同程度的数据噪声和不同规模的训练数据时的鲁棒性和泛化能力。进行了数据预处理,包括清洗、归一化和特征选择,以确保数据质量。根据训练集的指定比例对数据集进行划分,以评估不同数量的训练数据对模型性能的影响。在每个实验中,保留一定比例的数据作为测试集,以评估模型的泛化能力。
Derivation of chromatographic ${S}_{p}$
色谱${S}_{p}$的推导
In this work, we have defined a measurement method termed as chromatographic ${S}_{p}$ to quantify the likelihood of a ML model correctly separating the mixture of compounds under specific experimental conditions. This section elaborates on the definition and derivation of chromatographic ${S}_{p}$ . Utilizing the proposed QGeoGNN, we can ascertain the range of separated volume for the compounds. The definition of ${S}_{p}$ is grounded on a straightforward principle: regions within the numerical range overlap are deemed inseparable, whereas others are considered separable. Thus, ${S}_{p}$ can be articulated as Equation 4. This represents one specific scenario and does not encompass all computational approaches. Furthermore, the framework extends beyond binary separations to multicomponent systems.
在本研究中,我们定义了一种称为色谱${S}_{p}$的测量方法,以量化ML模型在特定实验条件下正确分离化合物混合物的可能性。本节详细阐述色谱${S}_{p}$的定义和推导。利用所提出的QGeoGNN,我们可以确定化合物的分离体积范围。${S}_{p}$的定义基于一个简单的原则:数值范围内重叠的区域被视为不可分离,而其他区域则被视为可分离。因此,${S}_{p}$可以表示为公式4。这代表了一种特定情况,并不涵盖所有计算方法。此外,该框架不仅适用于二元分离,还适用于多组分系统。
For two-component separation, the probability is defined as the following:
对于两组分分离,概率定义如下:
Experimental settings and parameters
实验设置和参数
In the QGeoGNN utilized in this work, the number of GINConv is 5, the graph pooling strategy is the summation, the embedding dimension of the node and edge representation is 128 , and the batch size is 2,048. The training epoch is 1,500, and the validate loss is adapted for early stopping. For pre-train prediction, the prediction models are established for $4\mathrm{\;g}$ columns. The optimizer is Adam, and the learning rate is 0.001 . The subdataset is randomly divided into 80/10/10 to obtain the training, validating, and testing dataset. For comparison, the LGB, ANN, and GNN are also employed to train a predictive model. The input of LGB and ANN is composed of the 167-dimensional MACCS keys that are utilized to represent the molecular structure, the 16-dimensional molecular descriptors that are the same as those
在本工作中使用的QGeoGNN中,GINConv的数量为5,图池化策略为求和,节点和边表示的嵌入维度为128,批大小为2048。训练轮数为1500,并采用验证损失进行早期停止。对于预训练预测,针对$4\mathrm{\;g}$列建立预测模型。优化器为Adam,学习率为0.001。子数据集随机划分为80/10/10以获得训练、验证和测试数据集。为了进行比较,还采用LGB、ANN和GNN来训练预测模型。LGB和ANN的输入由用于表示分子结构的167维MACCS键和与那些相同的16维分子描述符组成
$$ {P}_{i, j} = \left\{ \begin{array}{ll} {1.0} & \text{ if }{V}_{i}^{{10}\% } - {V}_{i}^{{90}\% } > 0 \\ 1 - \frac{\max \left( {0,\min \left( {{V}_{i}^{{90}\% },{V}_{i}^{{90}\% }}\right) - \max \left( {{V}_{i}^{{10}\% },{V}_{i}^{{10}\% }}\right) }\right) }{\max \left( {{V}_{i}^{{90}\% },{V}_{i}^{{90}\% }}\right) - \min \left( {{V}_{i}^{{10}\% },{V}_{i}^{{10}\% }}\right) } & \text{ otherwise } \end{array}\right. $$(Equation 5)
(方程5)
where ${V}_{i}^{{10}\% },{V}_{i}^{{50}\% },{V}_{i}^{{90}\% }$ represent the ${V}_{1}^{{10}\% },{V}_{1}^{{50}\% }$ , and ${V}_{1}^{{90}\% }$ values of compound $i$ .
其中${V}_{i}^{{10}\% },{V}_{i}^{{50}\% },{V}_{i}^{{90}\% }$表示化合物$i$的${V}_{1}^{{10}\% },{V}_{1}^{{50}\% }$和${V}_{1}^{{90}\% }$值。
The elution order is determined by ${V}_{i}^{{50}\% } \leq {V}_{i}^{{50}\% }$ , with the formula implicitly incorporating the sorting process.
洗脱顺序由${V}_{i}^{{50}\% } \leq {V}_{i}^{{50}\% }$确定,该公式隐含地包含了排序过程。
Complete separation: occurs when ${V}_{j}^{{10}\% } > {V}_{i}^{{90}\% }$ .
完全分离:当${V}_{j}^{{10}\% } > {V}_{i}^{{90}\% }$时发生。
Overlap scenario:
重叠情况:
Numerator: overlap length (max(0, overlapend - overlapstart)).
分子:重叠长度(max(0,重叠结束 - 重叠开始))。
Denominator: total span of both elution windows.
分母:两个洗脱窗口的总跨度。
Separation degree: ${S}_{p} = 1 - \frac{\text{ overlap }}{\text{ total span }}$ .
分离度:${S}_{p} = 1 - \frac{\text{ overlap }}{\text{ total span }}$。
For multicomponent systems $\left( {n \geq 3}\right)$ , the ${S}_{p}$ generalizes to the following:
对于多组分系统$\left( {n \geq 3}\right)$,${S}_{p}$概括如下:
$$ {S}_{p} = \mathop{\prod }\limits_{{1 \leq i < j \leq n}}{P}_{i, j} $$(Equation 6)
(方程6)
where $n$ is the total number of compounds.
其中$n$是化合物的总数。
The product iterates over all unique pairwise combinations (e. g., ${S}_{p} = {P}_{1,2} \times {P}_{1,3} \times {P}_{2,3}$ for three compounds).
该乘积遍历所有唯一的成对组合(例如,对于三种化合物为${S}_{p} = {P}_{1,2} \times {P}_{1,3} \times {P}_{2,3}$)。
Practical implications:
实际意义:
The combined formulas enable prediction of ${S}_{p}$ under varying eluent ratios (fixed column specifications and flow rate).
这些组合公式能够在不同洗脱剂比例下(固定柱规格和流速)预测${S}_{p}$。
For mixtures with $n \geq 3$ , secondary analysis may identify compounds with ${P}_{ij} = 1$ against others, allowing prioritized isolation under optimized conditions before separating remaining components.
对于含有$n \geq 3$的混合物,二次分析可以识别出相对于其他物质具有${P}_{ij} = 1$的化合物,从而在优化条件下优先分离,然后再分离其余成分。
Hence, the defined chromatographic ${S}_{p}$ spans from 0 to 1 . A higher ${S}_{p}$ value indicates an expanded region of separability, in other words, an increased likelihood that the mixture of compounds is predicted to be separable by the QGeoGNN. utilized in QGeoGNN, and 9-dimensional experimental parameter features. For LGB, the maximum depth is 5, the learning rate is 0.007 , the number of leaves is 25 , and the number of estimators is 1,000. For ANN, there are 3 hidden layers with 50 hidden neurons in each hidden layer. The activation function is leaky ReLu and the optimizer is Adam with a learning rate of 0.001 . The training epoch is 10,000 and early stopping is adopted. The construction of GNN is similar to QGeoGNN, while it only has graph G, and the loss function is of the MSE between the predicted and observed value. The experimental parameter features are incorporated into the edge features for GNN. For transfer learning, the individual secondary datasets are split into ${80}/{10}/{10}$ to train a transfer model.
因此,定义的色谱${S}_{p}$范围为0到1。${S}_{p}$值越高,可分离区域越大,也就是说,化合物混合物被QGeoGNN预测为可分离的可能性增加。在QGeoGNN中使用,以及9维实验参数特征。对于LGB,最大深度为5,学习率为0.007,叶子数为25,估计器数量为1000。对于ANN,有3个隐藏层,每个隐藏层有50个隐藏神经元。激活函数是leaky ReLu,优化器是Adam,学习率为0.001。训练轮数为10000,并采用早期停止。GNN的构建与QGeoGNN类似,只是它只有图G,损失函数是预测值和观测值之间的MSE。实验参数特征被纳入GNN的边特征中。对于迁移学习,将各个二次数据集拆分为${80}/{10}/{10}$来训练迁移模型。
RESOURCE AVAILABILITY
资源可用性
Lead contact
主要联系人
Requests for further information and resources should be directed to and will be fulfilled by the lead contact, Fanyang Mo ().
如需进一步信息和资源,请联系主要联系人范阳·莫(),相关请求将由其处理。
Materials availability
材料可用性
This study did not generate new unique reagents.
本研究未产生新的独特试剂。
Data and code availability
数据和代码可用性
The CC dataset generated in this study has been deposited in a GitHub repository: https://github.com/danielwu0415/column_chromatography_prediction/ tree/main/dataset. Source data are provided with this paper. All original code can be found in a GitHub repository: https://github.com/danielwu0415/ column_chromatography_prediction/tree/main/application.
本研究中生成的CC数据集已存于GitHub仓库:https://github.com/danielwu0415/column_chromatography_prediction/ tree/main/dataset。本文提供了源数据。所有原始代码可在GitHub仓库中找到:https://github.com/danielwu0415/ column_chromatography_prediction/tree/main/application。
ACKNOWLEDGMENTS
致谢
This work is supported by the Natural Science Foundation of China (grant nos. 22071004, 21933001, and 22150013, received by F.M.). F.M. thanks the
本工作得到了中国国家自然科学基金(F.M.获得的资助编号为22071004、21933001和22150013)的支持。F.M.感谢
Peking University Shenzhen Graduate School and the Shenzhen Government for the start-up funding support. We thank the High-Performance Computing Platform of Peking University for ML model training. We also extend our gratitude to all the reviewers for their insightful and constructive feedback, which has greatly contributed to the enhancement of our work.
北京大学深圳研究生院和深圳市政府提供的启动资金支持。我们感谢北京大学高性能计算平台为机器学习模型训练提供支持。我们还要感谢所有审稿人提出的深刻且有建设性的反馈,这些反馈对提升我们的工作有很大帮助。
AUTHOR CONTRIBUTIONS
作者贡献
W.W. and F.M. established the automated platform. W.W. conducted experiments and collected the CC dataset. W.W. and H.X. analyzed the data. W.W. and H.X. performed chemoinformatic and ML studies. Yang Xu, Q.Z., and Yan Xu conducted organic reactions. P.L. conducted the ${}^{1}\mathrm{H}$ NMR analysis. Y.C. contributed to algorithmic discussions and provided feedback on framework design. W.W. and F.M. wrote the manuscript with the discussion feedback from all authors. F.M. conceived the idea and designed the overall research. F.M. supervised the whole project.
W.W.和F.M.建立了自动化平台。W.W.进行了实验并收集了CC数据集。W.W.和H.X.分析了数据。W.W.和H.X.进行了化学信息学和机器学习研究。杨旭、Q.Z.和严旭进行了有机反应。P.L.进行了${}^{1}\mathrm{H}$核磁共振分析。Y.C.参与了算法讨论并对框架设计提供了反馈。W.W.和F.M.根据所有作者的讨论反馈撰写了手稿。F.M.提出了想法并设计了整体研究。F.M.监督了整个项目。
DECLARATION OF INTERESTS
利益声明
F.M., W.W., H.X., and D.Z. are inventors on a patent application (CN 202410282149.7) submitted by Peking University that covers an ML method for CC conditions prediction.
F.M.、W.W.、H.X. 和 D.Z. 是北京大学提交的一项专利申请(CN 202410282149.7)的发明人,该专利申请涵盖了一种用于CC条件预测的机器学习方法。
SUPPLEMENTAL INFORMATION
补充信息
Supplemental information can be found online at https://doi.org/10.1016/j.chempr.2025.102598.
补充信息可在网上获取,网址为https://doi.org/10.1016/j.chempr.2025.102598。
Received: October 31, 2024
收到日期:2024年10月31日
Revised: March 24, 2025
修订日期:2025年3月24日
Accepted: April 28, 2025
接受日期:2025年4月28日
Published: May 29, 2025
发表日期:2025年5月29日
REFERENCES
参考文献
Still, W.C., Kahn, M., and Mitra, A. (1978). Rapid chromatographic technique for preparative separations with moderate resolution. J. Org. Chem. 43, 2923-2925.
Stocker, S., Csányi, G., Reuter, K., and Margraf, J.T. (2020). Machine learning in chemical reaction space. Nat. Commun. 11, 5505. https:// doi.org/10.1038/s41467-020-19267-x.
Keith, J.A., Vassilev-Galindo, V., Cheng, B., Chmiela, S., Gastegger, M., Müller, K.R., and Tkatchenko, A. (2021). Combining machine learning and computational chemistry for predictive insights into chemical systems. Chem. Rev. 121, 9816-9872. https://doi.org/10.1021/acs.chem-rev.1c00107.
Meuwly, M. (2021). Machine learning for chemical reactions. Chem. Rev. 121, 10218-10239. https://doi.org/10.1021/acs.chemrev.1c00033.
Jumper, J., Evans, R., Pritzel, A., Green, T., Figurnov, M., Ronneberger, O., Tunyasuvunakool, K., Bates, R., Zídek, A., Potapenko, A., et al. (2021). Highly accurate protein structure prediction with alphafold. Nature 596, 583-589. https://doi.org/10.1038/s41586-021-03819-2.
Hudson, D., Fernandes, R.A., Basham, M., Ogg, G., and Koohy, H. (2023). Can we predict t cell specificity with digital biology and machine learning? Nat. Rev. Immunol. 23, 511-521. https://doi.org/10.1038/s41577-023- 00835-3.
Kaissis, G.A., Makowski, M.R., Rückert, D., and Braren, R.F. (2020). Secure, privacy-preserving and federated machine learning in medical imaging. Nat. Mach. Intell. 2, 305-311.
Varoquaux, G., and Cheplygina, V. (2022). Machine learning for medical imaging: methodological failures and recommendations for the future. npj Digit. Med. 5, 48. https://doi.org/10.1038/s41746-022-00592-y.
Manzano, J.S., Hou, W., Zalesskiy, S.S., Frei, P., Wang, H., Kitson, P.J., and Cronin, L. (2022). An autonomous portable platform for universal chemical synthesis. Nat. Chem. 14, 1311-1318. https://doi.org/10.1038/ s41557-022-01016-w.
Zhu, Q., Huang, Y., Zhou, D., Zhao, L., Guo, L., Yang, R., Sun, Z., Luo, M., Zhang, F., Xiao, H., et al. (2023). Automated synthesis of oxygen-producing catalysts from martian meteorites by a robotic ai chemist. Natl. Synth. 3, 319-328.
Li, S.W., Xu, L.C., Zhang, C., Zhang, S.Q., and Hong, X. (2023). Reaction performance prediction with an extrapolative and interpretable graph model based on chemical knowledge. Nat. Commun. 14, 3569. https:// doi.org/10.1038/s41467-023-39283-x.
Xu, H., Lin, J., Liu, Q., Chen, Y., Zhang, J., Yang, Y., Young, M.C., Xu, Y., Zhang, D., and Mo, F. (2022). High-throughput discovery of chemical structure-polarity relationships combining automation and machine-learning techniques. Chem 8, 3202-3214.
Xu, H., Zhang, D., and Mo, F. (2022). High-throughput automated platform for thin layer chromatography analysis. Star Protoc. 3, 101893. https://doi.org/10.1016/j.xpro.2022.101893.
Xu, H., Lin, J., Zhang, D., and Mo, F. (2023). Retention time prediction for chromatographic enantioseparation by quantile geometry-enhanced graph neural network. Nat. Commun. 14, 3095. https://doi.org/10.1038/ s41467-023-38853-3.
Filipa de Almeida, A., and Rodrigues, T. (2023). Machine Learning for the Optimization of Chemical Reaction Conditions (Wiley Online Library).
Burés, J., and Larrosa, I. (2023). Organic reaction mechanism classification using machine learning. Nature 613, 689-695. https://doi.org/10.1038/s41586-022-05639-4.
Zhang, W., Quan, H., and Srinivasan, D. (2018). An improved quantile regression neural network for probabilistic load forecasting. IEEE Trans. Smart Grid 10, 4425-4434.
Xu, K., Hu, W., Leskovec, J., and Jegelka, S. (2019). How Powerful Are Graph Neural Networks?. Preprint at arXiv. https://doi.org/10.48550/arXiv.1810.00826.
Yang, L., Hanneke, S., and Carbonell, J. (2013). A theory of transfer learning with applications to active learning. Mach. Learn. 90, 161-189.
Zhuang, F., Qi, Z., Duan, K., Xi, D., Zhu, Y., Zhu, H., Xiong, H., and He, Q. (2020). A comprehensive survey on transfer learning. Proc. IEEE 109, 43-76.
Niu, S., Liu, Y., Wang, J., and Song, H. (2020). A decade survey of transfer learning (2010-2020). IEEE Trans. Artif. Intell. 1, 151-166.
Rice, L., Wong, E., and Kolter, J.Z. (2020). Overfitting in Adversarially Robust Deep Learning. Preprint at arXiv. https://doi.org/10.48550/arXiv.2002.11569.
Salman, S., and Liu, X. (2019). Overfitting Mechanism and Avoidance in Deep Neural Networks. Preprint at arXiv. https://doi.org/10.48550/arXiv.1901.06566.
Park, M.J., and Sacchi, M.D. (2020). Automatic velocity analysis using convolutional neural network and transfer learning. Geophysics 85, V33-V43.
Huang, Y., Liang, Y., and Huang, L. (2022). Provable generalization of overparameterized meta-learning trained with sgd. NeurIPS 35, 16563- 16576.
Shao, S., McAleer, S., Yan, R., and Baldi, P. (2018). Highly accurate machine fault diagnosis using deep transfer learning. IEEE Trans. Ind. Inform. 15, 2446-2455.
Martín Castro, A.M. (2004). Claisen rearrangement over the past nine decades. Chem. Rev. 104, 2939-3002. https://doi.org/10.1021/cr020703u.