Explicit relation between thin film chromatography and column chromatography conditions from statistics and machine learning
英文原文与中文译文逐段对照 · English original with Chinese translation
Hao Xu ${}^{1,2,3}$ , Wenchao Wu ${}^{1,4}$ , Yuntian Chen ${}^{3,5}$ , Dongxiao Zhang B ${}^{5}$ & Fanyang Mo ${}^{1,4,6,7}$
徐浩${}^{1,2,3}$ ,吴文超${}^{1,4}$ ,陈云天${}^{3,5}$ ,张东晓B${}^{5}$ 与莫凡洋${}^{1,4,6,7}$
In chemistry, empirical paradigms prevail, especially within the realm of chromatography, where the selection of separation conditions frequently relies on the chemist’s experience. However, the underlying rationale for such experiential knowledge has not been established or analysed. This study explicitly elucidates how chemists use thin-layer chromatography (TLC) to determine column chromatography (CC) conditions, employing statistical analysis and machine learning techniques. An experimental dataset of the CC is generated from the automatic platform developed in this study. On this basis, an “artificial intelligence (AI) experience” is generated through a knowledge discovery framework, where the relationship between the retardation factor $\left( {\mathrm{R}}_{\mathrm{F}}\right)$ value from TLC and retention volume from CC is unveiled in the form of explicit equations. These equations demonstrate satisfactory accuracy and generalizability, providing a scientific basis for the selection of the experimental conditions, and contributing to a better understanding of chromatography.
在化学领域,经验范式盛行,尤其是在色谱领域,分离条件的选择往往依赖于化学家的经验。然而,这种经验知识的潜在原理尚未得到确立或分析。本研究通过统计分析和机器学习技术,明确阐明了化学家如何使用薄层色谱(TLC)来确定柱色谱(CC)条件。通过本研究开发的自动平台生成了CC的实验数据集。在此基础上,通过知识发现框架生成了一种“人工智能(AI)经验”,其中以明确的方程形式揭示了TLC的阻滞因子$\left( {\mathrm{R}}_{\mathrm{F}}\right)$值与CC的保留体积之间的关系。这些方程显示出令人满意的准确性和通用性,为实验条件的选择提供了科学依据,并有助于更好地理解色谱法。
Received: 29 May 2024
收到日期:2024年5月29日
Accepted: 9 January 2025
接受日期:2025年1月9日
Published online: 19 January 2025
在线发表日期:2025年1月19日
B. Check for updates
B. 检查更新
As a pivotal preparative chromatographic technique in chemistry, column chromatography (CC) is productive in several qualitative and quantitative aspects, including the analysis, separation, and purification of substances ${}^{1}$ . It spans a wide spectrum of applications, including medicine, the chemical industry, and biochemistry ${}^{2}$ . Numerous synthetic laboratories worldwide conduct a staggering volume of CC separations daily to purify synthesized compounds and isolate bioac-tive compounds from natural products ${}^{3,4}$ . However, the effectiveness of CC depends on a number of critical factors, such as the choice of mobile phases, impurities in the mixtures and compounds of interest, and column specifications, which are currently determined by the experimenter’s experience. In general, prior to CC, researchers often perform a thin-layer chromatography (TLC) analysis to determine what conditions should be used in CC.
作为化学中一种关键的制备色谱技术,柱色谱(CC)在多个定性和定量方面都很有成效,包括物质${}^{1}$的分析、分离和纯化。它具有广泛的应用范围,包括医学、化学工业和生物化学${}^{2}$。全球众多合成实验室每天都要进行大量的CC分离,以纯化合成化合物并从天然产物中分离生物活性化合物${}^{3,4}$。然而,CC的有效性取决于许多关键因素,如流动相的选择、混合物和目标化合物中的杂质以及色谱柱规格,目前这些都由实验者的经验来确定。一般来说,在进行CC之前,研究人员通常会进行薄层色谱(TLC)分析,以确定CC中应使用的条件。
As a pilot measure, the retardation factor $\left( {\mathrm{R}}_{\mathrm{F}}\right.$ value) obtained from TLC evaluates the relative polarity of the components in the mixture as compared to the mobile phases, which dominantly affects the separation efficiency achieved in CC. During actual operations, the proportion of mobile phases is usually tailored to maintain the ${\mathrm{R}}_{\mathrm{F}}$ value of the compound of interest within the range of 0.2-0.3 (Fig. 1b). Although empirical, this insight has successfully reduced the requirement for repetitive trials, thereby enhancing separation efficiency. Consequently, it has gained widespread acceptance among the global chemistry community as a reliable method for determining the optimal separation conditions in CC. However, the rationale behind chemists’ experiential methods has not been established and analysed. This leads to the phenomenon of “to know what, but not why”, which impedes a deeper understanding of the chemical essence. This phenomenon essentially stems from the challenge of cross-scale modeling in chromatography.
作为一种初步措施,从TLC获得的阻滞因子$\left( {\mathrm{R}}_{\mathrm{F}}\right.$值评估了混合物中各组分相对于流动相的相对极性,这在很大程度上影响了CC中实现的分离效率。在实际操作中,通常会调整流动相的比例,以将目标化合物的${\mathrm{R}}_{\mathrm{F}}$值保持在0.2 - 0.3的范围内(图1b)。尽管这是经验性的,但这种见解成功地减少了重复试验的需求,从而提高了分离效率。因此,它作为一种确定CC中最佳分离条件的可靠方法,在全球化学界得到了广泛认可。然而,化学家经验方法背后的原理尚未得到确立和分析。这导致了“知其然,不知其所以然”的现象,阻碍了对化学本质的更深入理解。这种现象本质上源于色谱中跨尺度建模的挑战。
${}^{1}$ Al for Science (AI4S)-Preferred Program, Peking University Shenzhen Graduate School, Shenzhen 518055, China. ${}^{2}$ BIC-ESAT, ERE, and SKLTCS, College of Engineering, Peking University, 100871 Beijing, P. R. China. ${}^{3}$ Ningbo Institute of Digital Twin, Eastern Institute of Technology, Ningbo, Zhejiang 315200, P. R. China. ${}^{4}$ School of Materials Science and Engineering, Peking University,100871 Beijing, P. R. China. ${}^{5}$ Zhejiang Key Laboratory of Industrial Intelligence and Digital Twin, Eastern Institute of Technology, Ningbo, Zhejiang 315200, China. ${}^{6}$ School of Advanced Materials, Peking University Shenzhen Graduate School, Shenzhen 518055, China. ${}^{7}$ Guangdong Provincial Key Laboratory of Nano-Micro Materials Research, Peking University Shenzhen Graduate School, Shenzhen 518055, China. C;
${}^{1}$ 北京大学深圳研究生院,人工智能促进科学(AI4S)优先项目,深圳518055,中国。${}^{2}$ 北京大学工程学院,BIC - ESAT、ERE和SKLTCS,北京100871,中华人民共和国。${}^{3}$ 宁波东方理工大学数字孪生研究院,浙江宁波315200,中华人民共和国。${}^{4}$ 北京大学材料科学与工程学院,北京100871,中华人民共和国。${}^{5}$ 浙江东方理工大学工业智能与数字孪生浙江省重点实验室,浙江宁波315200,中国。${}^{6}$ 北京大学深圳研究生院先进材料学院,深圳518055,中国。${}^{7}$ 北京大学深圳研究生院广东省纳米微材料研究重点实验室,深圳518055,中国。;
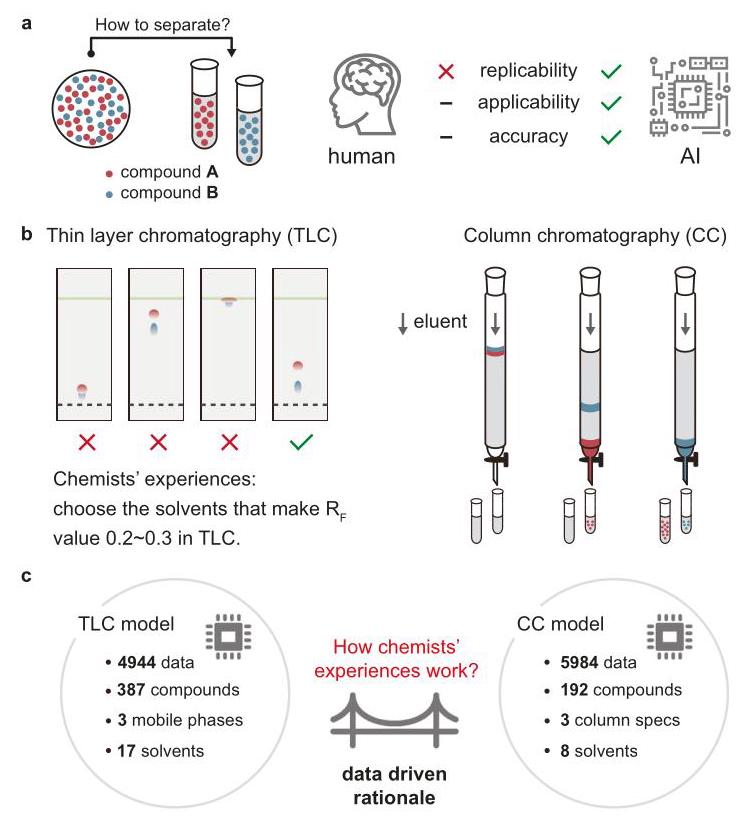
Fig. 1 | Overview of the framework. a Comparison of the human experience and artificial intelligence (AI) experience, exemplified by the task of separating mixtures. b Chemical expertise concerning the determination of the separation conditions in column chromatography (CC) through the retardation factor $\left( {\mathrm{R}}_{\mathrm{F}}\right)$ values of thin-layer chromatography (TLC) when separating mixtures. c The data-driven rationale for the chemists’ experience via statistics and interpretable machine learning through the experimental dataset acquired from the automated platform. The numbers in the figure are from the statistics of the dataset.
图1 | 框架概述。a人类经验与人工智能(AI)经验的比较,以分离混合物的任务为例。b关于通过分离混合物时薄层色谱(TLC)的阻滞因子$\left( {\mathrm{R}}_{\mathrm{F}}\right)$值来确定柱色谱(CC)分离条件的化学专业知识。c通过从自动化平台获取的实验数据集,基于统计和可解释机器学习得出的化学家经验的数据驱动原理。图中的数字来自数据集的统计结果。
As illustrated in Fig. S1, the dynamics of chromatography involve multiple scales ranging from microscopic to macroscopic ${}^{5}$ . For each scale, physicochemical mechanistic models have been established through explicit mathematical equations ${}^{6 - 9}$ , which accurately describe the chromatographic process. Nevertheless, the prediction of the chromatographic results, such as the ${\mathrm{R}}_{\mathrm{F}}$ values and retention times, remains a challenge for mechanistic models because of the elusive coupling relationships between mechanisms at different scales. Therefore, when determining the separation conditions for chromatography, chemists rely more on expertise than on mechanistic models. The empirical insights can reflect the coupling relationships between the TLC and CC to some extent. However, the separation results of CC are influenced by a multitude of factors, including the choice of mobile phase, column type, and various other experimental settings. Consequently, the value of chemical expertise is limited, which may lead to the failure of CC separation within sophisticated contexts. Moreover, chemical expertise is difficult to directly replicate, which requires repeated attempts under human guidance for acquisition. This underscores the paramount importance of transforming empirical insights into formalized knowledge, with the fundamental distinction lying in the provision of a clear rationale. In other words, it is imperative to elucidate, through quantitative methods, how the experimental conditions and results of TLC experiments (i.e., ${\mathrm{R}}_{\mathrm{F}}$ values) influence the outcomes of CC, thereby offering a rationale for chemists to determine the separation conditions.
如图S1所示,色谱动力学涉及从微观到宏观${}^{5}$的多个尺度。对于每个尺度,已经通过明确的数学方程${}^{6 - 9}$建立了物理化学机理模型,这些模型准确地描述了色谱过程。然而,由于不同尺度下机理之间难以捉摸的耦合关系,色谱结果的预测,如${\mathrm{R}}_{\mathrm{F}}$值和保留时间,对于机理模型来说仍然是一个挑战。因此,在确定色谱分离条件时,化学家更多地依赖专业知识而非机理模型。经验见解在一定程度上可以反映TLC和CC之间的耦合关系。然而,CC的分离结果受到多种因素的影响,包括流动相的选择、色谱柱类型和各种其他实验设置。因此,化学专业知识的价值是有限的,这可能导致在复杂情况下CC分离失败。此外,化学专业知识难以直接复制,需要在人工指导下反复尝试才能获得。这突出了将经验见解转化为形式化知识的至关重要性,其根本区别在于提供清晰的原理。换句话说,必须通过定量方法阐明TLC实验的实验条件和结果(即${\mathrm{R}}_{\mathrm{F}}$值)如何影响CC的结果,从而为化学家确定分离条件提供原理。
Statistical and machine learning techniques have been widely adopted in chemistry since they are able to address complex relationships in high-dimensional space ${}^{10}$ . Although various quantitative structure-retention relationship (QSRR) models have been established to predict outcomes for a range of chromatographic techniques, including TLC, CC, and high-performance liquid chromatography (HPLC) ${}^{{11} - {16}}$ , they often operate as “black boxes”, in which the learned relationship cannot be expressed by explicit concise equations ${}^{17}$ . This opacity limits their ability to provide interpretability, a crucial aspect for generating fresh chemical insights. Meanwhile, data issues are at the forefront of the challenge. Acquiring a profound understanding of the relationship between TLC and CC necessitates a copious amount of concordant experimental data. Fortunately, in our previous study, an automated TLC platform was established ${}^{18}$ , and a standardized TLC dataset was proposed for constructing a deep learning model to predict ${\mathrm{R}}_{\mathrm{F}}$ values ${}^{19}$ . Nevertheless, for preparative chromatography techniques such as CC, which are time intensive (ranging from tens of minutes to several hours per experiment), it is impractical to gather an extensive dataset manually.
统计和机器学习技术自能够处理高维空间${}^{10}$中的复杂关系以来,已在化学中广泛应用。尽管已经建立了各种定量结构-保留关系(QSRR)模型来预测包括TLC、CC和高效液相色谱(HPLC)${}^{{11} - {16}}$在内的一系列色谱技术的结果,但它们通常像“黑箱”一样运行,其中学到的关系无法用明确简洁的方程${}^{17}$表示。这种不透明性限制了它们提供可解释性的能力,而可解释性是产生新化学见解的关键方面。同时,数据问题处于挑战的前沿。要深入理解TLC和CC之间的关系,需要大量一致的实验数据。幸运的是,在我们之前的研究中,建立了一个自动化TLC平台${}^{18}$,并提出了一个标准化的TLC数据集用于构建深度学习模型来预测${\mathrm{R}}_{\mathrm{F}}$值${}^{19}$。然而,对于像CC这样的制备色谱技术,每个实验耗时从几十分钟到几个小时不等,手动收集大量数据集是不切实际的。
In this work, we endeavor to embrace a data-centered viewpoint and discern patterns directly from extensive experimental data like a chemist. In other words, we attempt to take a step further to discover the coupling relationship between the TLC and CC from experimental data, which is expressed in a concise equation-like form. This kind of equation is termed as “artificial intelligence (AI) experience” to differentiate it from the empirical formulas summarized by humans. This method elucidates the relationship between TLC and CC explicitly, thereby offering a rationale for chemists to better comprehend the determination of the separation conditions. Compared with human expertise, the “AI experience” obtains a closer alignment with the experimental data, and can be quickly replicated without the human learning process, which enhances its practicality.
在这项工作中,我们努力秉持以数据为中心的观点,像化学家一样直接从大量实验数据中识别模式。换句话说,我们试图更进一步从实验数据中发现TLC和CC之间的耦合关系,这种关系以简洁的类似方程的形式表示。这种方程被称为“人工智能(AI)经验”,以区别于人类总结的经验公式。这种方法明确地阐明了TLC和CC之间的关系,从而为化学家更好地理解分离条件的确定提供了原理。与人类专业知识相比,“AI经验”与实验数据的契合度更高,并且无需人工学习过程即可快速复制,这增强了其实用性。
An automatic platform is constructed to systematically measure the retention volume of 192 compounds under various experimental conditions, resulting in a comprehensive CC dataset of 5984 data points (Fig. 1c). The compounds are chosen according to their diversity and accessibility and include various types, such as ketone, aldehyde, and phenol. Notably, to investigate the relationship between the TLC and CC, the stationary phases in the two modes are maintained to be identical, and the environmental and operational influences are controlled through automated experiments, which are detailed in the Methods section. Given the inconsistency between the existing TLC dataset and the generated CC datasets, surrogate models have been trained to produce consistent model predictions, thereby efficiently bridging the disparity between the two datasets.
构建了一个自动平台,系统地测量192种化合物在各种实验条件下的保留体积,得到了一个包含5984个数据点的全面CC数据集(图1c)。这些化合物根据其多样性和可获取性进行选择,包括各种类型,如酮、醛和酚。值得注意的是,为了研究TLC和CC之间的关系,两种模式下的固定相保持相同,并且通过自动化实验控制环境和操作影响,方法部分有详细说明。鉴于现有TLC数据集与生成的CC数据集之间的不一致性,已经训练了替代模型以产生一致的模型预测,从而有效地弥合两个数据集之间的差异。
With the experimental dataset, a knowledge discovery technique is proposed to discover an explicit “AI experience” from the machine learning models to describe the relationship between TLC and CC, which aids in explaining how chemists determine separation conditions (Fig. 1c). Through the discovered explicit statistical “AI experience”, we can directly estimate the potential intervals of retention volumes for each component in the mixture during CC through rapid TLC experiments and utilized mobile phases. This estimation allows for an assessment of the potential for successful separation under the given conditions, effectively eliminating the need for multiple time-consuming trials of CC. The proposed framework enables the generation of a dependable “AI experience” in the future, thereby enhancing our exploration of scientific inquiries.
利用实验数据集,提出了一种知识发现技术,从机器学习模型中发现明确的“人工智能经验”,以描述薄层色谱(TLC)和柱色谱(CC)之间的关系,这有助于解释化学家如何确定分离条件(图1c)。通过发现的明确统计“人工智能经验”,我们可以通过快速的TLC实验和使用的流动相,直接估计混合物中各组分在CC过程中的保留体积的潜在区间。这种估计能够评估在给定条件下成功分离的可能性,有效避免了对CC进行多次耗时试验的需要。所提出的框架能够在未来生成可靠的“人工智能经验”,从而加强我们对科学探究的探索。
Results
结果
Column chromatography dataset from the automatic platform
来自自动平台的柱色谱数据集
Generating the “AI experience” that elucidates the correlation between the TLC and CC is fundamentally challenging because of the necessity of acquiring sufficient experimental data. In prior research ${}^{19}$ , an automated high-throughput TLC platform was established, enabling the measurement of ${\mathrm{R}}_{\mathrm{F}}$ values for 387 compounds across various mobile phases. In this work, we focus on constructing a comprehensive CC dataset. However, given the substantial time and solvent consumption involved in CC processes, manually collecting abundant data is infeasible.
由于需要获取足够的实验数据,生成阐明薄层色谱(TLC)和柱色谱(CC)之间相关性的“人工智能经验”从根本上来说具有挑战性。在之前的研究${}^{19}$中,建立了一个自动化的高通量TLC平台,能够测量387种化合物在各种流动相中的${\mathrm{R}}_{\mathrm{F}}$值。在这项工作中,我们专注于构建一个全面的CC数据集。然而,考虑到CC过程涉及大量的时间和溶剂消耗,手动收集大量数据是不可行的。
To address this challenge, two strategic approaches are employed. First, an automated platform for CC is invented, which integrates a suite of instrumentation to implement whole-process automation, including sample loading, mobile phase preparation, chromatographic separation, absorbance detection, and result analysis. The design of the automated CC platform is depicted in Fig. S2, and more details are provided in the Methods section. After the completion of an experiment, the absorbance was read and processed by a computer, the peak was identified through the change in absorbance, and the start and end times were obtained from the peak. The identification algorithm is provided in the open source code. The retention volumes are calculated on the basis of the retention time and flow rate. All the processes are controlled and accomplished via a laptop. Notably, two retention volumes $\left( {V}_{\mathrm{S}}\right.$ and $\left. {V}_{\mathrm{E}}\right)$ are recorded. ${V}_{\mathrm{S}}$ represents the volume of the mobile phase when the compound is first detected, whereas ${V}_{\mathrm{E}}$ signifies the volume of the mobile phase when the compound has completely eluted from the column. Consequently, ${V}_{E} - {V}_{S}$ corresponds to the volume of the separated compound solution. This automation significantly reduces the dependency on manual labor, enabling continuous data collection during the day and night, and thereby enhancing experimental efficiency. Furthermore, it minimizes human-induced variability, thereby improving the consistency and accuracy of the collected data.
为了应对这一挑战,采用了两种策略方法。首先,发明了一种用于CC的自动化平台,它集成了一套仪器以实现全过程自动化,包括样品加载、流动相制备、色谱分离、吸光度检测和结果分析。自动化CC平台的设计如图S2所示,更多细节在方法部分提供。实验完成后,吸光度由计算机读取和处理,通过吸光度的变化识别峰,并从峰中获取起始和结束时间。识别算法在开源代码中提供。保留体积根据保留时间和流速计算。所有过程通过笔记本电脑控制和完成。值得注意的是,记录了两个保留体积$\left( {V}_{\mathrm{S}}\right.$和$\left. {V}_{\mathrm{E}}\right)$。${V}_{\mathrm{S}}$表示首次检测到化合物时流动相的体积,而${V}_{\mathrm{E}}$表示化合物完全从柱中洗脱时流动相的体积。因此,${V}_{E} - {V}_{S}$对应于分离出的化合物溶液的体积。这种自动化显著降低了对人工劳动的依赖,能够日夜连续收集数据,从而提高了实验效率。此外,它最大限度地减少了人为引起的变异性,从而提高了所收集数据的一致性和准确性。
Nevertheless, commonly used preparative chromatography columns (e.g., 25 g and 40 g columns) have relatively large column lengths and internal diameters, and contain a relatively large amount of packing material. Consequently, they typically require tens of minutes to several hours to complete an experiment. Therefore, even with the adoption of automated platforms, the costs associated with the solvents and time remain substantial when data are collected on these columns. To mitigate this issue, we adopted a strategy that generates “AI experience” from the data acquired through $4\mathrm{\;g}$ preparative columns, and then extrapolates it to other column specifications, including tandem $4\mathrm{\;g}$ column and ${25}\mathrm{\;g}$ column. Although infrequently utilized, the 4 g column allows for controlled time and solvent volumes in the experiments, which facilitates the acquisition of a substantial amount of experimental data. This strategy is grounded in the fact that the fundamental principles of CC remain the same across divergent column specifications. Therefore, a total of 5984 data points were collected for 192 compounds under a variety of experimental conditions (Fig. 1), including the proportions of the mobile phase (Fig. S3), sample mass, and column specifications. As illustrated in Fig. S4a, within the dataset, the majority of the data are generated via $4\mathrm{\;g}$ columns (4999 data), whereas a small amount of data is obtained from two common column specifications, including the tandem 4 g column (457 data) and the 25 g column (528 data). Notably, data acquisition on these larger columns is markedly more time-consuming, thereby limiting the dataset size. For each data point, the retention volumes of the starting and ending points $\left( {V}_{\mathrm{S}}\right.$ and $\left. {V}_{\mathrm{E}}\right)$ were automatically identified from their respective absorbance curves, the distributions of which are illustrated in Fig. S4b.
然而,常用的制备色谱柱(例如25 g和40 g柱)具有相对较大的柱长和内径,并且包含相对大量的填充材料。因此,它们通常需要几十分钟到几个小时才能完成一个实验。因此,即使采用自动化平台,在这些柱上收集数据时,溶剂和时间成本仍然很高。为了缓解这个问题,我们采用了一种策略,即从通过$4\mathrm{\;g}$制备柱获取的数据中生成“人工智能经验”,然后将其外推到其他柱规格,包括串联$4\mathrm{\;g}$柱和${25}\mathrm{\;g}$柱。虽然4 g柱很少使用,但它允许在实验中控制时间和溶剂量,这有助于获取大量实验数据。这种策略基于这样一个事实,即CC的基本原理在不同的柱规格中是相同的。因此,在各种实验条件下(图1),为192种化合物总共收集了5984个数据点,包括流动相的比例(图S3)、样品质量和柱规格。如图S4a所示,在数据集中,大部分数据是通过$4\mathrm{\;g}$柱生成的(4999个数据),而少量数据是从两种常见的柱规格中获得的,包括串联4 g柱(457个数据)和25 g柱(528个数据)。值得注意的是,在这些较大的柱上进行数据采集明显更耗时,从而限制了数据集的大小。对于每个数据点,从各自的吸光度曲线中自动识别起始和结束点$\left( {V}_{\mathrm{S}}\right.$和$\left. {V}_{\mathrm{E}}\right)$的保留体积,其分布如图S4b所示。
Since the datasets for TLC and CC were independently acquired in distinct experiments, a simple one-to-one mapping between them cannot be established. A comparison of the TLC and CC datasets revealed that there were intersections, including 60 compounds present in both datasets (Fig. S4c). However, for the remaining compounds, the ${\mathrm{R}}_{\mathrm{F}}$ values from TLC and the retention volumes from CC under identical eluent ratios are not simultaneously present. This lack of synchronicity between the two datasets poses a significant challenge in deciphering the interrelationship between TLC and CC.
由于TLC和CC的数据集是在不同的实验中独立获取的,因此无法在它们之间建立简单的一对一映射。TLC和CC数据集的比较表明存在交集,包括两个数据集中都存在的60种化合物(图S4c)。然而,对于其余的化合物,在相同洗脱剂比例下,TLC的${\mathrm{R}}_{\mathrm{F}}$值和CC的保留体积并非同时存在。这两个数据集之间缺乏同步性在解读TLC和CC之间的相互关系方面构成了重大挑战。
The construction of surrogate models and alignment of asyn- chronous datasets
替代模型的构建与异步数据集的对齐
To overcome the disconnect between the independently acquired TLC and CC datasets, our methodology entailed the utilization of surrogate models for the generation of model predictions. This facilitated the extrapolation of unobserved values within the datasets, thus establishing a comprehensive and cohesive relationship between the two datasets.
为了克服独立获取的薄层色谱(TLC)和柱色谱(CC)数据集之间的脱节问题,我们的方法需要利用替代模型来生成模型预测。这有助于推断数据集中未观察到的值,从而在两个数据集之间建立全面且连贯的关系。
Surrogate models, which function as black-box predictive models, can effectively substitute for the original datasets. Here, two surrogate models were trained on the TLC and CC datasets. Each surrogate model was constructed via a five-layer fully connected neural network, which encompassed an input layer, three hidden layers, and an output layer, with each hidden layer composed of 256 neurons. The models were fed inputs comprising compound information and experimental conditions, yielding outputs that represented experimental results. The output neuron is 1 for the TLC model and 2 for the CC model. More details about the construction of surrogate models can be found in the Methods section. These surrogate models excel at learning and establishing intricate high-dimensional mappings between the input information and output results. This facilitates reliable predictions for a range of inputs, especially for the unobserved data points within the datasets.
替代模型作为黑箱预测模型,可以有效地替代原始数据集。在此,在TLC和CC数据集上训练了两个替代模型。每个替代模型通过一个五层全连接神经网络构建,该网络包括一个输入层、三个隐藏层和一个输出层,每个隐藏层由256个神经元组成。模型输入包含化合物信息和实验条件,输出代表实验结果。TLC模型的输出神经元为1,CC模型的输出神经元为2。关于替代模型构建的更多详细信息可在方法部分找到。这些替代模型擅长学习并在输入信息和输出结果之间建立复杂的高维映射。这有助于对一系列输入进行可靠预测,特别是对数据集中未观察到的数据点。
Given the role of surrogate models in elucidating quantitative structure-retention (QSRR) relationships, the precise characterization of both compounds and experimental conditions is of paramount importance for enhancing the models’ predictive accuracy. Notably, owing to the sequential nature of the TLC and CC processes, they share a majority of the characteristic features. As delineated in Fig. 2a, a comprehensive array of 167-dimensional molecular fingerprints and 16 molecular descriptors were employed to characterize the molecular information. The details and descriptions of these molecular descriptors are systematically cataloged in Table S1. These descriptors were carefully selected on the basis of correlation analyses, highlighting the features with significant relevance to both the TLC and CC processes.
鉴于替代模型在阐明定量结构保留(QSRR)关系中的作用,精确表征化合物和实验条件对于提高模型的预测准确性至关重要。值得注意的是,由于TLC和CC过程的顺序性质,它们共享大部分特征。如图2a所示,使用了一系列167维分子指纹和16个分子描述符来表征分子信息。这些分子描述符的详细信息和描述系统地列于表S1中。这些描述符是在相关分析的基础上精心选择的,突出了与TLC和CC过程均具有显著相关性的特征。
In terms of experimental conditions, the ${\mathrm{R}}_{\mathrm{F}}$ value in TLC is predominantly determined by the proportion of the mobile phase, whereas the outcomes of CC under the same mobile phase are influenced by additional factors such as sample mass, sample solvent type, and solvent volume, thereby making these features unique to the CC process. For the mobile phase, an averaged molecular description is adopted, which constitutes a 6-dimensional vector, which is detailed in the Methods section. Consequently, the input of the surrogate model is a 189-dimensional feature vector for TLC, and a 192-dimensional vector for the CC. More details about the characterization are provided in the “Methods” section. To train the surrogate model, the datasets are partitioned into 80% for training, 10% for validation, and 10% for testing. The training epoch is 10,000, and the learning rate is ${10}^{-3}$ . To prevent overfitting, early stopping strategies were employed, where the epoch with the minimum number of validating errors was considered the best epoch. The validated ${R}^{2}$ values for the TLC and CC models are ${0.948}\left( {\mathrm{R}}_{\mathrm{F}}\right.$ value $),{0.838}\left( {V}_{\mathrm{S}}\right)$ , and ${0.898}\left( {V}_{\mathrm{E}}\right)$ . The predictive performance of both the TLC and CC surrogate models on the test dataset is illustrated in Fig. 2b. The results demonstrate the models’ satisfactory predictive capabilities, where the ${R}^{2}$ maintains over 0.8 for the prediction of the ${R}_{F}$ value and retention volume. This can be attributed to the high consistency of datasets sourced from the automated platform and the efficacy of feature characterization. The ${R}^{2}$ of ${\Delta V}$ is relatively low since it is obtained from the predicted ${V}_{\mathrm{S}}$ and ${V}_{\mathrm{E}}$ , which means that the error will accumulate.
在实验条件方面,TLC中的${\mathrm{R}}_{\mathrm{F}}$值主要由流动相的比例决定,而在相同流动相下CC的结果受样品质量、样品溶剂类型和溶剂量等其他因素影响,因此这些特征是CC过程所特有的。对于流动相,采用了平均分子描述,它构成一个6维向量,在方法部分有详细说明。因此,替代模型的输入对于TLC是一个189维特征向量,对于CC是一个192维向量。关于表征的更多详细信息在“方法”部分提供。为了训练替代模型,数据集被划分为80%用于训练,10%用于验证,10%用于测试。训练轮次为10000,学习率为${10}^{-3}$。为防止过拟合,采用了早期停止策略,将验证误差最小的轮次视为最佳轮次。TLC和CC模型的验证${R}^{2}$值分别为${0.948}\left( {\mathrm{R}}_{\mathrm{F}}\right.$值$),{0.838}\left( {V}_{\mathrm{S}}\right)$和${0.898}\left( {V}_{\mathrm{E}}\right)$。图2b展示了TLC和CC替代模型在测试数据集上的预测性能。结果表明模型具有令人满意的预测能力,其中${R}^{2}$在预测${R}_{F}$值和保留体积时保持在0.8以上。这可归因于源自自动化平台的数据集的高度一致性和特征表征的有效性。${\Delta V}$的${R}^{2}$相对较低,因为它是从预测的${V}_{\mathrm{S}}$和${V}_{\mathrm{E}}$获得的,这意味着误差会累积。
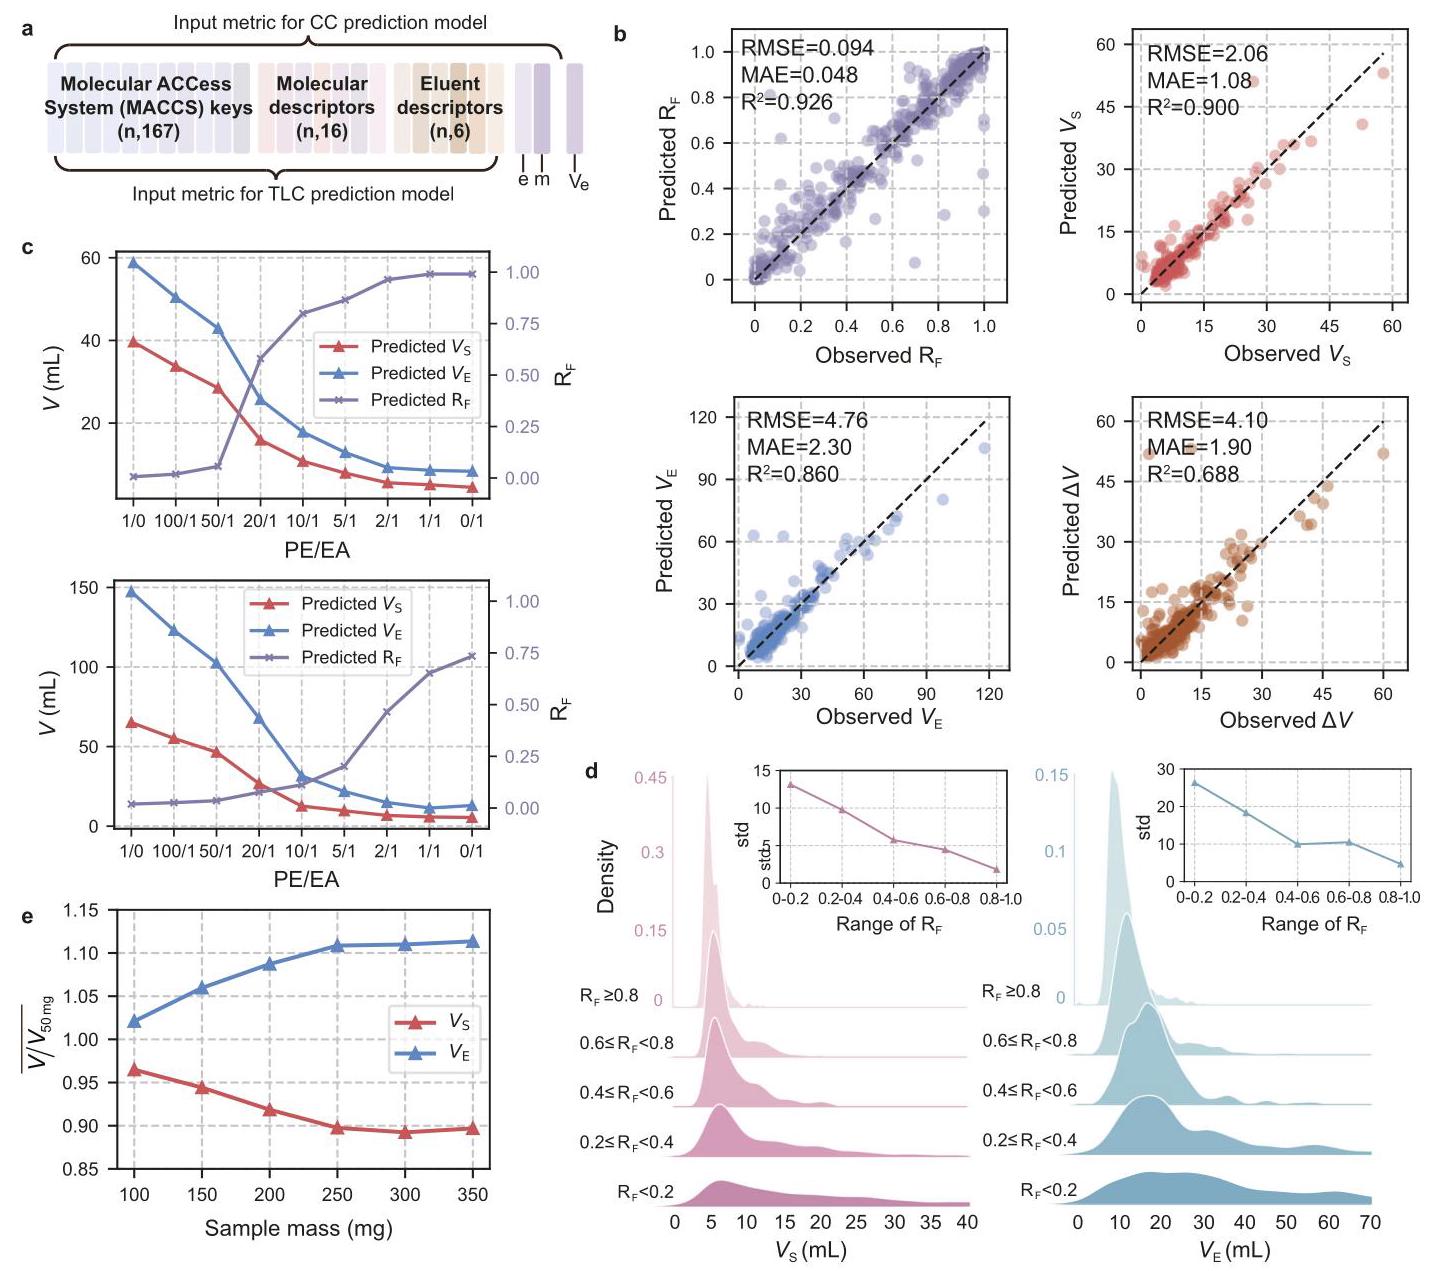
Fig. 2 | The results of surrogate models. a Featurization of the compound information and experimental conditions for the thin-layer chromatography (TLC) and column chromatography (CC) datasets. n is the number of samples, m is the sample mass, e is sample solvent type, and ${\mathrm{V}}_{\mathrm{e}}$ is solvent volume. $\mathbf{b}$ Predictive performance of the surrogate models. c Predicted curves of the mobile phase and the predicted retention volumes and retardation factor $\left( {\mathrm{R}}_{\mathrm{F}}\right)$ values. $\mathbf{d}$ The distribution of retention volume under the experimental conditions with different ${\mathrm{R}}_{\mathrm{F}}$ value ranges, and the standard deviation (std) for different ${\mathrm{R}}_{\mathrm{F}}$ value ranges. The total number of samples are 4279. e Influence of the loading sample mass. The y-axis represents the mean value of the ratio of the retention volume under the corresponding sample mass $\left( V\right)$ to the retention volume under ${50}\mathrm{{mg}}\left( {V}_{{50}\mathrm{{mg}}}\right)$ , with the other experimental conditions remaining the same. The uncertainty is illustrated in Fig. S9. Source data are provided as a Source Data file. Here, PE refers to petroleum ether and EA refers to ethyl acetate. RMSE, MAE and ${\mathrm{R}}^{2}$ refer to the root mean squared error, mean absolute error and coefficient of determination, respectively. ${V}_{\mathrm{S}},{V}_{\mathrm{E}}$ and ${\Delta V}$ refer to the retention volume at starting point, retention volume at ending point, and their difference.
图2 | 替代模型的结果。a 薄层色谱(TLC)和柱色谱(CC)数据集的化合物信息和实验条件的特征化。n为样品数量,m为样品质量,e为样品溶剂类型,${\mathrm{V}}_{\mathrm{e}}$为溶剂体积。$\mathbf{b}$ 替代模型的预测性能。c 流动相的预测曲线以及预测保留体积和阻滞因子$\left( {\mathrm{R}}_{\mathrm{F}}\right)$值。$\mathbf{d}$ 不同${\mathrm{R}}_{\mathrm{F}}$值范围实验条件下保留体积的分布,以及不同${\mathrm{R}}_{\mathrm{F}}$值范围的标准偏差(std)。样品总数为4279。e 进样质量的影响。y轴表示相应样品质量$\left( V\right)$下保留体积与${50}\mathrm{{mg}}\left( {V}_{{50}\mathrm{{mg}}}\right)$下保留体积之比的平均值,其他实验条件保持不变。不确定性见图S9。源数据作为源数据文件提供。此处,PE指石油醚,EA指乙酸乙酯。RMSE、MAE和${\mathrm{R}}^{2}$分别指均方根误差、平均绝对误差和决定系数。${V}_{\mathrm{S}},{V}_{\mathrm{E}}$和${\Delta V}$指起始点保留体积、终点保留体积及其差值。
On the basis of these accurate surrogate models, predictions of the ${\mathrm{R}}_{\mathrm{F}}$ values and retention volumes for the same compound across varying eluent ratios can be conducted. This facilitates the generation of mobile phase-related curves, where datapoints are derived from model predictions rather than direct experimental data (Fig. 2c). Through the application of surrogate models, we effectively reconciled the asynchronous nature of the two datasets, enriching the pool of usable data and establishing a robust foundation for subsequent statistical analysis.
基于这些精确的替代模型,可以对同一化合物在不同洗脱剂比例下的${\mathrm{R}}_{\mathrm{F}}$值和保留体积进行预测。这有助于生成与流动相相关的曲线,其中数据点来自模型预测而非直接实验数据(图2c)。通过应用替代模型,我们有效地协调了两个数据集的异步性,丰富了可用数据池,并为后续统计分析奠定了坚实基础。
For each data point in the CC dataset, the ${R}_{F}$ values under the corresponding mobile phase are obtained from the prediction via the TLC surrogate model. Thus, a unified dataset encompassing both ${R}_{F}$ values and retention volumes is constructed. With this unified dataset, we can analyse the relationship between the ${R}_{F}$ values and the corresponding retention volumes from a statistical perspective. Since the ${R}_{F}$ value serves as an approximate measurement of the relative polarity of the compounds, we coarsely categorize it into different ranges, including 0-0.2, 0.2-0.4, 0.4-0.6, 0.6-0.8, and 0.8-1.0. Notably, this categorization criterion is rudimentary and solely intended for the basic differentiation of ${R}_{F}$ values. The distribution of the retention times corresponding to the data within the different ${R}_{F}$ value ranges is illustrated in Fig. 2d. A conspicuous pattern can be observed in the graph, and shows that as the ${R}_{F}$ value increases, the variance of the retention volume distribution decreases, and vice versa. This pattern indicates a latent, yet significant, relationship between the ${\mathrm{R}}_{\mathrm{F}}$ and retention volumes.
对于CC数据集中的每个数据点,通过TLC替代模型预测获得相应流动相下的${R}_{F}$值。因此,构建了一个包含${R}_{F}$值和保留体积的统一数据集。利用这个统一数据集,我们可以从统计角度分析${R}_{F}$值与相应保留体积之间的关系。由于${R}_{F}$值用作化合物相对极性的近似度量,我们将其粗略地分为不同范围,包括0 - 0.2、0.2 - 0.4、0.4 - 0.6、0.6 - 0.8和0.8 - 1.0。值得注意的是,这种分类标准是初步的,仅用于${R}_{F}$值的基本区分。图2d显示了不同${R}_{F}$值范围内数据对应的保留时间分布。图中可以观察到一个明显的模式,表明随着${R}_{F}$值增加,保留体积分布的方差减小,反之亦然。这种模式表明${\mathrm{R}}_{\mathrm{F}}$与保留体积之间存在潜在但显著的关系。
Moreover, the influence of the loading sample mass can also be investigated from the model predictions, as depicted in Fig. 2e. The figure shows that as the sample mass increases, both the variance and the deviation of the mean value also increase. Interestingly, the trend of the ratio for ${V}_{\mathrm{S}}$ and ${V}_{\mathrm{E}}$ is divergent. The mean ratio of ${V}_{\mathrm{S}}$ decreases to below 1, whereas the mean ratio of ${V}_{\mathrm{E}}$ increases to above 1 . This discovery aligns with the experience that a large loading sample amount may result in column overloading, leading to an increased peak width and decreased resolution. More details can be found in Supplementary Information S1.
此外,如图2e所示,还可以从模型预测中研究进样质量的影响。图中显示,随着样品质量增加,平均值的方差和偏差也增加。有趣的是,${V}_{\mathrm{S}}$和${V}_{\mathrm{E}}$的比例趋势不同。${V}_{\mathrm{S}}$的平均比例降至1以下,而${V}_{\mathrm{E}}$的平均比例升至1以上。这一发现与大量进样可能导致柱过载,从而导致峰宽增加和分离度降低的经验相符。更多细节见补充信息S1。
Rationale for the determination of the separation conditions
确定分离条件的基本原理
In this section, a rationale is established from experimental data via statistics and machine learning, which explicitly describes the latent relationship between the ${\mathrm{R}}_{\mathrm{F}}$ values and CC outcomes (i.e., the retention volume).
在本节中,通过统计和机器学习从实验数据中建立了一个基本原理,该原理明确描述了${\mathrm{R}}_{\mathrm{F}}$值与柱色谱结果(即保留体积)之间的潜在关系。
Here, a methodological approach of knowledge discovery is adopted to probe the TLC-CC nexus, utilizing the unified model predictions derived from trained surrogate models. From the results of the analyses presented in Fig. 2, a potential pattern between the ${R}_{F}$ values and the distribution of retention times is observed. To further investigate this trend, we divided the range of ${R}_{F}$ values into ten equal intervals of length 0.1, allowing for a more detailed examination. Additionally, the effects of the mobile phase proportion were investigated. Specifically, 10 commonly used proportions of petroleum ether (PE) and ethyl acetate (EA), ranging from 1:0 to 0:1, are studied. A higher proportion of PE indicates a lower polarity of the mobile phase, and vice versa. For each specified mobile phase proportion, model predictions can be generated, and the distributions of the retention volumes for all the compounds across different ${R}_{F}$ value ranges can be computed and analysed. These distributions are visualized via box plots (Fig. 3a). Notably, the boxplots refer to the distribution of the retention volumes of compounds whose ${R}_{F}$ values are in specific ranges under a given solvent eluent.
在此,采用知识发现的方法来探究薄层色谱与柱色谱的联系,利用从训练后的替代模型得出的统一模型预测。从图2所示的分析结果中,可以观察到${R}_{F}$值与保留时间分布之间的潜在模式。为了进一步研究这种趋势,我们将${R}_{F}$值范围划分为十个长度为0.1的相等区间,以便进行更详细的检查。此外,还研究了流动相比例的影响。具体而言,研究了10种常用的石油醚(PE)和乙酸乙酯(EA)比例,范围从1:0到0:1。PE比例越高表明流动相极性越低,反之亦然。对于每个指定的流动相比例,可以生成模型预测,并计算和分析不同${R}_{F}$值范围内所有化合物的保留体积分布。这些分布通过箱线图可视化(图3a)。值得注意的是,箱线图指的是在给定溶剂洗脱剂下${R}_{F}$值处于特定范围内的化合物的保留体积分布。
Figure 3 shows several interesting findings. Within each proportion of the mobile phase, exemplified by PE:EA = 50:1 (V/V) (more examples are provided in Fig. S5), a trend is discernible, where higher ${\mathrm{R}}_{\mathrm{F}}$ values are associated with a constricted range of retention volume fluctuations and a corresponding reduction in their mean values. This statistical observation is in alignment with chemical intuition, since a higher ${\mathrm{R}}_{\mathrm{F}}$ value corresponds to a sample with a smaller polarity, where the retention volume is usually small. Moreover, for an identical ${\mathrm{R}}_{\mathrm{F}}$ value range, the retention volumes of mobile phases with larger polarities are discovered to have a smaller variance. This implies that, for an identical ${\mathrm{R}}_{\mathrm{F}}$ value range, a larger mobile phase polarity will result in a lower uncertainty. Consequently, from a statistical perspective, the retention volume is correlated with both the ${\mathrm{R}}_{\mathrm{F}}$ value and the eluent ratio. Through this statistical approach, a quantitative analysis of the selection of separation conditions can be conducted.
图3显示了几个有趣的发现。在流动相的每个比例下,以PE:EA = 50:1(V/V)为例(图S5提供了更多示例),可以看出一种趋势,即较高的${\mathrm{R}}_{\mathrm{F}}$值与保留体积波动范围的缩小以及相应平均值的降低相关。这一统计观察结果与化学直觉一致,因为较高的${\mathrm{R}}_{\mathrm{F}}$值对应于极性较小的样品,其保留体积通常较小。此外,对于相同的${\mathrm{R}}_{\mathrm{F}}$值范围,发现极性较大的流动相的保留体积具有较小的方差。这意味着,对于相同的${\mathrm{R}}_{\mathrm{F}}$值范围,较大的流动相极性将导致较低的不确定性。因此,从统计学角度来看,保留体积与${\mathrm{R}}_{\mathrm{F}}$值和洗脱剂比例都相关。通过这种统计方法,可以对分离条件的选择进行定量分析。
Let us assume that the mixture contains the desired product A and an impurity B, for simplicity in the analysis. In TLC experiments, the respective ${\mathrm{R}}_{\mathrm{F}}$ values of both compounds can be obtained simultaneously. Given the mobile phase proportion, and the corresponding ${\mathrm{R}}_{\mathrm{F}}$ values, the distribution range of their retention volumes $\left( {V}_{\mathrm{S}}\right.$ and $\left. {V}_{\mathrm{E}}\right)$ on CC can be determined from Fig. 3a. Evidently, complete separation is only achievable when either the ${V}_{\mathrm{S}}$ of product $\mathrm{A}$ is larger than the ${V}_{\mathrm{E}}$ of impurity B, or the ${V}_{\mathrm{S}}$ of impurity B is larger than the ${V}_{\mathrm{E}}$ of product A. By combining the distribution ranges of A’s and B’s respective retention volumes, the separation index for this scenario can be calculated, which is defined as the ratio of the length of the distribution range of the retention volumes in complete separation to the length of the overall distribution range. The detailed definitions and calculation process can be found in Supplementary Information S2. Here, a larger separation index corresponds to a greater possibility of separation in CC. For each mobile phase proportion, the corresponding separation index for A and B in different ${\mathrm{R}}_{\mathrm{F}}$ value intervals can be calculated, resulting in a matrix of separation indices. By taking the average of the separation index matrices corresponding to the eight commonly used mobile phase proportions, a statistical separation index matrix can be obtained, which is displayed in Fig. 3b.
为了简化分析,假设混合物中含有所需产物A和杂质B。在薄层色谱实验中,可以同时获得两种化合物各自的${\mathrm{R}}_{\mathrm{F}}$值。给定流动相比例以及相应的${\mathrm{R}}_{\mathrm{F}}$值,可以从图3a中确定它们在柱色谱上的保留体积$\left( {V}_{\mathrm{S}}\right.$和$\left. {V}_{\mathrm{E}}\right)$的分布范围。显然,只有当产物$\mathrm{A}$的${V}_{\mathrm{S}}$大于杂质B的${V}_{\mathrm{E}}$,或者杂质B的${V}_{\mathrm{S}}$大于产物A的${V}_{\mathrm{E}}$时,才能实现完全分离。通过结合A和B各自保留体积的分布范围,可以计算出这种情况下的分离指数,其定义为完全分离时保留体积分布范围的长度与总分布范围长度的比值。详细定义和计算过程可在补充信息S2中找到。在此,较大的分离指数对应于柱色谱中更大的分离可能性。对于每个流动相比例,可以计算不同${\mathrm{R}}_{\mathrm{F}}$值区间内A和B的相应分离指数,从而得到一个分离指数矩阵。通过对八个常用流动相比例对应的分离指数矩阵求平均值,可以得到一个统计分离指数矩阵,如图3b所示。
In Fig. 3b, lighter red indicate smaller separation indices, whereas deeper red indicates larger ones. Interestingly, a distinct pattern emerges. The separation indices corresponding to the lower right corner of the matrix are always relatively small. This suggests that when both ${\mathrm{R}}_{\mathrm{F}}$ values exceed 0.5, the likelihood of separation is low, even with a significant difference in the ${R}_{F}$ values of both compounds. Moreover, when one compound has a small ${R}_{F}$ value (especially less than 0.3), the separation index is generally large, and a greater difference in ${\mathrm{R}}_{\mathrm{F}}$ values between the two compounds increases the possibility of separation. Figure 3a shows that a smaller ${\mathrm{R}}_{\mathrm{F}}$ value corresponds to a larger mean value of the retention volume distribution, indicating that a longer time is required for separation. Therefore, maintaining the ${\mathrm{R}}_{\mathrm{F}}$ value of the desired product within the range of 0.2 to 0.3 is optimal for separation. Through the separation index matrix, we provide a statistical rationale for the empirical determination of the separation conditions in CCs. Additionally, we have observed that if there is no discernible difference in ${\mathrm{R}}_{\mathrm{F}}$ values among the components of the mixture in TLC, they are most likely not separable in CC.
在图3b中,浅红色表示较小的分离指数,而深红色表示较大的分离指数。有趣的是,出现了一种明显的模式。与矩阵右下角对应的分离指数总是相对较小。这表明,当两个${\mathrm{R}}_{\mathrm{F}}$值都超过0.5时,即使两种化合物的${R}_{F}$值存在显著差异,分离的可能性也很低。此外,当一种化合物的${R}_{F}$值较小时(尤其是小于0.3),分离指数通常较大,并且两种化合物之间${\mathrm{R}}_{\mathrm{F}}$值的差异越大,分离的可能性就越大。图3a表明,较小的${\mathrm{R}}_{\mathrm{F}}$值对应着保留体积分布的较大平均值,这表明分离需要更长的时间。因此,将所需产物的${\mathrm{R}}_{\mathrm{F}}$值保持在0.2至0.3的范围内对于分离是最佳的。通过分离指数矩阵,我们为CC中分离条件的经验确定提供了统计依据。此外,我们观察到,如果在TLC中混合物的各组分之间${\mathrm{R}}_{\mathrm{F}}$值没有明显差异,那么它们在CC中很可能无法分离。
Furthermore, we attempt to express the inherent relationship between ${\mathrm{R}}_{\mathrm{F}}$ values and retention volumes through explicit formulas. As illustrated in Fig. 3c, the mean values of the retention volume distribution across divergent mobile phase proportions and the ${\mathrm{R}}_{\mathrm{F}}$ values were calculated. The figure shows that the mean retention volume follows an inversely proportional relationship, where an increase in the mobile phase proportion precipitates a decrease in the inverse proportionality coefficient. To elucidate this complex relationship explicitly, the symbolic regression algorithm, pySR, is employed, which facilitates the derivation of an exceptionally concise and accurate equation ${}^{20}$ . The number of iterations is 100, the utilized operators are $+ , \times$ , and /, and the criterion is the mean squared error. To discover a concise equation, only the outcomes with complexities smaller than 10 are considered. Both the structural complexity and regression loss are considered when choosing the best equation. The discovered equations are written as:
此外,我们试图通过明确的公式来表达${\mathrm{R}}_{\mathrm{F}}$值与保留体积之间的内在关系。如图3c所示,计算了不同流动相比例下保留体积分布的平均值以及${\mathrm{R}}_{\mathrm{F}}$值。该图表明,平均保留体积呈现反比例关系,其中流动相比例的增加会导致反比例系数的减小。为了明确阐明这种复杂关系,采用了符号回归算法pySR,它有助于推导一个异常简洁准确的方程${}^{20}$。迭代次数为100,使用的运算符是$+ , \times$和/,标准是均方误差。为了发现一个简洁的方程,只考虑复杂度小于10的结果。在选择最佳方程时,同时考虑结构复杂度和回归损失。发现的方程如下所示:
$$ {\bar{V}}_{S} = \left\{ \begin{matrix} \frac{r}{{0.147} \cdot {\mathrm{R}}_{\mathrm{F}} + {0.0114}}, r > 0 \\ {5.147}, r = 0 \end{matrix}\right. \tag{1} $$$$ {\bar{V}}_{E} = \left\{ {\begin{matrix} \frac{r}{{0.069} \cdot {\mathrm{R}}_{\mathrm{F}} + {0.0054}} \\ {10.98}, r = 0 \end{matrix}, r > 0}\right. \tag{2} $$$$ r = \frac{{r}_{PE}}{{r}_{PE} + {r}_{EA}} \tag{3} $$where ${\bar{V}}_{S}$ and ${\bar{V}}_{E}$ refer to the mean retention volume, and $r$ is the proportion of PE in the eluent. The ${R}^{2}$ values of the symbolic regression for ${\bar{V}}_{S}$ and ${\bar{V}}_{E}$ are 0.882 and 0.900, respectively. Notably, the resemblance in form between ${\bar{V}}_{S}$ and ${\bar{V}}_{E}$ suggests a potential inner relationship, given that the symbolic regression was performed independently during the equation discovery process. Interestingly, ${\bar{V}}_{E}$ is approximately twice the value of ${\bar{V}}_{S}$ in the $4\mathrm{\;g}$ column. Fundamentally, this can be rationalized by the fact that a larger ${V}_{\mathrm{S}}$ frequently signifies a slower solute outflow, which typically coincides with a higher ${V}_{\mathrm{E}}$ . Traditionally, experimenters may discern this trend, yet the discovered equations can clearly illustrate this pattern.
其中${\bar{V}}_{S}$和${\bar{V}}_{E}$指平均保留体积,$r$是洗脱液中PE的比例。${\bar{V}}_{S}$和${\bar{V}}_{E}$的符号回归的${R}^{2}$值分别为0.882和0.900。值得注意的是,${\bar{V}}_{S}$和${\bar{V}}_{E}$在形式上的相似性表明它们可能存在潜在的内在关系,因为在方程发现过程中符号回归是独立进行的。有趣的是,在$4\mathrm{\;g}$列中,${\bar{V}}_{E}$大约是${\bar{V}}_{S}$值的两倍。从根本上说,这可以通过以下事实来解释:较大的${V}_{\mathrm{S}}$通常意味着溶质流出较慢,这通常与较高的${V}_{\mathrm{E}}$相吻合。传统上,实验者可能会察觉到这种趋势,但发现的方程可以清楚地说明这种模式。
These discovered equations are concise and practically significant, and unravel the statistical interconnection between the ${\mathrm{R}}_{\mathrm{F}}$ values and retention volumes, translating conventional experiential insights into a quantifiable, explicit formula. By applying this formula, it becomes feasible to predict the range of outcomes in CC on the basis of the preliminary TLC findings, thus substantially facilitating the determination of the potential for a successful separation under the given conditions. Considering that TLC usually only takes a few minutes, while CC requires more time and solvent, the proposed equation can improve the efficiency of the CC process.
这些发现的方程简洁且具有实际意义,揭示了${\mathrm{R}}_{\mathrm{F}}$值与保留体积之间的统计联系,将传统的经验见解转化为可量化的明确公式。通过应用这个公式,根据初步的TLC结果预测CC中的结果范围变得可行,从而极大地有助于确定在给定条件下成功分离的可能性。考虑到TLC通常只需要几分钟,而CC需要更多时间和溶剂,所提出的方程可以提高CC过程的效率。
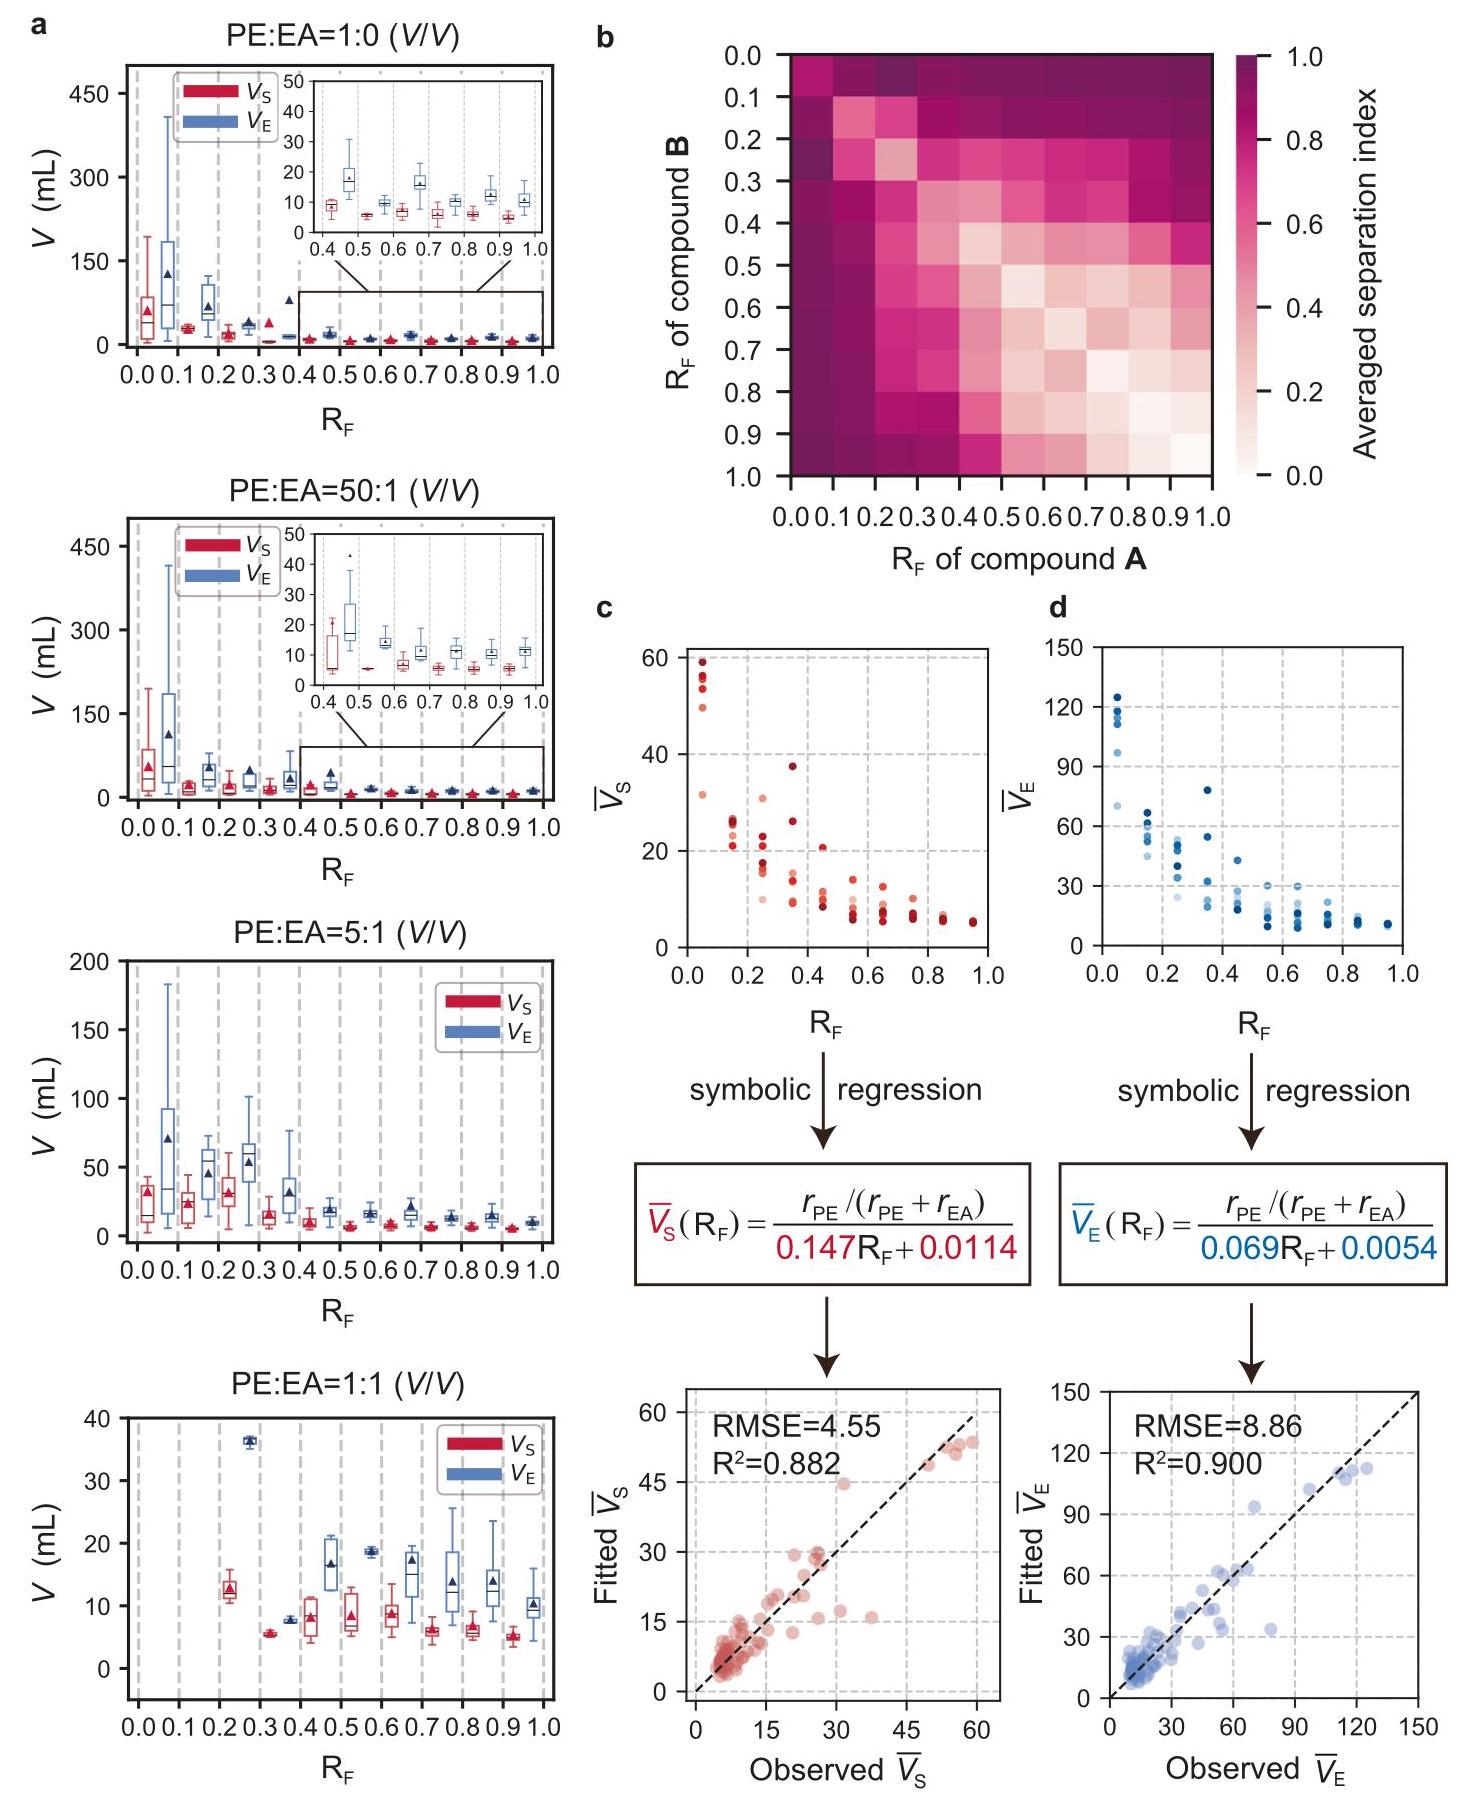
Fig. 3 | Discovery of the relationship between the retention volumes of column chromatography and the retardation factor (RF) values. a The distribution of retention volumes in diverse ranges of ${\mathrm{R}}_{\mathrm{F}}$ values under given mobile phase proportions. The sample size $n = {585}$ . The boxplot is defined by the maximum, minimum, and quartiles. The mean values are represented by triangles and the median values are denoted by lines. b The statistically averaged separation index matrix. c The mean retention volumes ${\bar{V}}_{S}$ under different ${\mathrm{R}}_{\mathrm{F}}$ value ranges and eluent ratios and the discovered formula. $\mathbf{d}$ The mean retention volumes ${\bar{V}}_{E}$ under different ${\mathrm{R}}_{\mathrm{F}}$ value ranges and eluent ratios and the discovered formula. The observed mean retention volumes and fitted mean retention volumes by the formula are displayed under the equation. Here, PE refers to petroleum ether and EA refers to ethyl acetate. ${r}_{\mathrm{{PE}}}$ and ${r}_{\mathrm{{EA}}}$ are the proportion of PE and EA in the eluent. RMSE and ${\mathrm{R}}^{2}$ refer to the root mean squared error and coefficient of determination, respectively. Source data are provided as a Source Data file.
图3 | 柱色谱保留体积与阻滞因子(RF)值之间关系的发现。a 在给定流动相比例下,${\mathrm{R}}_{\mathrm{F}}$值不同范围内保留体积的分布。样本量为$n = {585}$。箱线图由最大值、最小值和四分位数定义。平均值用三角形表示,中位数用线条表示。b 统计平均分离指数矩阵。c 在不同${\mathrm{R}}_{\mathrm{F}}$值范围和洗脱液比例下的平均保留体积${\bar{V}}_{S}$以及发现的公式。$\mathbf{d}$在不同${\mathrm{R}}_{\mathrm{F}}$值范围和洗脱液比例下的平均保留体积${\bar{V}}_{E}$以及发现的公式。公式下方显示了通过该公式观察到的平均保留体积和拟合的平均保留体积。此处,PE指石油醚,EA指乙酸乙酯。${r}_{\mathrm{{PE}}}$和${r}_{\mathrm{{EA}}}$分别是洗脱液中PE和EA的比例。RMSE和${\mathrm{R}}^{2}$分别指均方根误差和决定系数。源数据作为源数据文件提供。
Model generalization across different compounds and column specifications
跨越不同化合物和色谱柱规格的模型泛化
Utilizing advanced knowledge discovery methodologies, we formulate equations that correlate the ${\mathrm{R}}_{\mathrm{F}}$ values with the mean retention volumes ${\bar{V}}_{S}$ and ${\bar{V}}_{E}$ in Eqs. (1) and (2), offering a statistical interpretation of the macroscopic relationship between the TLC and CC. However, even under identical ${\mathrm{R}}_{\mathrm{F}}$ values, diverse compounds and column specifications influence the retention volume. In this section, we aim to quantify this influence to achieve a more generalized and accurate “AI experience”. To quantify the influence of compounds, a variable named the CC ratio $\varepsilon$ , which is defined as the ratio of the actual retention volume $V$ of a compound to the predicted average retention volume $\bar{V}$ under given experimental conditions, is proposed in this study.
利用先进的知识发现方法,我们在等式(1)和(2)中建立了将${\mathrm{R}}_{\mathrm{F}}$值与平均保留体积${\bar{V}}_{S}$和${\bar{V}}_{E}$进行关联的方程,从而对薄层色谱(TLC)和柱色谱(CC)之间的宏观关系进行了统计解释。然而,即使在相同的${\mathrm{R}}_{\mathrm{F}}$值下,不同的化合物和色谱柱规格也会影响保留体积。在本节中,我们旨在量化这种影响,以实现更通用、更准确的“人工智能体验”。为了量化化合物的影响,本研究提出了一个名为CC比率$\varepsilon$的变量,它被定义为化合物在给定实验条件下的实际保留体积$V$与预测平均保留体积$\bar{V}$的比率。
$$ \varepsilon = \frac{V}{\bar{V}} \tag{4} $$Notably, under a fixed mobile phase proportion, the CC ratio $\varepsilon$ depends exclusively on the structural and property characteristics of the compound. Nonetheless, deriving a direct equation for $\varepsilon$ is challenging because of the representation of the compound features by high-dimensional vectors composed of molecular fingerprints and descriptors. Therefore, this study employs a visual tree structure to represent the relationship between the CC ratio $\varepsilon$ and the compounds. Owing to the binary nature of molecular fingerprints, tree structures are particularly suitable for depicting this relationship. For each mobile phase proportion, a regression tree is trained on the model predictions, establishing a correlation between the CC ratio and the compound’s structural and property attributes. Regression trees in all the mobile phase proportions collectively form a forest. The maximum depth of the regression tree is 9 , the minimum leaf depth is 1 , and the criterion is the mean absolute error.
值得注意的是,在固定的流动相比例下,CC比率$\varepsilon$仅取决于化合物的结构和性质特征。然而,由于由分子指纹和描述符组成的高维向量对化合物特征的表示,推导$\varepsilon$的直接方程具有挑战性。因此,本研究采用可视化树结构来表示CC比率$\varepsilon$与化合物之间的关系。由于分子指纹的二元性质,树结构特别适合描述这种关系。对于每个流动相比例,在模型预测上训练回归树,建立CC比率与化合物结构和性质属性之间的相关性。所有流动相比例下的回归树共同形成一个森林。回归树的最大深度为9,最小叶深度为1,准则是平均绝对误差。
In this context, the visual regression trees for PE:EA ratios of 50:1 (V/V) (Figs. 4a) and 1:1 (V/V) (Fig. 4b) are exemplified via dendrograms. For enhanced clarity, the CC ratio $\varepsilon$ is divided into three categories, including $\varepsilon \leq {0.5},{0.5} < \varepsilon \leq 1$ , and $\varepsilon > 1$ , each are indicated by distinct colors. Variables closer to the roots have greater importance and correlation, whereas those closer to the leaves have less importance and correlation. The dendrogram’s branching pattern distinctly separates different $\varepsilon$ values, clearly illustrating the decision logic of the regression trees, and the influence of pertinent variables on the CC ratio $\varepsilon$ . The figure reveals that the molecular descriptors AATSCOP and TPSA are dominant. AATSCOP, which was previously utilized in predicting liquid chromatography retention times without an elucidated mechanism ${}^{21}$ , was found to inversely correlate with the CC ratio $\varepsilon$ . Conversely, TPSA, known for its strong correlation with molecular polarities and TLC outcomes ${}^{19}$ , demonstrates direct proportionality with $\varepsilon$ .
在此背景下,通过树状图举例说明了体积比为50:1(V/V)(图4a)和1:1(V/V)(图4b)的石油醚:乙酸乙酯(PE:EA)比率的可视化回归树。为了更清晰起见,CC比率$\varepsilon$分为三类,包括$\varepsilon \leq {0.5},{0.5} < \varepsilon \leq 1$和$\varepsilon > 1$,每类用不同颜色表示。离根更近的变量具有更大的重要性和相关性,而离叶更近的变量重要性和相关性较小。树状图的分支模式明显区分了不同的$\varepsilon$值,清楚地说明了回归树的决策逻辑,以及相关变量对CC比率$\varepsilon$的影响。该图显示分子描述符AATSCOP和TPSA占主导地位。之前在预测液相色谱保留时间时使用但没有阐明机制${}^{21}$的AATSCOP,被发现与CC比率$\varepsilon$呈负相关。相反,以与分子极性和TLC结果${}^{19}$强相关而闻名的TPSA,与$\varepsilon$呈正比。
In contrast to neural network models, the simplicity of the regression tree models permits a visual representation, thereby offering superior interpretability. Additionally, limiting the regression tree’s maximum depth automatically selects the most relevant variables from the high-dimensional data, thereby achieving a sparse representation. However, regression trees often fall short in modeling complex relationships, and often exhibit suboptimal predictive capabilities. In this study, the regression tree model is developed on the basis of insights from Eqs. (1), (2), thereby reducing relationship complexity for improved data fitting, and enhancing both interpretability and chemical relevance. Table S2 demonstrates the accuracy of the CC ratio $\varepsilon$ predicted by the regression trees across different mobile phase proportions, confirming their effectiveness in learning the latent relationships between $\varepsilon$ and compounds.
与神经网络模型相比,回归树模型的简单性允许进行可视化表示,从而提供了更高的可解释性。此外,限制回归树的最大深度会自动从高维数据中选择最相关的变量,从而实现稀疏表示。然而,回归树在对复杂关系进行建模时往往不足,并且通常表现出次优的预测能力。在本研究中,回归树模型是基于等式(1)、(2)的见解开发的,从而降低了关系复杂性以改善数据拟合,并提高了可解释性和化学相关性。表S2展示了回归树在不同流动相比例下预测CC比率$\varepsilon$的准确性,证实了它们在学习$\varepsilon$与化合物之间潜在关系方面的有效性。
With the predicted $\varepsilon$ , the retention volumes can be directly calculated from the utilized mobile phase proportion and the corresponding ${\mathrm{R}}_{\mathrm{F}}$ values in the TLC through Eqs. (1) and (2). Compared with direct tree model training, this approach not only intensifies precision but also augments chemical interpretability (Fig. S6). While the regression tree model’s prediction accuracy $\left( {{R}^{2} = {0.678}}\right)$ slightly lags behind that of previous surrogate models, its complete interpretability is paramount. This study offers invaluable insights into the intricacies of the CC process.
利用预测的$\varepsilon$,可以通过等式(1)和(2)从所使用的流动相比例和TLC中相应的${\mathrm{R}}_{\mathrm{F}}$值直接计算保留体积。与直接训练树模型相比,这种方法不仅提高了精度,还增强了化学可解释性(图S6)。虽然回归树模型的预测准确性$\left( {{R}^{2} = {0.678}}\right)$略落后于之前的替代模型,但其完全可解释性至关重要。本研究为柱色谱过程的复杂性提供了宝贵的见解。
The equations can be easily extrapolated to other column specifications with a small amount of data through a transfer learning strategy, which recalibrates the coefficients of the equations learned from the symbolic regression with the data from the target domain. Compared with fine-tuning machine learning models, this strategy has greater computational efficiency since it only needs a simple regression. Crucially, while acknowledging that the column specifications do not influence the fundamental principles of chromatography, the inverse proportional statistical relationship encapsulated by these equations is expected to remain valid, with the inverse proportionality coefficient varying in accordance with the column specification. Moreover, the CC ratio, which is dependent on the compound characteristics, should maintain its consistency across the different column specifications. Therefore, extrapolation to other column specifications can be accomplished by fitting the coefficients in Eqs. (1) and (2), which is a process detailed in the Methods section.
通过迁移学习策略,利用少量数据即可轻松将这些方程外推至其他色谱柱规格,该策略会根据目标域的数据重新校准从符号回归中学习到的方程系数。与微调机器学习模型相比,此策略具有更高的计算效率,因为它仅需进行简单回归。至关重要的是,尽管认识到色谱柱规格不会影响色谱的基本原理,但预计这些方程所包含的反比例统计关系依然有效,反比例系数会根据色谱柱规格而变化。此外,取决于化合物特性的CC比率在不同色谱柱规格之间应保持一致。因此,通过拟合方程(1)和(2)中的系数即可完成向其他色谱柱规格的外推,这一过程在方法部分有详细说明。
Here, the tandem $4\mathrm{\;g}$ column and ${25}\mathrm{\;g}$ column are taken as examples. As depicted in Fig. 5a, b, the straightforward application of Eqs. (1) and (2) to these distinct cases is impractical, as it would yield substantial errors, particularly when the column specification disparity is pronounced. After recalibrating the coefficients in Eqs. (1) and (2) with data from the target domain, the modified equations can be written as:
在此,以串联$4\mathrm{\;g}$柱和${25}\mathrm{\;g}$柱为例。如图5a、b所示,将方程(1)和(2)直接应用于这些不同情况是不切实际的,因为这会产生大量误差,尤其是当色谱柱规格差异显著时。在用目标域的数据重新校准方程(1)和(2)中的系数后,修正后的方程可写为:
$$ {V}_{S}^{{4g} + {4g}} = \left\{ {\begin{matrix} \frac{r \cdot \varepsilon }{{0.055} \cdot {\mathrm{R}}_{\mathrm{F}} + {0.0062}}, r > 0 \\ {7.832} \cdot \varepsilon , r = 0 \end{matrix},{V}_{E}^{{4g} + {4g}} = \left\{ {\begin{matrix} \frac{r \cdot \varepsilon }{{0.031} \cdot {\mathrm{R}}_{\mathrm{F}} + {0.0036}}, r > 0 \\ {17.61} \cdot \varepsilon , r = 0 \end{matrix},}\right. }\right. \tag{5} $$$$ {V}_{S}^{25g} = \left\{ {\begin{matrix} \frac{r \cdot \varepsilon }{{0.022} \cdot {\mathrm{R}}_{\mathrm{F}} + {0.0027}}, r > 0 \\ {15.70} \cdot \varepsilon , r = 0 \end{matrix},{V}_{E}^{25g} = \left\{ {\begin{matrix} \frac{r \cdot \varepsilon }{{0.013} \cdot {\mathrm{R}}_{\mathrm{F}} + {0.0016}}, r > 0 \\ {26.81} \cdot \varepsilon , r = 0 \end{matrix},}\right. }\right. \tag{6} $$where ${V}_{S}^{{4g} + {4g}}$ and ${V}_{F}^{{4g} + {4g}}$ refer to the predicted retention volumes for the tandem $4\mathrm{\;g}$ column, and where ${V}_{S}^{25g}$ and ${V}_{E}^{25g}$ refer to the predicted retention volumes for the ${25}\mathrm{\;g}$ column. The predictive capabilities of the modified equations are depicted in Fig. 5a, b. The equations can predict the retention volumes well, but the performance is relatively worse than that of the $4\mathrm{\;g}$ column. This may be because the amount of data in larger columns is smaller, and the difference between the large column and the small column is notable, affecting the transfer learning. From an analytical standpoint, as the mass of the column packing increases, the coefficient in the denominator decreases, indicating larger retention volumes.
其中${V}_{S}^{{4g} + {4g}}$和${V}_{F}^{{4g} + {4g}}$指串联$4\mathrm{\;g}$柱的预测保留体积,${V}_{S}^{25g}$和${V}_{E}^{25g}$指${25}\mathrm{\;g}$柱的预测保留体积。修正后方程的预测能力如图5a、b所示。这些方程能够较好地预测保留体积,但其性能相对$4\mathrm{\;g}$柱而言较差。这可能是因为较大色谱柱中的数据量较小,且大色谱柱与小色谱柱之间的差异显著,影响了迁移学习。从分析角度来看,随着色谱柱填料质量的增加,分母中的系数减小,表明保留体积增大。
Discussion
讨论
This study provides a rationale for the determination of the separation conditions from the perspective of statistics through machine learning techniques. To guarantee the effectiveness and generalizability of the discovered relationship between TLC and CC, automated platforms are established to conduct standardized experiments, where the stationary phase, humidity, temperature, and other environmental and operational influences are controlled. Surrogate models are constructed to align the asynchronous experimental datasets for TLC and CC. Our work introduces a separation index matrix that quantitatively explains the chemical expertise that the ${\mathrm{R}}_{\mathrm{F}}$ value of the compound of interest should be tailored to 0.2-0.3 in TLC. Furthermore, the “AI experience” is extracted from the experimental data obtained from automatic platforms via knowledge discovery frameworks, where explicit equations that describe the interplay between ${R}_{F}$ values and retention volumes have first been identified. This process converts conventional chemical insights into formalized equations, enabling quantitative predictions of the outcomes of CC on the basis of preliminary TLC data. The equations can be easily extrapolated to other column specifications via a simple nonlinear regression of coefficients. This advancement not only deepens the understanding of chromatographic separation but also improves experimental efficiency.
本研究从统计学角度出发,通过机器学习技术为确定分离条件提供了理论依据。为确保所发现的薄层色谱(TLC)与柱色谱(CC)之间关系的有效性和通用性,建立了自动化平台来进行标准化实验,其中固定相、湿度、温度以及其他环境和操作影响因素均受到控制。构建替代模型以对齐TLC和CC的异步实验数据集。我们的工作引入了一个分离指数矩阵,该矩阵定量解释了在TLC中,目标化合物的${\mathrm{R}}_{\mathrm{F}}$值应调整为0.2 - 0.3的化学专业知识。此外,通过知识发现框架从自动平台获得的实验数据中提取“人工智能经验”,其中首先确定了描述${R}_{F}$值与保留体积之间相互作用的明确方程。这一过程将传统的化学见解转化为形式化方程,从而能够基于初步的TLC数据对CC的结果进行定量预测。通过对系数进行简单的非线性回归,这些方程可以轻松外推到其他柱规格。这一进展不仅加深了对色谱分离的理解,还提高了实验效率。
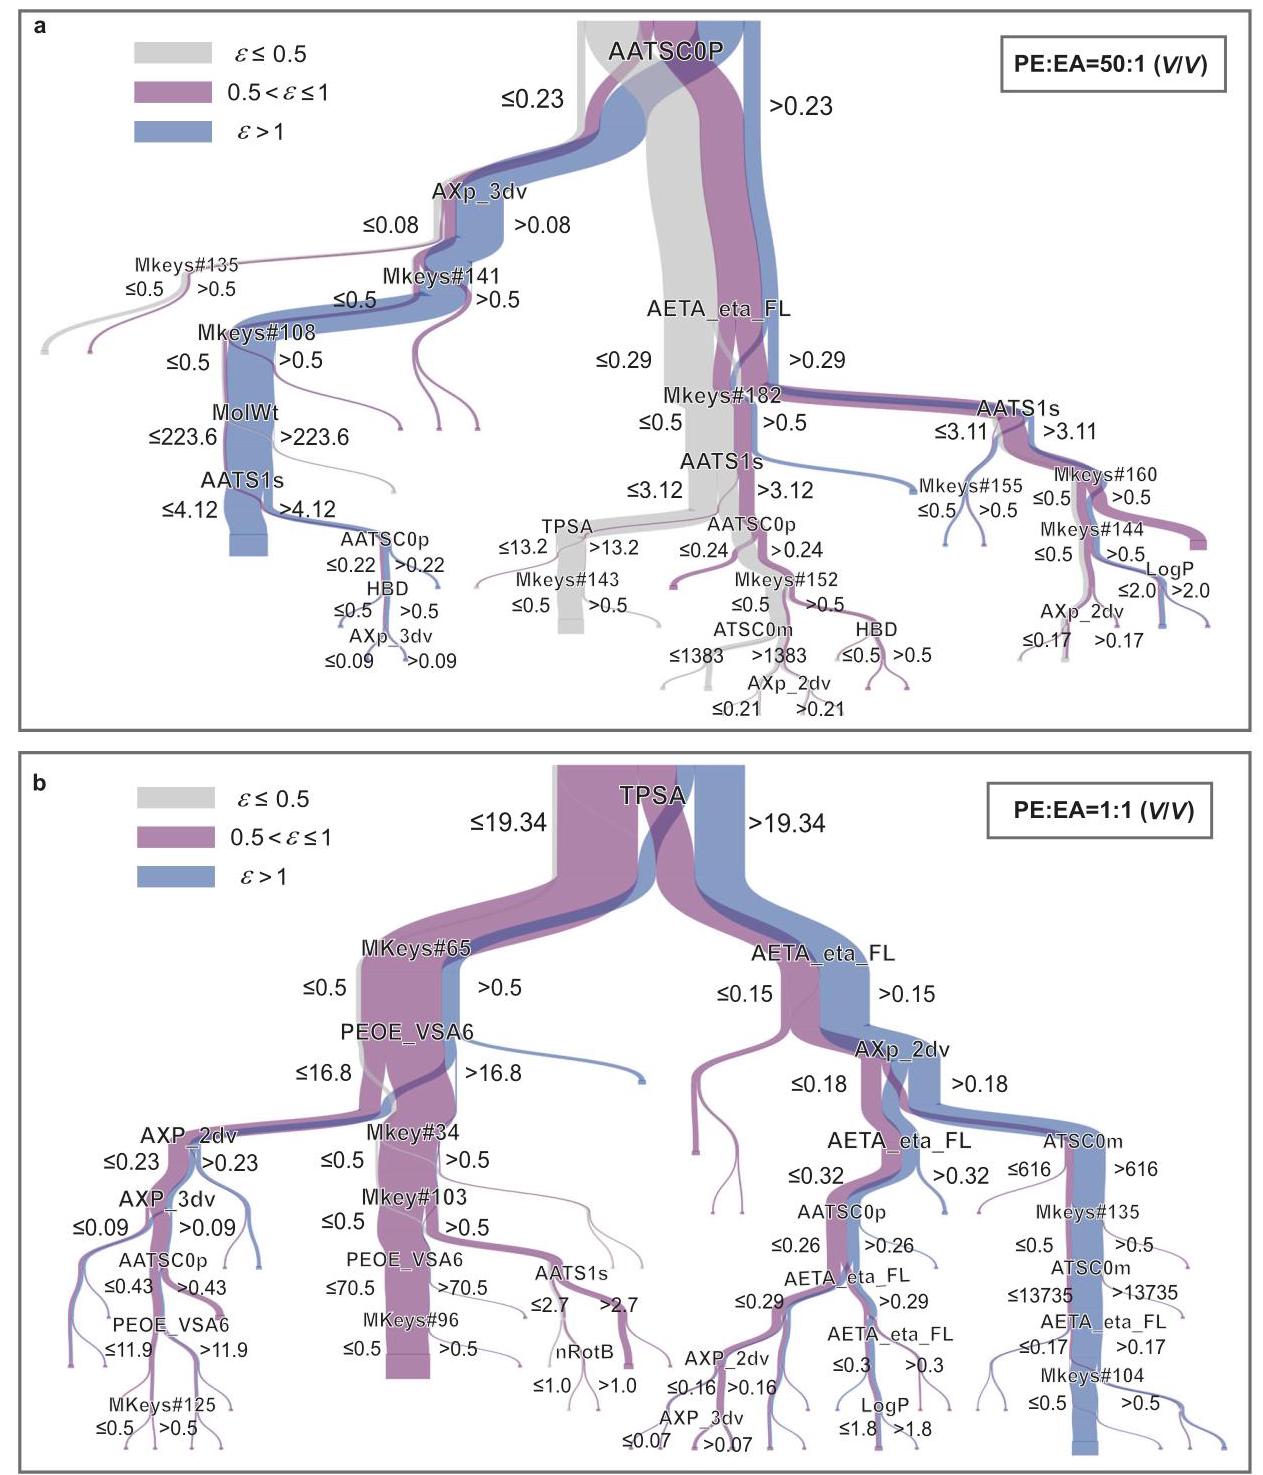
Fig. 4 | The adaptation of the model to diversified compounds. a Dendrograms of the visual regression tree of column chromatography ratios under PE:EA = 50:1 (V/V). b Dendrograms for the visual regression tree of column chromatography ratios under PE:EA = 1:1 (V/V). Here, PE refers to petroleum ether and EA refers to ethyl acetate. $\varepsilon$ is the column chromatography ratio. The symbols in the dendro-gram are explicitly defined in Table S1.
图4 | 模型对多种化合物的适应性。a 在石油醚(PE):乙酸乙酯(EA)= 50:1(V/V)条件下柱色谱比率的可视化回归树的树状图。b 在PE:EA = 1:1(V/V)条件下柱色谱比率的可视化回归树的树状图。此处,PE指石油醚,EA指乙酸乙酯。$\varepsilon$是柱色谱比率。树状图中的符号在表S1中明确给出。
Our work is an application of knowledge discovery in experimental chemistry. Prior efforts in knowledge discovery have focused mainly on unearthing complex partial differential equations in the realm of physics ${}^{{22} - {24}}$ , which involves fewer variables that embody intricate interrelations, and often expressed through differential and integral forms. In contrast, a unique challenge arises in the realm of chemistry in which molecular complexity involves a vast array of variables. Each variable has a simpler relationship with the outcomes, but the overall complexity is derived from their collective interactions. Directly applying traditional knowledge discovery approaches in this context is impractical. In our study, we utilized the inherent correlation between TLC and CC outcomes, employing ${R}_{F}$ values as pivotal variables to uncover statistical equations, which effectively bypasses the challenges posed by molecular complexity. Notably, the knowledge discovery technique is not intended to replace the mechanism model but rather to complement it. Their common goal is to obtain an explicit equation to describe chemical phenomena.
我们的工作是知识发现在实验化学中的应用。先前的知识发现工作主要集中在挖掘物理领域中的复杂偏微分方程${}^{{22} - {24}}$,该领域涉及较少体现复杂相互关系的变量,并且通常通过微分和积分形式表示。相比之下,化学领域存在独特的挑战,其中分子复杂性涉及大量变量。每个变量与结果的关系较为简单,但整体复杂性源于它们的集体相互作用。在这种情况下直接应用传统知识发现方法是不切实际的。在我们的研究中,我们利用了TLC和CC结果之间的内在相关性,将${R}_{F}$值用作关键变量来发现统计方程,从而有效绕过了分子复杂性带来的挑战。值得注意的是,知识发现技术并非旨在取代机理模型,而是对其进行补充。它们的共同目标是获得一个明确的方程来描述化学现象。
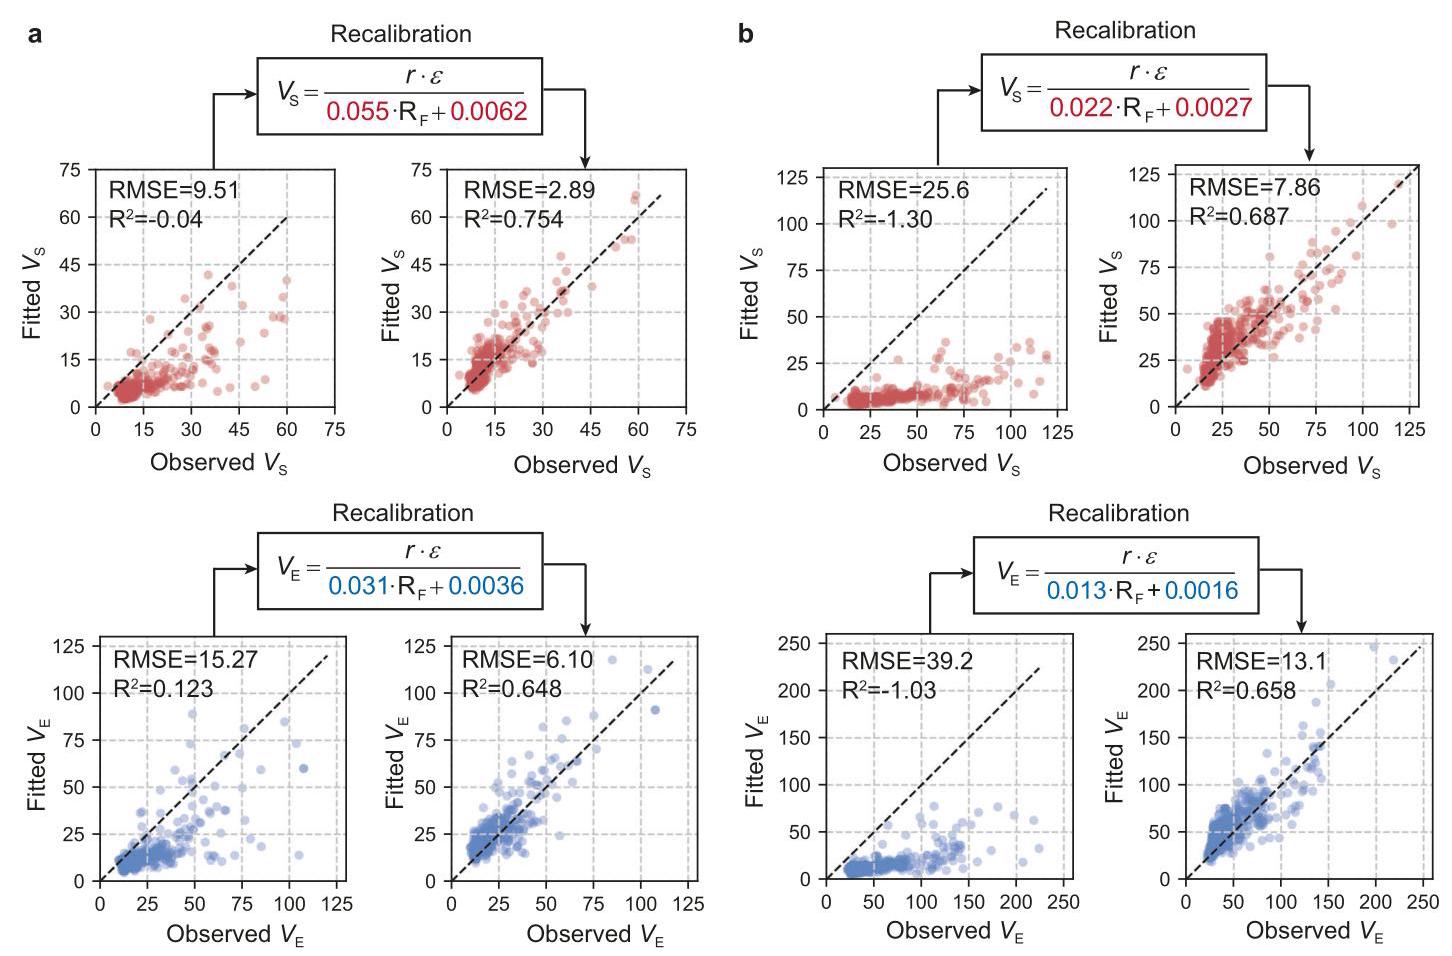
Fig. 5 | The adaptation of the model to diverse column specifications. a The fitted and observed retention volume obtained by directly utilizing discovered equations from the $4\mathrm{\;g}$ column (left), and the equations fitted by nonlinear regression and their predictive performance for the extrapolation of the tandem 4 g column (right). b The fitted and observed retention volume obtained by directly utilizing discovered equations from the $4\mathrm{\;g}$ column (left), and the equations fitted by nonlinear regression and their predictive performance for the extrapolation of the ${25}\mathrm{\;g}$ column (right). Here, $r$ is the proportion of PE in the eluent, $\varepsilon$ is the column chromatography ratio. RMSE and ${\mathrm{R}}^{2}$ refer to the root mean squared error and coefficient of determination, respectively. ${V}_{\mathrm{S}}$ and ${V}_{\mathrm{E}}$ refer to the retention volume at starting point and retention volume at ending point. Source data are provided as a Source Data file.
图5 | 模型对不同柱规格的适应性。a 直接利用$4\mathrm{\;g}$柱中发现的方程获得的拟合保留体积和观察到的保留体积(左),以及通过非线性回归拟合的方程及其对串联4 g柱外推的预测性能(右)。b 直接利用$4\mathrm{\;g}$柱中发现的方程获得的拟合保留体积和观察到的保留体积(左),以及通过非线性回归拟合的方程及其对${25}\mathrm{\;g}$柱外推的预测性能(右)。此处,$r$是洗脱液中石油醚的比例,$\varepsilon$是柱色谱比率。RMSE和${\mathrm{R}}^{2}$分别指均方根误差和决定系数。${V}_{\mathrm{S}}$和${V}_{\mathrm{E}}$分别指起始点的保留体积和终点的保留体积。源数据作为源数据文件提供。
In the domain of cheminformatics, deep learning techniques have been prevalently applied for molecular property prediction, achieving notable successes ${}^{{11} - {14},{25}}$ . However, these models often suffer from a lack of interpretability, which hinders a deeper understanding of chemical phenomena, and limits their utility in specific scenarios. Thus, the interpretable modeling approach introduced in our research represents a notable advancement. We managed to extract explicit equations from the experimental data to construct an interpretable model. While there are concessions in precision, it can enhance our comprehension of the relationship between TLC and CC, making it more applicable in experimental contexts. Specifically, the constructed TLC and CC surrogate models can provide accurate predictions of the ${R}_{F}$ values and retention times, which can guide the experiments. Moreover, the discovered “AI experience” provides explicit equations to bridge TLC and CC, which can facilitate chromatographic separation. Furthermore, considering that there are a variety of empirical formulas and chemical expertise in the field of chemistry, where it is difficult to model potential cross-scale relationships through theoretical deduction. Therefore, our method is promising for discovering more “AI experience” in diverse problems.
在化学信息学领域,深度学习技术已被广泛应用于分子性质预测,并取得了显著成功${}^{{11} - {14},{25}}$。然而,这些模型往往缺乏可解释性,这阻碍了对化学现象的深入理解,并限制了它们在特定场景中的效用。因此,我们研究中引入的可解释建模方法代表了一项显著的进步。我们设法从实验数据中提取显式方程,以构建一个可解释的模型。虽然在精度上有所让步,但它可以增强我们对薄层色谱(TLC)和柱色谱(CC)之间关系的理解,使其在实验环境中更适用。具体而言,构建的TLC和CC替代模型可以提供对${R}_{F}$值和保留时间的准确预测,这可以指导实验。此外,发现的“人工智能经验”提供了连接TLC和CC的显式方程,这可以促进色谱分离。此外,考虑到化学领域存在各种经验公式和化学专业知识,很难通过理论推导对潜在的跨尺度关系进行建模。因此,我们的方法有望在各种问题中发现更多的“人工智能经验”。
Nevertheless, several aspects of this research warrant further enhancement. First, owing to the time-intensive nature of chromatographic processes, we developed an automated platform for data collection to minimize the involvement of human resources and maximize efficiency. However, the dataset size, especially for larger columns, is still limited due to time and resource constraints. Moreover, despite our efforts to encompass a diverse range of compounds, the selection of 192 compounds in CC does not cover the extensive spectrum of chemical compounds available. A more diverse dataset would be useful in refining the precision of our interpretable model. Despite these limitations, our research provides invaluable insights into the field of chromatography. We anticipate that this framework will generate a more reliable “AI experience” to facilitate studies of nature and science.
然而,本研究的几个方面仍需进一步改进。首先,由于色谱过程耗时较长,我们开发了一个数据收集自动化平台,以尽量减少人力资源的参与并最大化效率。然而,由于时间和资源限制,数据集的大小,特别是对于较大的色谱柱,仍然有限。此外,尽管我们努力涵盖各种化合物,但柱色谱中选择的192种化合物并未涵盖所有可用的广泛化合物谱。更多样化的数据集将有助于提高我们可解释模型的精度。尽管存在这些限制,我们的研究为色谱领域提供了宝贵的见解。我们预计这个框架将产生更可靠的“人工智能经验”,以促进对自然和科学的研究。
Methods
方法
Automatic column chromatographic platform
自动柱色谱平台
In this work, an automated CC platform is developed to measure the retention volumes of different compounds under various experimental conditions to construct a CC dataset. The developed automated CC platform offers greater flexibility and comprehensive automation, enabling fully automated CC analysis and significantly enhancing data collection efficiency.
在本工作中,开发了一个自动柱色谱平台,用于测量不同化合物在各种实验条件下的保留体积,以构建柱色谱数据集。所开发的自动柱色谱平台具有更高的灵活性和全面的自动化功能,能够实现完全自动化的柱色谱分析,并显著提高数据收集效率。
As shown in Fig. S2, the automated sample loader is one of the core components facilitating the automation process. For the whole automated process, prepared samples are dissolved in the loading solvent, while the eluent is configured onsite through an infusion pump according to a preset ratio. The mixtures of standard solutions are then injected into the column via the automated sample loader, and the eluent is pumped into the column at a predetermined flow rate to perform CC. The detector continuously monitors the absorbance, and terminates the experiment automatically once the solute is fully collected.
如图S2所示,自动进样器是促进自动化过程的核心组件之一。对于整个自动化过程,制备好的样品溶解在进样溶剂中,而洗脱液则根据预设比例通过输液泵在现场配置。然后,标准溶液的混合物通过自动进样器注入柱中,洗脱液以预定流速泵入柱中以进行柱色谱分析。检测器持续监测吸光度,一旦溶质完全收集,实验自动终止。
The automatic CC system consists of two precision medium-speed infusion pumps equipped with a syringe-based solution mixer and an ultraviolet (UV) detector (Fig. S2). All the devices are connected by tubing. The prepared mixtures of standard solutions are placed in the syringe sample tray. They are then loaded via a syringe needle and transported to the chromatography column under pump pressure. The two pumps deliver the corresponding eluents at set flow rates, which are mixed in the solution mixer. The standard solutions are then eluted and separated, and the UV signal of the effluent solution during the elution process is recorded by a UV detector. In the auto CC system, the start time $\left( {t}_{\mathrm{S}}\right)$ and end time $\left( {t}_{\mathrm{E}}\right)$ of the sample separation are automatically calculated on the basis of recorded raw data via recognition algorithms. After each experiment, the automated platform proceeds to clean the column, and initiates the next experiment automatically under different conditions.
自动柱色谱系统由两个配备基于注射器的溶液混合器和紫外(UV)检测器的精密中速输液泵组成(图S2)。所有设备通过管道连接。制备好的标准溶液混合物放置在注射器样品盘中。然后通过注射器针头加载,并在泵压下输送到色谱柱。两个泵以设定流速输送相应的洗脱液,它们在溶液混合器中混合。然后标准溶液被洗脱和分离,洗脱过程中流出溶液的紫外信号由紫外检测器记录。在自动柱色谱系统中,样品分离的开始时间$\left( {t}_{\mathrm{S}}\right)$和结束时间$\left( {t}_{\mathrm{E}}\right)$根据记录的原始数据通过识别算法自动计算。每次实验后,自动化平台会对柱进行清洗,并在不同条件下自动启动下一次实验。
For each compound, eight experiments are conducted using different eluent ratios, namely, PE:EA = 1:0, 100:1, 50:1, 10:1, 5:1, 2:1, 1:1, and 0:1 (V/V), yielding eight sets of data from the UV detector. To calculate the target data, the raw data are first converted into the corresponding absorbance values by translating the complete 16-byte commands. The start and end times are then determined on the basis of the magnitude of the absorbance. At the end of each test, the eluent ratio is changed and maintained for approximately 30 s. Subsequently, the syringe automatically cleans the needle before proceeding to the next sample. To eliminate the influence of stray peaks, we analyse the data using a specific window width equivalent to ${20}\mathrm{\;s}$ . The calculated retention time is multiplied by the flow rate to obtain the retention volumes ${V}_{\mathrm{S}}$ and ${V}_{\mathrm{E}}$ , respectively.
对于每种化合物,使用不同的洗脱液比例进行八次实验,即PE:EA = 1:0、100:1、50:1、10:1、5:1、2:1、1:1和0:1(V/V),从紫外检测器获得八组数据。为了计算目标数据,首先通过转换完整的16字节命令将原始数据转换为相应的吸光度值。然后根据吸光度的大小确定开始和结束时间。在每次测试结束时,改变洗脱液比例并保持约30秒。随后,注射器在进行下一个样品之前自动清洗针头。为了消除杂峰的影响,我们使用相当于${20}\mathrm{\;s}$的特定窗口宽度分析数据。计算得到的保留时间乘以流速分别得到保留体积${V}_{\mathrm{S}}$和${V}_{\mathrm{E}}$。
For TLC, the silica gel plate from the Yinlong brand is utilized, and the stationary phase is standard silicone with an average particle size of ${40\mu }\mathrm{m}$ . For CC, the column from the Agela brand is utilized, and the stationary phase is also standard silicone with an average particle size of ${40\mu }\mathrm{m}$ . In the TLC automated platform, the whole process is accomplished by a collaborative robot to guarantee the precision of the measured ${\mathrm{R}}_{\mathrm{F}}$ values. The developing is conducted in a square flatbottom developing chamber, and the developing time is 300 s. Specifically, the robot can finely control the spotting procedure, which makes the spot as little dispersive as possible. Moreover, the developed TLC plate is photographed, and a computer vision algorithm is adopted to identify the geometry center and calculate the ${R}_{F}$ values. To guarantee the quality of the data, human verification is adopted to calibrate TLC plates that are incorrectly identified by the computer. For more details of the automated TLC platform, refer to the protocol ${}^{18}$ .
对于薄层色谱,使用银龙品牌的硅胶板,固定相是平均粒径为${40\mu }\mathrm{m}$的标准硅胶。对于柱色谱,使用安捷伦品牌的柱,固定相也是平均粒径为${40\mu }\mathrm{m}$的标准硅胶。在薄层色谱自动化平台中,整个过程由协作机器人完成,以保证测量的${\mathrm{R}}_{\mathrm{F}}$值的精度。展开在方形平底展开室中进行,展开时间为300秒。具体而言,机器人可以精确控制点样过程,使斑点尽可能少分散。此外,对展开后的薄层色谱板进行拍照,并采用计算机视觉算法识别几何中心并计算${R}_{F}$值。为了保证数据质量,采用人工验证来校准计算机错误识别的薄层色谱板。有关薄层色谱自动化平台的更多详细信息,请参考协议${}^{18}$。
Surrogate model construction
替代模型构建
In this work, two fully connected artificial neural networks are utilized to construct surrogate models to fit the TLC and CC datasets and generate model predictions. For model construction, characterization of the compounds and experimental settings is crucial. The compounds are represented by the Molecular Access System (MACCS) keys with 167 dimensions, where each dimension is a binary code that denotes the existence of certain substructures and properties. In addition to the molecular fingerprint, molecular descriptors are also employed to describe the overall properties of the compounds. In this work, 16 molecular descriptors are selected from thousands of candidate descriptors according to the correlation coefficients. For the mobile phase, which is composed of PE and EA, the averaged descriptor of the mobile phase is utilized. Here, the molecular weight (MW_e), topological polar surface area (TPSA_e), number of rotatable bonds (NRotB_e), number of hydrogen bond donors (HBD_e), number of hydrogen bond acceptors (HBA_e), and lipid-water partition coefficient (LogP_e) of the PE and EA are weighted averaged based on the proportions used to obtain the descriptors of the mobile phase, as illustrated in Fig. S7. The abbreviations and meanings of the descriptors are provided in detail in Table S1. Therefore, for the surrogate model of TLC, the input is the combination of molecular fingerprints and descriptors with 189 dimensions, and the output is the ${R}_{F}$ value. For the surrogate model of CC, the input is similar to that of TLC, but the experimental conditions, including the sample mass, sample solvent type, and solvent volume, are incorporated into the input vector, which has 192 dimensions. The output is the retention volume ${V}_{\mathrm{S}}$ and ${V}_{\mathrm{E}}$ . Both neural networks have five layers, including an input layer, three hidden layers, and an output layer. Considering that the ${\mathrm{R}}_{\mathrm{F}}$ value is between 0 and 1, an additional Sigmoid layer is employed in the TLC surrogate model to guarantee that the output conforms to the range. The activation function is LeakyReLU. The datasets are partitioned into 80% for training, 10% for validation, and 10% for testing. The number of training epochs is 10,000. To prevent overfitting, early stopping strategies were employed on the basis of the validating error. To facilitate training, the input vector is standardized via max-min standardization.
在本工作中,利用两个全连接人工神经网络构建替代模型,以拟合薄层色谱(TLC)和柱色谱(CC)数据集并生成模型预测。对于模型构建,化合物的表征和实验设置至关重要。化合物由具有167维的分子访问系统(MACCS)键表示,其中每个维度是一个二进制代码,表示某些子结构和性质的存在。除了分子指纹外,还使用分子描述符来描述化合物的整体性质。在本工作中,根据相关系数从数千个候选描述符中选择了16个分子描述符。对于由石油醚(PE)和乙酸乙酯(EA)组成的流动相,使用流动相的平均描述符。此处,基于用于获得流动相描述符的比例,对PE和EA的分子量(MW_e)、拓扑极性表面积(TPSA_e)、可旋转键数(NRotB_e)、氢键供体数(HBD_e)、氢键受体数(HBA_e)和脂水分配系数(LogP_e)进行加权平均,如图S7所示。描述符的缩写和含义在表S1中详细给出。因此,对于TLC的替代模型,输入是具有189维的分子指纹和描述符的组合,输出是${R}_{F}$值。对于CC的替代模型,输入与TLC相似,但实验条件,包括样品质量、样品溶剂类型和溶剂量,被纳入输入向量,该向量具有192维。输出是保留体积${V}_{\mathrm{S}}$和${V}_{\mathrm{E}}$。两个神经网络都有五层,包括一个输入层、三个隐藏层和一个输出层。考虑到${\mathrm{R}}_{\mathrm{F}}$值在0到1之间,在TLC替代模型中采用了一个额外的Sigmoid层,以确保输出符合该范围。激活函数是LeakyReLU。数据集被划分为80%用于训练,10%用于验证,10%用于测试。训练轮数为10000。为了防止过拟合,基于验证误差采用了早期停止策略。为了便于训练,通过最大-最小标准化对输入向量进行标准化。
In this research, the generation of model predictions serves as a methodological approach to simulate unobserved experiments, thereby bridging the inconsistency between the TLC and CC datasets. Specifically, each data point in the CC dataset refers to a specific experimental scenario involving a target compound under predefined conditions. Considering that a critical factor influencing the separation efficacy of CC is the proportion of solvents in the mobile phase, the generation of model predictions focuses on different solvent ratios, including PE:EA = 1:0, 100:1, 50:1, 10:1, 5:1, 2:1, 1:1, and 0:1 (V/V). For each molecule, while keeping the other experimental conditions unchanged, only the solvent ratio is changed to generate different conditions, which are then input into the CC surrogate model to obtain the predicted retention volumes. Notably, the experimental data for these solvent ratios might not exist in the CC dataset, implying that the study effectively simulates and predicts experimental outcomes under these conditions. Therefore, predictions are also made for the same compounds and solvent ratios in the TLC dataset to generate TLC model predictions.
在本研究中,模型预测的生成作为一种方法来模拟未观察到的实验,从而弥合TLC和CC数据集之间的不一致。具体而言,CC数据集中的每个数据点都指的是在预定义条件下涉及目标化合物的特定实验场景。考虑到影响CC分离效果的一个关键因素是流动相中溶剂的比例,模型预测的生成侧重于不同的溶剂比例,包括PE:EA = 1:0、100:1、50:1、10:1、5:1、2:1、1:1和0:1(V/V)。对于每个分子,在保持其他实验条件不变的情况下,仅改变溶剂比例以生成不同的条件,然后将这些条件输入到CC替代模型中以获得预测的保留体积。值得注意的是,这些溶剂比例的实验数据可能在CC数据集中不存在,这意味着该研究有效地模拟和预测了这些条件下的实验结果。因此,也对TLC数据集中相同的化合物和溶剂比例进行预测,以生成TLC模型预测。
The generation of model predictions from both TLC and CC surrogate models enables the simultaneous prediction of ${\mathrm{R}}_{\mathrm{F}}$ values and retention volumes for the compounds studied under a spectrum of solvent ratios, which is challenging to obtain directly from the datasets. Therefore, this model prediction generation approach is instrumental in laying the groundwork for subsequent knowledge discovery and analysis. In quantitative terms, 4680 model predictions are generated, including 585 experimental conditions evaluated across 8 solvent ratios.
TLC和CC替代模型的模型预测生成能够同时预测一系列溶剂比例下所研究化合物的${\mathrm{R}}_{\mathrm{F}}$值和保留体积,而这些直接从数据集中难以获得。因此,这种模型预测生成方法有助于为后续的知识发现和分析奠定基础。从数量上来说,生成了4680个模型预测,包括在8种溶剂比例下评估的585个实验条件。
Symbolic regression
符号回归
In this work, the statistical analysis of the generated model predictions reveals a discernible pattern correlating the retention volume, the ${\mathrm{R}}_{\mathrm{F}}$ value, and the ratio of the developing agent. These observed relationships align with the established knowledge in the field of chemistry, yet defined mathematical expressions are lacking to characterize these interdependencies succinctly. Consequently, this study employs symbolic regression as a methodological tool for knowledge discovery, aiming to unearth the most fitting explicit mathematical formulations that captures the essence of these relationships. Symbolic regression integrates a genetic programming algorithm with advanced optimization techniques, ensuring both efficiency and robustness in knowledge discovery. The genetic programming process simulates biological evolution to iteratively evolve mathematical expressions, optimizing their fit to the data. This process begins with a diverse set of random expressions described by symbolic trees, which undergo continuous evolution through operations such as crossover and mutation. Regularization is adopted to balance the exploration of new solutions with the refinement of the existing ones, thus preventing the algorithm from stagnating in a local optima. In this work, symbolic regression is implemented via the Python package PySR. This tool is simple and user friendly, and ideal for chemical issues with numerous variables, but it is less effective with complex equations. For problems involving partial differential equations, methods such as DLGA or DISCOVER are recommended ${}^{{24},{26}}$ .
在这项工作中,对生成的模型预测进行统计分析后发现了一种可识别的模式,该模式将保留体积、${\mathrm{R}}_{\mathrm{F}}$值和展开剂的比例联系起来。这些观察到的关系与化学领域的现有知识相符,但缺乏简洁描述这些相互依存关系的明确数学表达式。因此,本研究采用符号回归作为知识发现的方法工具,旨在挖掘最适合的明确数学公式,以捕捉这些关系的本质。符号回归将遗传编程算法与先进的优化技术相结合,确保在知识发现中兼具效率和稳健性。遗传编程过程模拟生物进化,以迭代方式演化数学表达式,优化它们与数据的拟合度。这个过程从一组由符号树描述的各种随机表达式开始,通过交叉和变异等操作不断进化。采用正则化来平衡对新解决方案的探索和对现有解决方案的优化,从而防止算法陷入局部最优。在这项工作中,通过Python包PySR实现符号回归。这个工具简单易用,对于具有众多变量的化学问题非常理想,但对于复杂方程效果较差。对于涉及偏微分方程的问题,建议使用DLGA或DISCOVER等方法${}^{{24},{26}}$。
Visual regression trees
可视化回归树
In this work, statistically explicit expressions were identified to characterize the relationship between the TLC and CC. Evidently, for each specific compound, the corresponding retention volume of CC will be influenced even if the ${\mathrm{R}}_{\mathrm{F}}$ value is identical. This influence stems mainly from the structure and properties of the molecule. Therefore, we define a CC ratio under a given mobile phase proportion to represent this influence. In this work, molecular fingerprints and descriptors, which are high-dimensional features, are used to express the structure and properties of the compounds. As such, it is difficult to directly observe the relationship between the CC ratio and these features, or find an explicit expression. To further explore this potential relationship, we employed a visual regression tree approach to provide an explicit explanation. Given the binary nature of molecular fingerprints, their impact on the CC ratio is well-suited for expression in a binary tree format. Here, a binary regression tree with a maximum depth of 9 layers is used to fit the CC ratio, with the input being the molecular fingerprints and descriptors of each molecule, and the output being the CC ratio. Notably, by limiting the maximum depth, the complexity of the binary regression tree is constrained, ensuring the interpretability of the model. Since the CC ratio is assumed to be solely related to molecular properties, data from both ${V}_{\mathrm{S}}$ and ${V}_{\mathrm{E}}$ can be combined when training the regression tree. For each solvent ratio, a binary regression tree can be trained, with all the trees for the commonly used solvent ratios forming a forest. The trained regression trees are represented using visualized tree root graphs, with more important conditions located closer to the roots. Visualization can enhance the interpretability and understanding of the model, allowing for intuitive insights into how molecular structures and properties affect the CC ratio and subsequently impact the chromatographic results. In addition to its explanatory capabilities, the regression tree model can also be used for prediction. Given a specific compound and solvent ratio, the CC ratio can be directly predicted using this model, allowing for rapid calculation of its precise retention volume via the formula.
在这项工作中,我们确定了具有统计意义的明确表达式来表征薄层色谱(TLC)和柱色谱(CC)之间的关系。显然,对于每种特定化合物,即使${\mathrm{R}}_{\mathrm{F}}$值相同,相应的柱色谱保留体积也会受到影响。这种影响主要源于分子的结构和性质。因此,我们定义了在给定流动相比例下的柱色谱比率来表示这种影响。在这项工作中,分子指纹和描述符作为高维特征,被用于表达化合物的结构和性质。然而,很难直接观察柱色谱比率与这些特征之间的关系,或者找到一个明确的表达式。为了进一步探索这种潜在关系,我们采用了可视化回归树方法来提供明确的解释。鉴于分子指纹的二元性质,它们对柱色谱比率的影响非常适合以二叉树格式表示。在这里,使用最大深度为9层的二元回归树来拟合柱色谱比率,输入是每个分子的分子指纹和描述符,输出是柱色谱比率。值得注意的是,通过限制最大深度,二元回归树的复杂性受到约束,确保了模型的可解释性。由于假定柱色谱比率仅与分子性质相关,因此在训练回归树时可以合并来自${V}_{\mathrm{S}}$和${V}_{\mathrm{E}}$的数据。对于每种溶剂比例,可以训练一个二元回归树,所有常用溶剂比例的树构成一个森林。训练好的回归树用可视化的树根图表示,更重要的条件位于更靠近根部的位置。可视化可以增强模型的可解释性和理解,使人们能够直观地了解分子结构和性质如何影响柱色谱比率,进而影响色谱结果。除了解释能力外,回归树模型还可用于预测。给定一种特定化合物和溶剂比例,可以使用该模型直接预测柱色谱比率,从而通过公式快速计算其精确的保留体积。
Extrapolation to other column specifications
外推至其他柱规格
In this work, the relationship between TLC and CC is discovered within the experimental dataset from a $4\mathrm{\;g}$ column, which is expressed by Eqs. (1) and (2). Importantly, these equations can be generalized to other column types. Given that the underlying chromatographic principles remain consistent across different columns, the forms of Eqs. (1) and (2) can still be adopted. Additionally, it is assumed that the CC ratio does not vary with column type. Therefore, the task of generalization to other column types can be reformulated as a coefficient regression problem, which can be described as:
在本研究中,TLC与CC之间的关系是在来自$4\mathrm{\;g}$柱的实验数据集中发现的,由式(1)和式(2)表示。重要的是,这些方程可以推广到其他柱类型。鉴于不同柱的基本色谱原理保持一致,式(1)和式(2)的形式仍然可以采用。此外,假设CC比率不随柱类型而变化。因此,推广到其他柱类型的任务可以重新表述为系数回归问题,可描述为:
$$ {\bar{V}}_{S} = \left\{ \begin{array}{l} \frac{r}{{a}_{1} \cdot {\mathrm{R}}_{\mathrm{F}} + {b}_{1}}, r > 0 \\ {c}_{1}, r = 0 \end{array}\right. \tag{7} $$$$ {\bar{V}}_{E} = \left\{ {\begin{array}{l} \frac{r}{{a}_{2} \cdot {\mathrm{R}}_{\mathrm{F}} + {b}_{2}} \\ {c}_{2}, r = 0 \end{array}, r > 0}\right. \tag{8} $$$$ {V}_{S} = {\bar{V}}_{S} \cdot \varepsilon = \left\{ \begin{array}{l} \frac{r \cdot \varepsilon }{{a}_{1} \cdot {\mathrm{R}}_{\mathrm{F}} + {b}_{1}}, r > 0 \\ {c}_{1} \cdot \varepsilon , r = 0 \end{array}\right. \tag{9} $$$$ {V}_{E} = {\bar{V}}_{E} \cdot \varepsilon = \left\{ {\begin{array}{l} \frac{r \cdot \varepsilon }{{a}_{2} \cdot {\mathrm{R}}_{\mathrm{F}} + {b}_{2}} \\ {c}_{2} \cdot \varepsilon , r = 0 \end{array}, r > 0}\right. \tag{10} $$where ${a}_{1},{b}_{1},{c}_{1},{a}_{2},{b}_{2}$ , and ${c}_{2}$ are the coefficients that need to be determined through the regression. In this study, we examined the use of tandem $4\mathrm{\;g}$ and ${25}\mathrm{\;g}$ columns. By leveraging the datasets collected from these columns, we perform nonlinear regressions on Eqs. (9) and (10) to calculate the coefficients for generalization. This approach circumvents the need for a fine-tuning of the models, which is typically required in traditional transfer learning methods, and instead necessitates only a small amount of data for simple regression. This not only highlights the advantages of explicit equations but also demonstrates the reliability of the equation forms identified in this paper.
其中${a}_{1},{b}_{1},{c}_{1},{a}_{2},{b}_{2}$和${c}_{2}$是需要通过回归确定的系数。在本研究中,我们研究了串联$4\mathrm{\;g}$和${25}\mathrm{\;g}$柱的使用。通过利用从这些柱收集的数据集,我们对式(9)和式(10)进行非线性回归以计算推广系数。这种方法避免了传统迁移学习方法中通常需要的模型微调,只需要少量数据进行简单回归。这不仅突出了显式方程的优势,也证明了本文确定的方程形式的可靠性。
Reporting summary
报告总结
Further information on research design is available in the Nature Portfolio Reporting Summary linked to this article.
有关研究设计的更多信息,请参阅与本文相关的《自然》系列报告总结。
Data availability
数据可用性
The dataset generated in this study has been deposited in the GitHub repository, https://github.com/woshixuhao/Discovery_of_column_ chromatography/tree/main/data. Source data are provided with this paper.
本研究中生成的数据集已存于GitHub仓库,https://github.com/woshixuhao/Discovery_of_column_ chromatography/tree/main/data。源数据随本文提供。
Code availability
代码可用性
All the original code has been deposited at the website https://github.com/woshixuhao/Discovery_of_column_chromatography/tree/main/ data. The version of the record of the GitHub repo is doi:10.5281/ zenodo.7623903 ${}^{27}$ . The reproducible codes have been provided at the website https://bohrium.dp.tech/notebooks/86427319178.The codes in both repositories are the same, while the codes on Bohrium can run online for reproducibility. The license for all repositories is Apache-2.0 license.
所有原始代码已存放在网站https://github.com/woshixuhao/Discovery_of_column_chromatography/tree/main/ data 。GitHub仓库记录的版本是doi:10.5281/ zenodo.7623903 ${}^{27}$ 。可重现代码已在网站https://bohrium.dp.tech/notebooks/86427319178提供。两个仓库中的代码相同,而Bohrium上的代码可以在线运行以实现可重复性。所有仓库的许可协议是Apache-2.0许可。
References
参考文献
Still, W. C., Kahn, M. & Mitra, A. Rapid chromatographic technique for preparative separations with moderate resolution. J. Org. Chem. 43, 2923-2925 (1978).
Kondeti, R. R., Mulpuri, K. S. & Meruga, B. Advancements in column chromatography: A review. World J. Pharm. Sci. 2, 1375-1383 (2014).
Sasidharan, S., Chen, Y., Saravanan, D., Sundram, K. M. & Latha, L. Y. Extraction, isolation and characterization of bioactive compounds from plants’ extracts. Afr. J. Tradit. Complement. Alternat. Med. 8, 1-10 (2011).
Zhang, Q. W., Lin, L. G. & Ye, W. C. Techniques for extraction and isolation of natural products: A comprehensive review. Chin. Med 13, 1-26 (2018).
Shekhawat, L. K. & Rathore, A. S. An overview of mechanistic modeling of liquid chromatography. Preparative Biochem. Bio-technol. 49, 623-638 (2019).
Michel, M., Epping, A., Jupke A. Modelling and determination of model parameters In Preparative Chromatography: Of Fine Chemicals and Pharmaceutical Agents. Eds. Schmidt-Traub H., Schulte ML, and Seidel-Morgenstern A. Weinheim: Wiley, 2005, 215-312.
Püttmann, A., Schnittert, S., Naumann, U. & von Lieres, E. Fast and accurate parameter sensitivities for the general rate model of column liquid chromatography. Comput Chem. Eng. 56, 46-57 (2013).
Brooks, C. A. & Cramer, S. M. Steric mass-action ion exchange: Displacement profiles and induced salt gradients. AIChE J. 38, 1969-1978 (1992).
Article
文章
Osberghaus, A. et al. Determination of parameters for the steric mass action model-A comparison between two approaches. J. Chromatogr. A 1233, 54-65 (2012).
Artrith, N. et al. Best practices in machine learning for chemistry. Nat. Chem. 13, 505-508 (2021).
Usman, A. G., Isik, S. & Abba, S. I. A novel multi-model data-driven ensemble technique for the prediction of retention factor in HPLC method development. Chromatographia 83, 933-945 (2020).
Osipenko, S. et al. Machine learning to predict retention time of small molecules in nano-HPLC. Anal. Bioanal. Chem. 412, 7767-7776 (2020).
Domingo-Almenara, X. et al. The METLIN small molecule dataset for machine learning-based retention time prediction. Nat. Commun. 10, 1-9 (2019).
Low, D. Y. et al. Data sharing in PredRet for accurate prediction of retention time: Application to plant food bioactive compounds. Food Chem. 357, 129757 (2021).
Singh, Y. R. et al. Current trends in chromatographic prediction using artificial intelligence and machine learning. Anal. Methods 15, 2785-2797 (2023).
Singh, Y. R., Shah, D. B., Maheshwari, D. G., Shah, J. S. & Shah, S. Advances in AI-Driven retention prediction for different chromatographic techniques: unraveling the complexity. Crit. Rev. Anal. Chem. 1, 11 (2023).
Guidotti, R. et al. A survey of methods for explaining black box models. ACM Comput Surv. 51, 1-42 (2018).
Xu, H., Zhang, D. & Mo, F. High-throughput automated platform for thin layer chromatography analysis. STAR Protoc. 3, 101893 (2022).
Xu, H. et al High-throughput discovery of chemical structure-polarity relationships combining automation and machine-learning techniques. Chem 1-13 https://doi.org/10.1016/j.chempr.2022.08.008 (2022).
Cranmer, M. Interpretable machine learning for science with PySR and SymbolicRegression. jl. arXiv preprint arXiv:2305.01582 (2023).
Parinet, J. Predicting reversed-phase liquid chromatographic retention times of pesticides by deep neural networks. Heliyon 7, (2021).
Raissi, M., Yazdani, A. & Karniadakis, G. E. Hidden fluid mechanics: Learning velocity and pressure fields from flow visualizations. Science (1979) 367, 1026-1030 (2020).
Kaiser, E., Kutz, J. N. & Brunton, S. L. Sparse identification of nonlinear dynamics for model predictive control in the low-data limit. Proc. R. Soc. A: Math. Phys. Eng. Sci. 474, 1-25 (2018).
Xu, H., Chang, H. & Zhang, D. DLGA-PDE: Discovery of PDEs with incomplete candidate library via combination of deep learning and genetic algorithm. J. Comput Phys. 418, 109584 (2020).
Sun, L. et al. A simple method for HPLC retention time prediction: Linear calibration using two reference substances. Chin. Med. (U. Kingd.) 12, 1-12 (2017).
Du, M., Chen, Y. & Zhang, D. DISCOVER: Deep identification of symbolically concise open-form partial differential equations via enhanced reinforcement learning. Phys. Rev. Res. 6, 013182 (2024).
Xu, H., Wu, W., Chen, Y., Zhang, D., Mo, F. Discovering explicit relation between thin film chromatography and column chromatography from statistics and machine learning. Github, https://doi.org/10.5281/zenodo.7623903 (2024).
Acknowledgements
致谢
This work is supported by the Natural Science Foundation of China (Grant Nos. 22071004, 21933001, and 22150013, received by F. M., and 62106116, received by Y. C.), and China Postdoctoral Science Foundation (Grant No. 2024M761535, received by H. X.). F.M. thanks Peking University Shenzhen Graduate School and Shenzhen Government for the start-up funding support. We thank the High-Performance Computing Platform of Peking University and High Performance Computing Centers at Eastern Institute of Technology, Ningbo, and Ningbo Institute of Digital Twin for machine learning model training.
本工作得到中国国家自然科学基金(F. M. 获得的项目编号为22071004、21933001和22150013,Y. C. 获得的项目编号为62106116)以及中国博士后科学基金(H. X. 获得的项目编号为2024M761535)的支持。F.M. 感谢北京大学深圳研究生院和深圳市政府提供的启动资金支持。我们感谢北京大学高性能计算平台以及宁波东方理工大学和宁波数字孪生研究院的高性能计算中心用于机器学习模型训练。
Author contributions
作者贡献
W.W. and F.M. established the automated platform, W.W. conducted the experiments and collected the column chromatography dataset. H.X. analysed the data. H.X. performed the chemoinformatic and machine learning studies. H.X., D.Z., and F.M. wrote the manuscript. Y. C., D.Z. and F. M. revised the manuscript. F.M. conceived the idea and designed the overall research. F.M. and D.Z. supervised the entire project.
W.W.和F.M.建立了自动化平台,W.W.进行了实验并收集了柱色谱数据集。H.X.分析了数据。H.X.进行了化学信息学和机器学习研究。H.X.、D.Z.和F.M.撰写了手稿。Y.C.、D.Z.和F.M.对手稿进行了修订。F.M.构思了该想法并设计了整体研究。F.M.和D.Z.监督了整个项目。
Competing interests
利益冲突
The authors declare no competing interests.
作者声明无利益冲突。
Additional information
附加信息
Supplementary information The online version contains supplementary material available at https://doi.org/10.1038/s41467-025-56136-x.
补充信息 在线版本包含可在https://doi.org/10.1038/s41467-025-56136-x获取的补充材料。
Correspondence and requests for materials should be addressed to Dongxiao Zhang or Fanyang Mo.
有关通信和材料请求应寄给董晓张或莫凡洋。
Peer review information Nature Communications thanks Irena Vovk, and the other, anonymous, reviewer(s) for their contribution to the peer review of this work. A peer review file is available.
同行评审信息 《自然通讯》感谢伊雷娜·沃夫以及其他匿名审稿人对本工作同行评审的贡献。可获取一份同行评审文件。
Reprints and permissions information is available at http://www.nature.com/reprints
重印和许可信息可在http://www.nature.com/reprints获取。
Publisher’s note Springer Nature remains neutral with regard to jurisdictional claims in published maps and institutional affiliations.
出版商说明 施普林格·自然对于已发表地图中的管辖权主张和机构隶属关系保持中立。
Open Access This article is licensed under a Creative Commons Attribution-NonCommercial-NoDerivatives 4.0 International License, which permits any non-commercial use, sharing, distribution and reproduction in any medium or format, as long as you give appropriate credit to the original author(s) and the source, provide a link to the Creative Commons licence, and indicate if you modified the licensed material. You do not have permission under this licence to share adapted material derived from this article or parts of it. The images or other third party material in this article are included in the article’s Creative Commons licence, unless indicated otherwise in a credit line to the material. If material is not included in the article’s Creative Commons licence and your intended use is not permitted by statutory regulation or exceeds the permitted use, you will need to obtain permission directly from the copyright holder. To view a copy of this licence, visit http:// creativecommons.org/licenses/by-nc-nd/4.0/.
开放获取 本文受知识共享署名 - 非商业性 - 禁止演绎4.0国际许可协议的许可,允许任何非商业用途、共享、分发以及在任何媒介或格式下复制,只要您对原始作者和来源给予适当的引用,提供知识共享许可协议的链接,并表明您是否修改了许可材料。根据此许可协议,您无权共享由此文章衍生的改编材料或其部分内容。本文中的图片或其他第三方材料包含在文章的知识共享许可协议中,除非在材料的版权声明中另有说明。如果材料未包含在文章的知识共享许可协议中,且您的预期用途未得到法律法规的许可或超出许可范围,您需要直接从版权所有者处获得许可。要查看此许可协议的副本,请访问http:// creativecommons.org/licenses/by-nc-nd/4.0/。
© The Author(s) 2025
© 作者 2025年