Decoupled peak property learning for efficient and interpretable ECD spectra prediction
英文原文与中文译文逐段对照 · English original with Chinese translation
Hao Li (r) ${}^{1,2,3,9}$ , Da Long ${}^{4,9}$ , Li Yuan ${}^{1,2,3}$ , Yu Wang ${}^{5}$ , Yonghong Tian (r) ${}^{1,2,3}$ , Xinchang Wang to ${}^{4}$ & Fanyang Mo D ${}^{3,6,7,8}$
李昊 (r) ${}^{1,2,3,9}$ ,龙达 ${}^{4,9}$ ,袁粒 ${}^{1,2,3}$ ,王宇 ${}^{5}$ ,田永红 (r) ${}^{1,2,3}$ ,王新昌 to ${}^{4}$ & 莫凡洋 D ${}^{3,6,7,8}$
Electronic circular dichroism (ECD) spectra contain key information about molecular chirality by discriminating the absolute configurations of chiral molecules, which is crucial in asymmetric organic synthesis and the drug industry. However, existing predictive approaches lack the consideration of ECD spectra owing to the data scarcity and the limited interpretability to achieve trustworthy prediction. Here we establish a large-scale dataset for chiral molecular ECD spectra and propose ECDFormer for accurate and interpretable ECD spectrum prediction. ECDFormer decomposes ECD spectra into peak entities, uses the QFormer architecture to learn peak properties and renders peaks into spectra. Compared with spectrum sequence prediction methods, our decoupled peak prediction approach substantially enhances both accuracy and efficiency, improving the peak symbol accuracy from 37.3% to 72.7% and decreasing the time cost from an average of 4.6 central processing unit hours to 1.5 s. Moreover, ECDFormer demonstrated its ability to capture molecular orbital information directly from spectral data using the explainable peak-decoupling approach. Furthermore, ECDFormer proved to be equally proficient at predicting various types of spectrum, including infrared and mass spectroscopies, highlighting its substantial generalization capabilities.
电子圆二色(ECD)光谱通过区分手性分子的绝对构型来包含有关分子手性的关键信息,这在不对称有机合成和制药行业中至关重要。然而,由于数据稀缺和实现可靠预测的有限可解释性,现有的预测方法缺乏对ECD光谱的考虑。在这里,我们建立了一个用于手性分子ECD光谱的大规模数据集,并提出了ECDFormer用于准确且可解释的ECD光谱预测。ECDFormer将ECD光谱分解为峰实体,使用QFormer架构学习峰属性并将峰渲染为光谱。与光谱序列预测方法相比,我们的解耦峰预测方法显著提高了准确性和效率,将峰符号准确率从37.3%提高到72.7%,并将时间成本从平均4.6个中央处理器小时降低到1.5秒。此外,ECDFormer展示了其使用可解释的峰解耦方法直接从光谱数据中捕获分子轨道信息的能力。此外,ECDFormer被证明在预测各种类型的光谱方面同样熟练,包括红外光谱和质谱,突出了其强大的泛化能力。
Received: 24 May 2024
收到日期:2024年5月24日
Accepted: 4 December 2024
接受日期:2024年12月4日
Published online: 3 January 2025
在线发表日期:2025年1月3日
B. Check for updates
B. 检查更新
The electronic circular dichroism (ECD) spectrum is a crucial molecular feature owing to its ability to discern the chiral configuration of a molecule, which plays an important role in various fields, including asymmetric catalysis ${}^{1,2}$ , functional materials ${}^{3,4}$ , drug discovery ${}^{5}$ and other related areas ${}^{6,7}$ . For experimental chemists, the theoretical calculation of ECD spectra stands out as the most time-consuming and technically demanding task. As shown in Fig. 1a, the computation of ECD spectra for a chiral molecule entails multiple stages, including molecular structural extraction, conformational search, structural optimization, time-dependent density functional theory (DFT) calculation and Boltzmann weighting. This requires experimental chemists to possess a proficient understanding of specialized tools, such as molecular dynamics and DFT calculations. Moreover, the computational demands and time requirements associated with this process are substantial, thereby highlighting its rate-determining step in the assignment of chiral absolute configurations. It raises an open question: Can we speed up the theoretical calculation of ECD spectra?
电子圆二色(ECD)光谱因其能够辨别分子的手性构型而成为关键的分子特征,这在包括不对称催化 ${}^{1,2}$ 、功能材料 ${}^{3,4}$ 、药物发现 ${}^{5}$ 和其他相关领域 ${}^{6,7}$ 等各个领域中发挥着重要作用。对于实验化学家来说,ECD光谱的理论计算是最耗时且技术要求最高的任务。如图1a所示,手性分子的ECD光谱计算需要多个阶段,包括分子结构提取、构象搜索、结构优化、含时密度泛函理论(DFT)计算和玻尔兹曼加权。这要求实验化学家熟练掌握诸如分子动力学和DFT计算等专业工具。此外,与该过程相关的计算需求和时间要求都很高,从而突出了其在确定手性绝对构型中的速率决定步骤。这引发了一个开放性问题:我们能否加快ECD光谱的理论计算?
‘School of Electronic and Computer Engineering, Peking University Shenzhen Graduate School, Shenzhen, China. ${}^{2}$ Peng Cheng Laboratory, Shenzher China. ‘Al for Science (AI4S)-Preferred Program, Peking University Shenzhen Graduate School, Shenzhen, China. 4’State Key Laboratory of Physical Chemistry of Solid Surfaces, School of Electronic Science and Engineering, Innovation Laboratory for Science and Technologies of Energy Materials of Fujian Province and College of Chemistry and Chemical Engineering, Xiamen University, Xiamen, China. ${}^{5}$ School of Computer Science, Peking University, Beijing, China. ${}^{6}$ School of Materials Science and Engineering, Peking University, Beijing, China. ${}^{7}$ School of Advanced Materials, Peking University Shenzhen Graduate School, Shenzhen, China. ${}^{8}$ Guangdong Provincial Key Laboratory of Nano-Micro Materials Research, Peking University Shenzhen Graduate School, Shenzhen, China. ${}^{9}$ These authors contributed equally: Hao Li, Da Long. &; ;
‘中国深圳北京大学深圳研究生院电子与计算机工程学院。${}^{2}$ 中国深圳鹏城实验室。‘中国深圳北京大学深圳研究生院人工智能促进科学(AI4S)优选计划。4’中国厦门厦门大学电子科学与工程学院固体表面物理化学国家重点实验室、福建省能源材料科学技术创新实验室和化学化工学院。${}^{5}$ 中国北京北京大学计算机科学学院。${}^{6}$ 中国北京北京大学材料科学与工程学院。${}^{7}$ 中国深圳北京大学深圳研究生院先进材料学院。${}^{8}$ 中国深圳北京大学深圳研究生院广东省纳米微材料研究重点实验室。${}^{9}$ 这些作者贡献相同:李昊,龙达。& yuanli - ;;
Fig. 1 | Overview of ECDFormer. a, Quantum chemical calculation and the spectrum prediction pipeline of ECDFormer. The quantum chemical calculation for ECD spectra includes three processes: (1) conformational search; (2) molecular structure optimization (OPT) and time-dependent (TD)-DFT calculations; and (3) Boltzmann weighting, costing an average of 4.6 central processing unit hours per spectrum. We propose the large-scale ECD dataset CMCDS and establish the ECDFormer framework with four processes: (1) molecular graph encoding, (2) peak property learning, (3) peak prediction and (4) rendering, costing 1.5 s per spectrum. b, The architecture of the molecular graph encoding. We consider the integration of atom-bond and bond-angle
图1 | ECDFormer概述。a,ECDFormer的量子化学计算和光谱预测流程。ECD光谱的量子化学计算包括三个过程:(1) 构象搜索;(2) 分子结构优化(OPT)和含时密度泛函理论(TD)-DFT计算;(3) 玻尔兹曼加权,平均每个光谱耗时4.6个中央处理器小时。我们提出了大规模ECD数据集CMCDS,并建立了ECDFormer框架,该框架有四个过程:(1) 分子图编码,(2) 峰性质学习,(3) 峰预测和(4) 渲染,每个光谱耗时1.5秒。b,分子图编码的架构。我们考虑将原子-键和键角嵌入与各种分子几何方面进行整合。
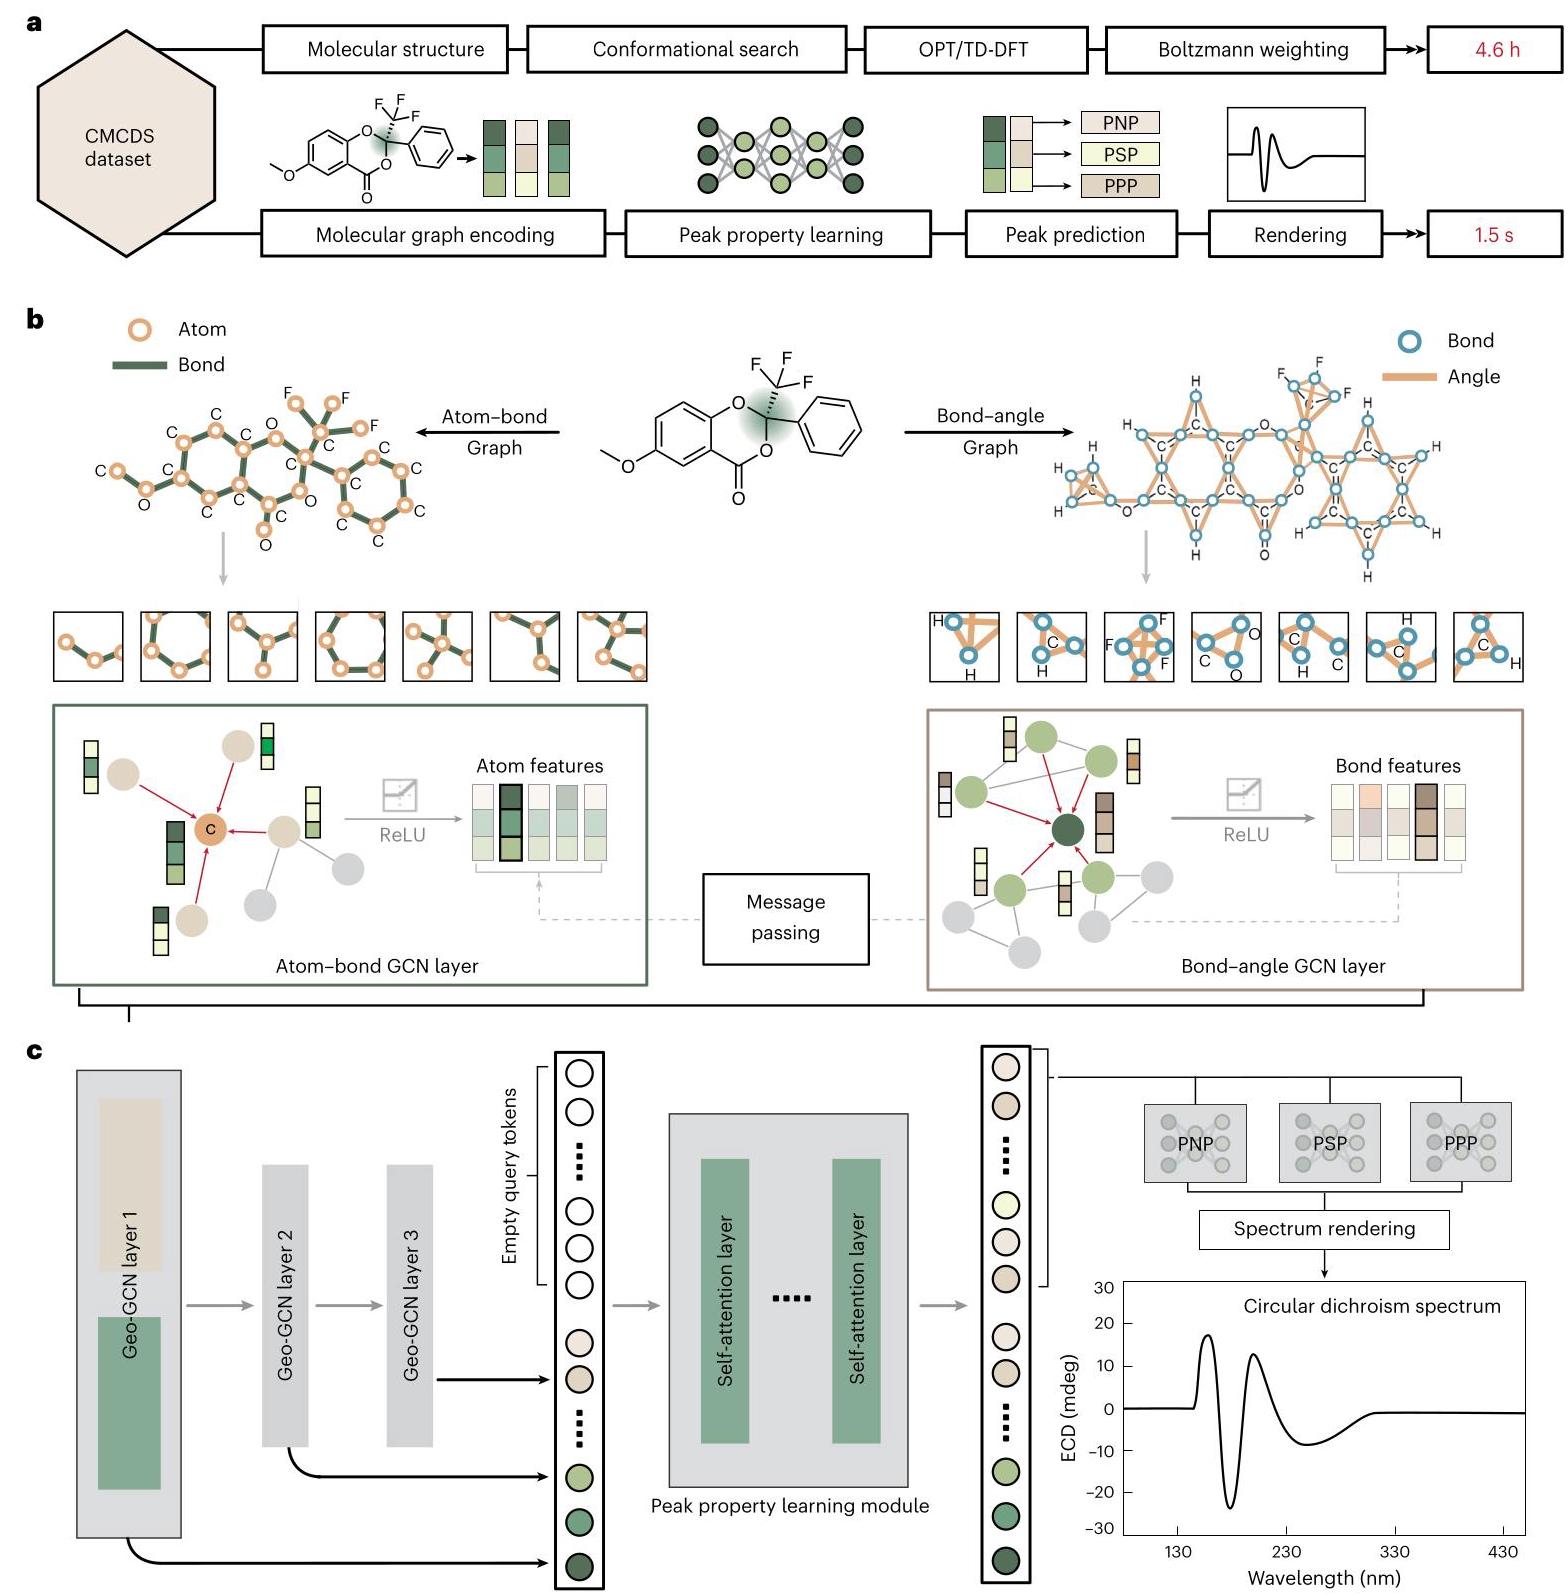
embeddings with various molecular geometrical aspects. c, The architecture of the ECDFormer framework. Inspired by the chemical chiral assignation procedure, we model the peak in the spectrum as the query token in ECDFormer. The peak property learning module fuses the peak query tokens and the molecule feature tokens, while the peak number prediction (PNP), peak symbol prediction (PSP) and peak position prediction (PPP) modules predict the number, symbol and position features for each peak. The spectrum rendering module reconstructs the spectrum shape from peak properties. The green and khakimodules in GeoGCN-Layer1 represent the atom-bond graph convolution network (GCN) layer and the bond-angle GCN layer.
c,ECDFormer框架的架构。受化学手性分配过程的启发,我们将光谱中的峰建模为ECDFormer中的查询令牌。峰性质学习模块融合峰查询令牌和分子特征令牌,而峰数预测(PNP)、峰符号预测(PSP)和峰位置预测(PPP)模块预测每个峰的数量、符号和位置特征。光谱渲染模块根据峰性质重建光谱形状。GeoGCN-Layer1中的绿色和卡其色模块分别代表原子-键图卷积网络(GCN)层和键角GCN层。
Deep learning is a cost-effective approach for precise spectrum prediction, including the infrared (IR) spectra ${}^{8}$ , ultraviolet-visible ${\text{ spectra }}^{9}$ , electronic-excitation spectra ${}^{10}$ and mass spectra ${}^{{11} - {13}}$ . Specifically, neural network for infrared (NNIR) ${}^{8}$ and deep tensor neural network (DTNN) ${}^{10}$ predict spectra by fusing atomic features and chemical bond properties through dual or triple stream representations. With the evolution of molecular representation learning, MoMS-Net ${}^{11}$ , Massformer ${}^{12}$ and SCARF ${}^{13}$ encode molecules into motif graphs for spectral prediction. However, due to the dataset deficiency for chiral molecular ECD spectra, developing a model capable of rapid and accurate prediction for ECD spectra has been difficult. Moreover, existing spectral prediction models use a holistic sequence prediction approach for spectral reconstruction, neglecting exploration of the association between molecular moieties and spectral structures, thus resulting in a lack of interpretability. Therefore, we aim to establish an efficient and interpretable ECD spectrum prediction framework to fill the void in the automated spectrum prediction community.
深度学习是一种经济高效的精确光谱预测方法,包括红外(IR)光谱${}^{8}$、紫外-可见光谱${\text{ spectra }}^{9}$、电子激发光谱${}^{10}$和质谱${}^{{11} - {13}}$。具体而言,用于红外光谱的神经网络(NNIR)${}^{8}$和深度张量神经网络(DTNN)${}^{10}$通过双流或三流表示融合原子特征和化学键性质来预测光谱。随着分子表示学习的发展,MoMS-Net${}^{11}$、Massformer${}^{12}$和SCARF${}^{13}$将分子编码为基序图以进行光谱预测。然而,由于手性分子ECD光谱的数据集不足,开发一个能够快速准确预测ECD光谱的模型一直很困难。此外,现有的光谱预测模型使用整体序列预测方法进行光谱重建,忽略了分子部分与光谱结构之间关联的探索,因此缺乏可解释性。因此,我们旨在建立一个高效且可解释的ECD光谱预测框架,以填补自动光谱预测领域的空白。
First, addressing the dataset deficiency for ECD spectral prediction is imperative because large and high-quality datasets are essential for the effectiveness of machine learning methods. We first need to have a library of chiral molecules. To address this, we have constructed a library of 25,000+ chiral molecules (chiral molecules retention time dataset, CMRT) in our previous work, which introduced a machine learning framework to enhance the efficiency of chromatographic enantioseparation in experimental chemistry ${}^{14}$ . Based on the CMRT dataset, a chiral molecular circular dichroism spectrum dataset (CMCDS) was generated by selecting chiral molecules from CMRT and calculating their ECD spectra.
首先,解决ECD光谱预测的数据集不足问题至关重要,因为大规模且高质量的数据集对于机器学习方法的有效性至关重要。我们首先需要一个手性分子库。为了解决这个问题,我们在之前的工作中构建了一个包含25000多个手性分子的库(手性分子保留时间数据集,CMRT),该工作引入了一个机器学习框架来提高实验化学中色谱对映体分离的效率${}^{14}$。基于CMRT数据集,通过从CMRT中选择手性分子并计算它们的ECD光谱,生成了一个手性分子圆二色光谱数据集(CMCDS)。
With the CMCDS dataset, we further construct ECDFormer, a QFormer-based model to speed up the prediction of the ECD spectra for chiral molecules. Inspired by the chemical assignation scenario that focuses on peak properties in the ECD spectra, our ECDFormer creatively decouples the peaks from the spectra and establishes a peak property learning and prediction module to render the ECD spectra from peak properties rather than predict the ECD spectra directly. Specifically, for the input molecule, our ECDFormer applies its atom, bond, angle features and chiral molecule descriptors as the description information into the geometry-enhanced graph neural network (GNN) structure to learn the molecular representation. For the peak property learning module, we apply the QFormer encoder ${}^{15}$ to learn the peak property features from molecular representations. Then, we respectively predict the peak number, position (wavelength) and symbol (the sign of the Cotton effect ${}^{16}$ ) from property features and render them into the ECD spectra as the prediction of theoretical ECD spectra.
利用CMCDS数据集,我们进一步构建了ECDFormer,这是一个基于QFormer的模型,用于加速手性分子ECD光谱的预测。受关注ECD光谱中峰性质的化学分配场景的启发,我们的ECDFormer创造性地将峰与光谱解耦,并建立了一个峰性质学习和预测模块,以从峰性质渲染ECD光谱,而不是直接预测ECD光谱。具体而言,对于输入分子,我们的ECDFormer将其原子、键、角度特征和手性分子描述符作为描述信息应用于几何增强图神经网络(GNN)结构中,以学习分子表示。对于峰性质学习模块,我们应用QFormer编码器${}^{15}$从分子表示中学习峰性质特征。然后,我们从性质特征中分别预测峰数、位置(波长)和符号(科顿效应的符号${}^{16}$),并将它们渲染为ECD光谱,作为理论ECD光谱的预测。
The quantitative experimental results demonstrate the accuracy and efficiency of our ECDFormer compared with other baselines. ECD-Former substantially enhances the predictive capacity for peak properties and reduces the spectrum prediction time cost from an average of 4.6 central processing unit hours to 1.5 s per molecule. Furthermore, the decoupled peak learning and prediction module ensures the outstanding interpretability of ECDFormer. By highlighting the integrated gradient contributions of different atom groups to the ECD peaks, we observe that the chromophore structures of molecules play a crucial role in peak prediction, which is consistent with the chemical interpretation of ECD spectra. Moreover, our ECDFormer framework presents a strong generalization capability: (1) generalization on natural products (ECDFormer successfully predicts the ECD spectra for natural products with pharmaceutical effects that have currently been found) and (2) generalization on other spectrum forms (ECDFormer is able to accurately predict IR and mass spectra by decoupling and forecasting the peak values in the spectral graphs). Our model not only advances research in chiral chemistry but also has potential applications in asymmetric synthesis and facilitates high-throughput screening of chiral drug molecules in the pharmaceutical development field.
定量实验结果证明了我们的ECDFormer与其他基线相比的准确性和效率。ECD-Former大大提高了对峰性质的预测能力,并将光谱预测时间成本从平均4.6个中央处理器小时降低到每个分子1.5秒。此外,解耦的峰学习和预测模块确保了ECDFormer出色的可解释性。通过突出不同原子组对ECD峰的综合梯度贡献,我们观察到分子的发色团结构在峰预测中起着关键作用,这与ECD光谱的化学解释一致。此外,我们的ECDFormer框架具有很强的泛化能力:(1)对天然产物的泛化(ECDFormer成功预测了目前已发现的具有药物作用的天然产物的ECD光谱)和(2)对其他光谱形式的泛化(ECDFormer能够通过解耦和预测光谱图中的峰值来准确预测红外光谱和质谱)。我们的模型不仅推动了手性化学的研究,而且在不对称合成中具有潜在应用,并有助于在药物开发领域对手性药物分子进行高通量筛选。
Results
结果
CMCDS, a large ECD spectrum dataset from asymmetric catalysis
CMCDS,一个来自不对称催化的大型电子圆二色光谱数据集
The CMCDS dataset is realized mainly by large-scale theoretical calculations, consisting of ECD spectra and simplified molecular input line entry system (SMILES) sequences of 22190 chiral molecules, and the ECD spectral data of all the molecules were calculated by Gaussian16 B. 01 packages ${}^{17}$ . Our chiral molecules were mainly crawled from the literature of asymmetric catalysis, and we transformed the SMILES files of the molecules into MDL molfiles (MOL files) with the help of the RDKit package to obtain the three-dimensional atomic coordinates of the molecules. The above MOL files were converted into Gaussian job files in batches through Python. Then, the molecule structure was optimized at the B3LYP/6-31G level ${}^{18}$ . Furthermore, we conducted the ECD calculation at the CAM-B3LYP/6-31G(d) level ${}^{19}$ , setting the number of states (nstates) to 20. We fixed the half-peak width at 0.3 and applied Gaussian broadening, utilizing the energies and wavelengths derived from these 20 excited states. More details for dataset construction are proposed in Supplementary Section 1.
CMCDS数据集主要通过大规模理论计算实现,由22190个手性分子的电子圆二色光谱和简化分子输入线输入系统(SMILES)序列组成,所有分子的电子圆二色光谱数据均由Gaussian16 B. 01软件包${}^{17}$计算得出。我们的手性分子主要从不对称催化文献中爬取,并借助RDKit软件包将分子的SMILES文件转换为MDL分子文件(MOL文件),以获得分子的三维原子坐标。上述MOL文件通过Python批量转换为Gaussian作业文件。然后,在B3LYP/6 - 31G水平${}^{18}$上对分子结构进行优化。此外,我们在CAM - B3LYP/6 - 31G(d)水平${}^{19}$上进行电子圆二色计算,将状态数(nstates)设置为20。我们将半峰宽固定为0.3并应用高斯展宽,利用从这20个激发态导出的能量和波长。数据集构建的更多详细信息见补充部分1。
Construction of the ECDFormer model
ECDFormer模型的构建
Figure 1b shows the computational workflow of our ECDFormer model. The workflow takes the atom-bond-angle features and molecular descriptors as the features of the target molecule. ECDFormer contains four modules for ECD prediction: (1) the molecular feature extraction module to obtain the chiral molecular representation based on a geometric-enhanced graph neural network; (2) the peak property learning module to extract the peak property features from chiral molecular representation using a transformer encoder structure; (3) the peak property prediction module to predict the peak properties, including number, position and symbol, from the learned peak property features; and (4) the ECD rendering module to reconstruct the ECD spectra from predicted peak properties.
图1b展示了我们的ECDFormer模型的计算工作流程。该工作流程将原子键角特征和分子描述符作为目标分子的特征。ECDFormer包含四个用于ECD预测的模块:(1)分子特征提取模块,基于几何增强图神经网络获得手性分子表示;(2)峰属性学习模块,使用变压器编码器结构从手性分子表示中提取峰属性特征;(3)峰属性预测模块,从学习到的峰属性特征中预测峰属性,包括数量、位置和符号;以及(4)ECD渲染模块,根据预测的峰属性重建ECD光谱。
Molecular ECD spectra are characterized by the presence of positive and negative peaks as a result of the Cotton effect. Compared with other spectra including molecular IR spectra ${}^{9}$ and protein ECD spectra ${}^{20}$ , molecular ECD spectra reveal substantial morphological variations. This distinct feature makes traditional sequence prediction models (long short-term memory (LSTM) and gated recurrent unit (GRU)) less effective for ECD prediction by directly predicting the whole spectra. Chemists often concentrate on the symbols of peaks (indicating the direction of the Cotton effect) and their positions (related to the wavelengths of the peaks) in ECD spectra for determining chirality in molecules. To streamline the ECD prediction process, we focus on predicting essential ECD information such as the number of peaks, their positions and symbols. Accordingly, the peak-focused loss function to support this approach is ${\mathcal{L}}_{\text{ ecd }} = \alpha {\mathcal{L}}_{\text{ ce }}^{\text{ num }} + \beta {\mathcal{L}}_{\text{ ce }}^{\text{ pos }} + \lambda {\mathcal{L}}_{\text{ ce }}^{\text{ sym }}$ , where ${\mathcal{L}}_{\text{ ce }}$ for peak number, position and symbol is cross-entropy loss ${}^{21} \cdot \alpha ,\beta$ and $\lambda$ represent the loss weight (1.1,2.0 and 1.0, respectively), which are selected from multiple ablation experiments. Due to the emphasis of ECD spectra prediction on the positive and negative peaks, we slightly increased the loss weight for peak symbols to enforce the model prediction. We apply ReLU as our activation function, which is stable and effective under multiple ablations.
分子ECD光谱由于科顿效应而具有正峰和负峰。与包括分子红外光谱${}^{9}$和蛋白质ECD光谱${}^{20}$在内的其他光谱相比,分子ECD光谱显示出显著的形态变化。这一独特特征使得传统序列预测模型(长短期记忆(LSTM)和门控循环单元(GRU))通过直接预测整个光谱来进行ECD预测的效果较差。化学家在确定分子手性时,通常关注ECD光谱中峰的符号(表示科顿效应的方向)及其位置(与峰的波长相关)。为了简化ECD预测过程,我们专注于预测基本的ECD信息,如峰的数量、位置和符号。因此,支持这种方法的基于峰的损失函数是${\mathcal{L}}_{\text{ ecd }} = \alpha {\mathcal{L}}_{\text{ ce }}^{\text{ num }} + \beta {\mathcal{L}}_{\text{ ce }}^{\text{ pos }} + \lambda {\mathcal{L}}_{\text{ ce }}^{\text{ sym }}$,其中峰数量、位置和符号的${\mathcal{L}}_{\text{ ce }}$是交叉熵损失${}^{21} \cdot \alpha ,\beta$,$\lambda$表示损失权重(分别为1.1、2.0和1.0),这些权重是从多个消融实验中选择的。由于ECD光谱预测对正峰和负峰的强调,我们稍微增加了峰符号的损失权重以加强模型预测。我们应用ReLU作为激活函数,它在多次消融下稳定且有效。
Peak-specific evaluation metrics for ECD prediction
用于ECD预测的峰特异性评估指标
The ECD spectra of chemical molecules exhibit two distinct characteristics: (1) a high degree of shape diversity and (2) a strong reliance on peak attributes for chiral molecule identification. These characteristics are substantially different from the ECD spectra of proteins, rendering it inappropriate to adopt the sequence root mean square error (Sequence-RMSE) evaluation metric used in protein ECD spectrum prediction tasks ${}^{{22} - {24}}$ . To better evaluate the quality of the ECD spectrum for the chiral molecular assignation task, we establish three sets of evaluation metrics based on peak attributes of ECD spectra: (1) Number-RMSE (the root mean square error (RMSE) of peak number between ground-truth and prediction ECD spectra); (2) Position-RMSE (the RMSE of each peak’s position between ground-truth and prediction ECD spectra); and (3) Symbol-Acc (the matching accuracy of peaks’ symbols between ground-truth and prediction ECD spectra). These metrics provide a reasonable and comprehensive assessment of ECD spectrum prediction quality from different perspectives.
化学分子的ECD光谱表现出两个明显的特征:(1) 高度的形状多样性,以及 (2) 对手性分子识别强烈依赖峰属性。这些特征与蛋白质的ECD光谱有很大不同,这使得采用蛋白质ECD光谱预测任务中使用的序列均方根误差(Sequence-RMSE)评估指标是不合适的${}^{{22} - {24}}$ 。为了更好地评估用于手性分子归属任务的ECD光谱质量,我们基于ECD光谱的峰属性建立了三组评估指标:(1) 数量-RMSE(真实和预测ECD光谱之间峰数量的均方根误差(RMSE));(2) 位置-RMSE(真实和预测ECD光谱之间每个峰位置的RMSE);以及 (3) 符号-Acc(真实和预测ECD光谱之间峰符号的匹配准确率)。这些指标从不同角度对ECD光谱预测质量提供了合理且全面的评估。
Table 1 | Performance for ECD prediction task
表1 | ECD预测任务的性能
| # | Method | Initialization | Evaluation metrics | |||
| Rand | Pretrain | Position-RMSE (nm) $\downarrow$ | Number-RMSE ↓ | Symbol-Acc (%) ↑ | ||
| Machine learning methods | ||||||
| 1 | Logistic regressor | ✓ | - | 7.81 | 7.22 | 47.8 |
| 2 | SGD regressor | ✓ | - | 6.44 | 6.36 | 47.1 |
| 3 | Aggressive regressor | ✓ | - | 5.97 | 4.39 | 48.5 |
| Deep learning methods | ||||||
| 4 | MassFormer12 | ✓ | - | 8.62 | 2.87 | 51.9 |
| 5 | GeoGNN+GRU28 | ✓ | - | 6.47 | 1.72 | 39.5 |
| 6 | GeoGNN+LSTM ${}^{27}$ | ✓ | - | 5.91 | 1.76 | 43.7 |
| 7 | GeoGNN+LSTM ${}^{27}$ | - | ✓ | 4.68 | 1.45 | 46.4 |
| 8 | GeoGNN+transformer ${}^{29}$ | ✓ | - | 4.69 | 1.36 | 49.2 |
| 9 | GeoGNN+transformer ${}^{29}$ | - | ✓ | 5.82 | 1.64 | 37.3 |
| 10 | ECDFormer (ours) | ✓ | - | 2.29 | 1.24 | 72.7 |
We propose the experimental results on our ECDFormer framework and the corresponding baselines including machine learning models and deep learning models. Focusing on peak property prediction, our ECDFormer model surpasses baselines under all evaluation metrics. The check marks and en dashes respectively represent that the model belongs or does not belong to the initialization type.
我们展示了在ECDFormer框架以及包括机器学习模型和深度学习模型在内的相应基线模型上的实验结果。专注于峰性质预测,我们的ECDFormer模型在所有评估指标下均超越了基线模型。勾选标记和短横线分别表示模型属于或不属于初始化类型。
The performance of ECDFomer on peak-specific evaluation metrics
ECDFomer在特定峰评估指标上的性能
To comprehensively evaluate the performance of our ECDFormer, we implemented two categories of models as our baselines, the machine learning models and deep learning models. Table 1 demonstrates that our model outperforms existing approaches. The specific experimental analysis is provided below.
为全面评估我们的ECDFomer的性能,我们实现了两类模型作为基线,即机器学习模型和深度学习模型。表1表明我们的模型优于现有方法。具体实验分析如下。
Comparison with machine learning baselines. Machine learning models are commonly used as analytical tools in the fields of chemistry and materials science ${}^{{25},{26}}$ . We select three common models, including stochastic gradient descent (SGD) regressor, positive aggressive regressor and logistic regressor, as the baselines. Comparing rows 1-3 and row 10 in Table 1, machine learning baselines perform unsatisfactorily, which is attributed mainly to the models’ inability to decouple spectral sequences from complex molecular structural features. This emphasizes the necessity of using deep learning models to tackle the task of predicting ECD spectra for chiral molecules.
与机器学习基线的比较。机器学习模型在化学和材料科学领域${}^{{25},{26}}$通常用作分析工具。我们选择三种常见模型,包括随机梯度下降(SGD)回归器、正激进回归器和逻辑回归器,作为基线。比较表1中的第1 - 3行和第10行,机器学习基线的表现不尽人意,这主要归因于模型无法从复杂的分子结构特征中解耦光谱序列。这强调了使用深度学习模型来处理手性分子ECD光谱预测任务的必要性。
Comparison with deep learning baselines. In the context of abundant data, deep learning models have shown excellent performance in complex task settings. With the CMCDS dataset, we implement sequence prediction deep learning models as our baselines, including MassFormer ${}^{12}$ (multilayer perceptron (MLP)-based model), ${\mathrm{{LSTM}}}^{27},{\mathrm{{GRU}}}^{28}$ , and Transformer Decoder ${}^{29}$ . Comparing rows 5-8 with row 10 in Table 1, our ECDFormer, predicting the peak property of ECD spectra, substantially outperforms other baselines. The results demonstrate the effectiveness of our peak property prediction module in ECDFormer. Comparing rows 6 and 8 with rows 7 and 9, the pretrained models have little influence on the ECD prediction task, due to the lack of chiral molecular information during the pretraining stage.
与深度学习基线的比较。在数据丰富的背景下,深度学习模型在复杂任务设置中表现出优异的性能。使用CMCDS数据集,我们实现了序列预测深度学习模型作为基线,包括MassFormer${}^{12}$(基于多层感知器(MLP)的模型)、${\mathrm{{LSTM}}}^{27},{\mathrm{{GRU}}}^{28}$和Transformer Decoder${}^{29}$。比较表1中的第5 - 8行和第10行,我们的ECDFomer在预测ECD光谱的峰特性方面明显优于其他基线。结果证明了我们的ECDFormer中峰特性预测模块的有效性。比较第6行和第8行与第7行和第9行,由于预训练阶段缺乏手性分子信息,预训练模型对ECD预测任务影响不大。
The analysis of peak-specific evaluation metrics
特定峰评估指标分析
To better analyze the models’ performance, including our ECDFormer and other baselines, under three peak-specific evaluation metrics, we draw the analysis graphs for each evaluation metric in Fig. 2.
为了更好地分析包括我们的ECDFormer和其他基线模型在内的模型在三个特定峰评估指标下的性能,我们在图2中绘制了每个评估指标的分析图。
Peak number analysis. In Fig. 2a, we analyze ECDFormer’s predictive capability regarding the peak number and demonstrate its excellent performance in predicting peak number for complex spectra (peak number >5) compared with baseline models. The $X$ axis represents the ground-truth values of the peak number, while the $Y$ axis represents the predicted values of the peak number. Therefore, the closer the data points are to the $y = x$ line, the better the predictive performance. The density of the data points is indicated by the size of the red circles, where a larger red circle represents a higher concentration of data points. Figure 2a shows that, in ECDFormer, the largest red circles all appear on the $y = x$ line, even when predicting hard samples (peak number >5). The RMSE of peak number is 1.24, indicating the good performance of peak number prediction for our ECDFormer. We also visualize the molecule cases with different peak numbers, elucidating the relationship between the peak number and spectrum complexity. The receiver operating characteristic (ROC) curve for ECDFormer further demonstrates the good performance on hard samples.
峰数分析。在图2a中,我们分析了ECDFormer关于峰数的预测能力,并证明了其在预测复杂光谱(峰数>5)的峰数方面与基线模型相比具有出色的性能。$X$轴表示峰数的真实值,而$Y$轴表示峰数的预测值。因此,数据点越接近$y = x$线,预测性能越好。数据点的密度由红色圆圈的大小表示,其中较大的红色圆圈表示数据点的浓度较高。图2a表明,在ECDFormer中,即使在预测困难样本(峰数>5)时,最大的红色圆圈也都出现在$y = x$线上。峰数的RMSE为1.24,表明我们的ECDFormer在峰数预测方面表现良好。我们还可视化了具有不同峰数的分子情况,阐明了峰数与光谱复杂性之间的关系。ECDFormer的接收者操作特征(ROC)曲线进一步证明了其在困难样本上的良好性能。
Peak position analysis. In Fig. 2b, we analyze the model’s peak position predictive capability. Specifically, we visualize the violin graphs of the position differences between predicted peaks and ground-truth peaks. To further visualize the performance in easy-to-hard cases, we split the test dataset on the basis of the peak number ${N}_{v}$ of a molecule. Compared with baselines, for all cases from easy to hard, most predictions in ECDFormer have 0 difference with ground truth, demonstrating the effectiveness.
峰位置分析。在图2b中,我们分析了模型的峰位置预测能力。具体来说,我们可视化了预测峰与真实峰之间位置差异的小提琴图。为了进一步可视化从易到难情况下的性能,我们根据分子的峰数${N}_{v}$对测试数据集进行了划分。与基线相比,对于从易到难的所有情况,ECDFormer中的大多数预测与真实值的差异为0,证明了其有效性。
Peak symbol analysis. In Fig. 2c, similar to the peak position analysis, we further analyze the model’s peak symbol predictive capability. we visualize the violin graphs of the symbol differences between predicted peaks and ground-truth peaks. For easy cases $\left( {{N}_{p} = 2}\right)$ , our ECDFormer has similar performance to the transformer and the GRU baseline. For hard cases $\left( {{N}_{p} = 3,4\text{ and 5 }}\right)$ , compared with baselines, most predictions in ECDFormer have the same symbols as ground truth while the baselines exhibit substantial error, demonstrating the effectiveness of our ECDFormer.
峰符号分析。在图2c中,与峰位置分析类似,我们进一步分析了模型的峰符号预测能力。我们可视化了预测峰与真实峰之间符号差异的小提琴图。对于容易的情况$\left( {{N}_{p} = 2}\right)$,我们的ECDFormer与Transformer和GRU基线具有相似的性能。对于困难的情况$\left( {{N}_{p} = 3,4\text{ and 5 }}\right)$,与基线相比,ECDFormer中的大多数预测与真实值具有相同的符号,而基线则表现出较大的误差,证明了我们的ECDFormer的有效性。
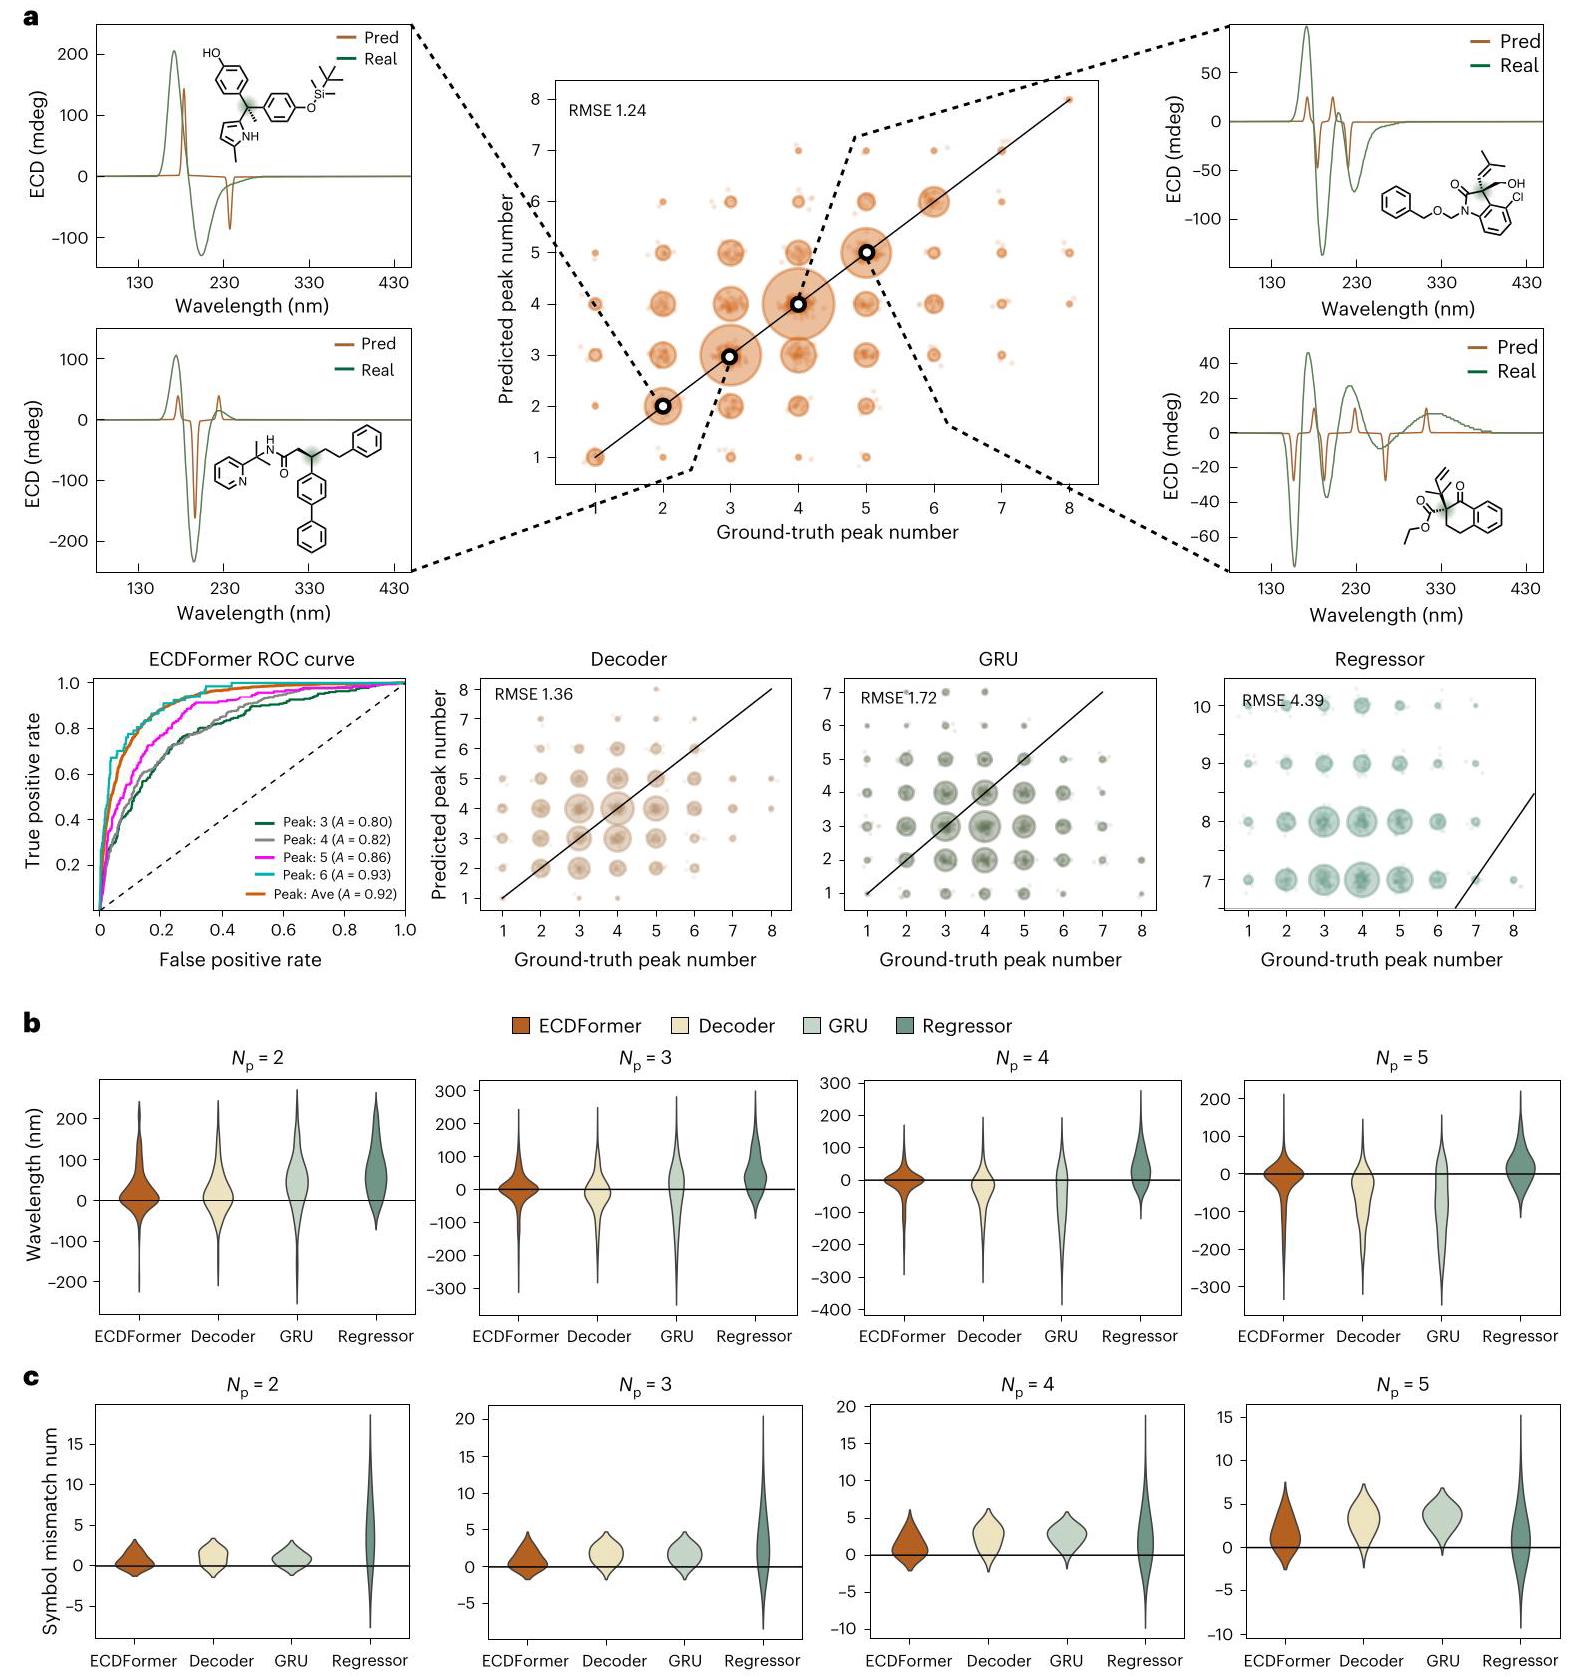
Fig. 2 | Experimental analysis for ECD spectrum prediction. a, The data distribution plot for the peak number of ECD ground-truth spectrum and predicted (Pred) spectrum. Four spectrum cases are proposed for the visualization of the spectrum with different peak numbers. The ROC curve for peak prediction shows the effectiveness of ECDFormer on hard samples (peak 6). Ave, average; A, accuracy. The green shades in the molecules represent the chiral center. b, Violin plots of the discrepancies in peak positions between ground-truth spectrum and predicted spectrum from ECDFormer and baselines. The peak number, ${N}_{\mathrm{p}}$ , indicates the spectral complexity. ECDFormer’s position discrepancy distribution is closer to zero than the baselines. c, Violin plots of the discrepancies in peak symbols between the ground-truth spectrum and the predicted spectrum from ECDFormer and baselines. ECDFormer’s symbolic discrepancy distribution is closer to zero than the baselines. num, number.
图2 | ECD光谱预测的实验分析。a,ECD真实光谱和预测(Pred)光谱的峰数数据分布图。提出了四种光谱情况以可视化具有不同峰数的光谱。峰预测的ROC曲线显示了ECDFormer在困难样本(峰6)上的有效性。Ave,平均值;A,准确率。分子中的绿色阴影表示手性中心。b,ECDFormer和基线的真实光谱与预测光谱之间峰位置差异的小提琴图。峰数${N}_{\mathrm{p}}$表示光谱复杂性。ECDFormer的位置差异分布比基线更接近零。c,ECDFormer和基线的真实光谱与预测光谱之间峰符号差异的小提琴图。ECDFormer的符号差异分布比基线更接近零。num,数量。
The generalization analysis for ECDFormer
ECDFormer的泛化分析
The generalization analysis for ECDFormer consists of two parts: (1) the generalization ability for ECD spectrum prediction on existing
ECDFormer的泛化分析包括两个部分:(1) 对现有药物分子ECD光谱预测的泛化能力
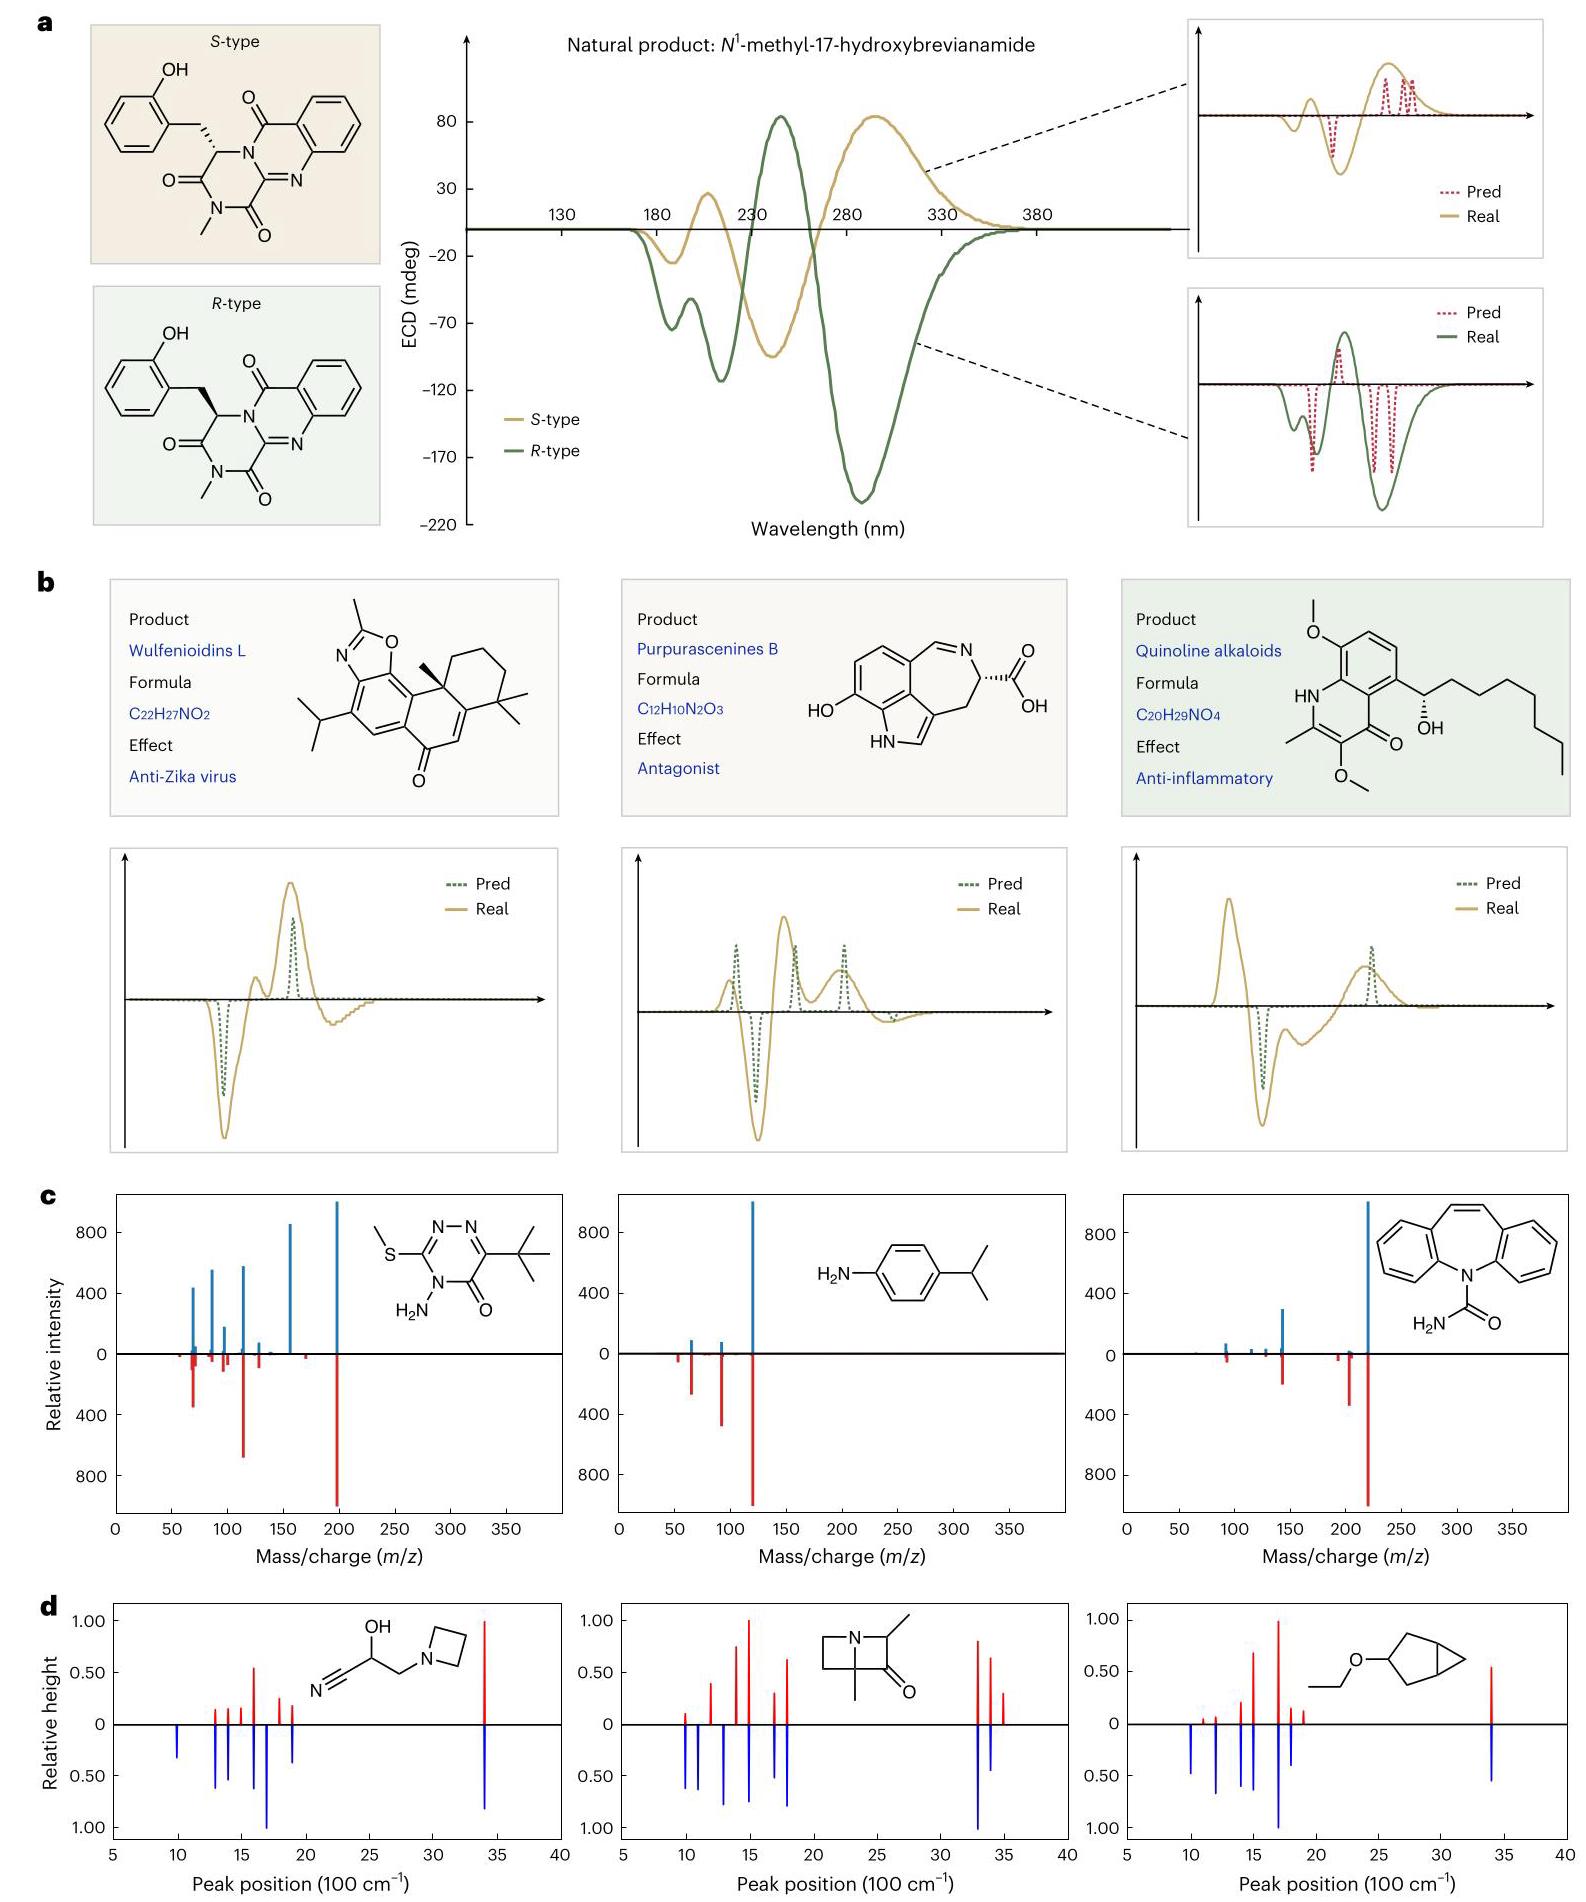
Fig. 3 | Generalization analysis for ECDFormer. a, b, We select natural products with pharmaceutical effects from recent journals ${}^{{30} - {33}}$ . ECDFormer has zero-shot ECD prediction capability for these unseen natural products and their chiral structures, and it performs well even on a pair of enantiomers as depicted in a. c, The ECDFormer framework has excellent generalization ability on the tandem mass spectra prediction task. We present three predicted (red) and real (blue) mass spectra. d, The ECDFormer framework has good generalization ability on the IR spectra prediction task.
图3 | ECDFormer的泛化分析。a、b,我们从近期期刊${}^{{30} - {33}}$中挑选具有药物作用的天然产物。ECDFormer对这些未见的天然产物及其手性结构具有零样本ECD预测能力,并且如图a所示,即使在一对对映体上也表现良好。c,ECDFormer框架在串联质谱预测任务上具有出色的泛化能力。我们展示了三个预测(红色)和真实(蓝色)质谱。d,ECDFormer框架在红外光谱预测任务上具有良好的泛化能力。
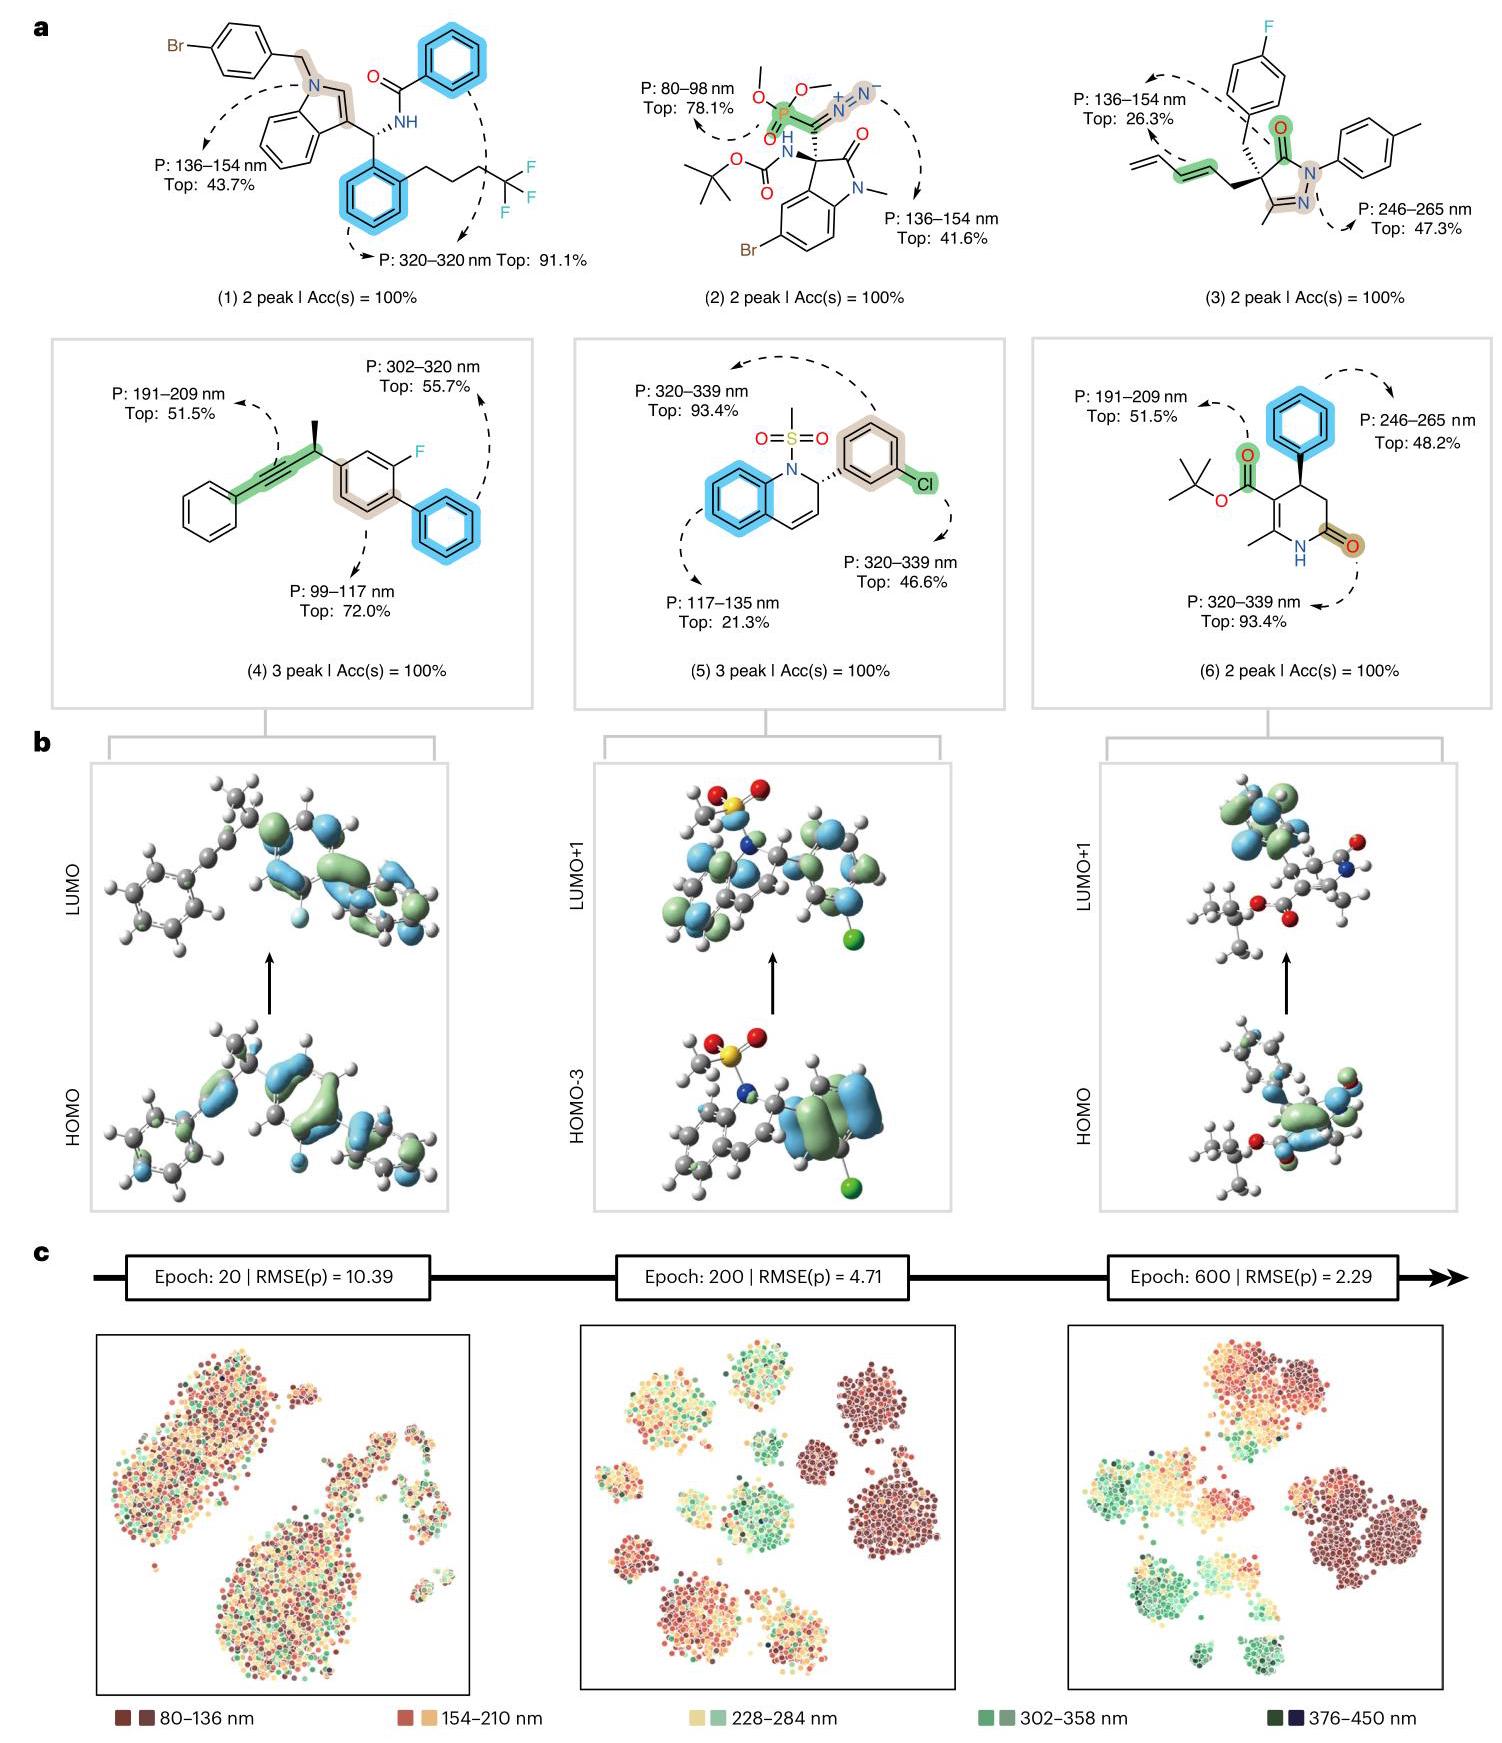
calculations. In the context of molecular orbitals, the two distinct colors associated with the highest occupied molecular orbital (HOMO) and the lowest unoccupied molecular orbital (LUMO) correspond to different phases of the wavefunction. Specifically, green denotes a positive phase of the wavefunction, whereas blue signifies a negative phase. HOMO-3 refers to the molecular orbital that is three energy levels below the HOMO, while LUMO+1 denotes the molecular orbital that is one energy level above the LUMO. c, As the number of iterations increases, the RMSE error for the prediction of peak number gradually decreases, while the clustering of peaks in spatially proximate positions becomes increasingly evident.
计算。在分子轨道的背景下,与最高占据分子轨道(HOMO)和最低未占据分子轨道(LUMO)相关的两种不同颜色对应于波函数的不同相位。具体而言,绿色表示波函数的正相位,而蓝色表示负相位。HOMO - 3指的是比HOMO低三个能级的分子轨道,而LUMO + 1表示比LUMO高一个能级的分子轨道。c,随着迭代次数的增加,峰数预测的RMSE误差逐渐减小,而空间上相邻位置的峰聚类变得越来越明显。
Fig. 4 | Interpretability of ECDFormer. a, The integral gradient method is used to label the region in the entire molecule that contributes most to generating the spectrum. ‘P’ represents the position where this peak occurs, ‘Top’ represents the contribution ratio of the highlighted interval corresponding to the top-2 contributions of the entire molecule and ‘Acc(s)’ represents the accuracy of the peak’s symbol (positive/negative). Molecular fragments are highlighted in different colors (blue, green and tan) to distinguish their association with ECD spectral peaks at different wavelengths. b, Upon comparison, the molecule regions marked by integral gradient are observed to closely align with molecular orbital regions contributing to ECD peaks as determined by quantum chemical pharmaceutical molecules and (2) the generalization ability for mass and IR spectrum prediction.
图4 | ECDFormer的可解释性。a,使用积分梯度法标记整个分子中对生成光谱贡献最大的区域。“P”表示该峰出现的位置,“Top”表示整个分子前2大贡献对应的突出显示区间的贡献比例,“Acc(s)”表示峰符号(正/负)的准确性。分子片段用不同颜色(蓝色、绿色和棕褐色)突出显示,以区分它们与不同波长的ECD光谱峰的关联。b,经比较,观察到积分梯度标记的分子区域与量子化学计算确定的对ECD峰有贡献的分子轨道区域紧密对齐,以及(2) 对质谱和红外光谱预测的泛化能力。
Predictions on existing pharmaceutical molecules. Figure 3a, b shows the ECD predictions for existing pharmaceutical molecules. We first visualize the ECD predictions for $R$ and $S$ types of hydroxybrevianamide ${}^{30}$ , a natural product in Aspergillus sp. fungus. Figure 3a shows that ECDFormer can successfully predict the ECD spectra for $R$ -type and $S$ -type molecule pairs. We also visualize the ECD predictions for other pharmaceutical molecules, including Wulfenioidins ${\mathrm{L}}^{31}$ (anti-Zika virus effect), Purpurascenines ${\mathrm{B}}^{32}$ (antagonist effect) and alkaloids ${}^{33}$ (anti-inflammatory effect). Our ECDFormer predictions also match the ECD theoretical spectra of these complex natural products with pharmaceutical effects.
对现有药物分子的预测。图3a、b展示了对现有药物分子的ECD预测。我们首先可视化了$R$和$S$类型的羟基短裸壳孢菌素${}^{30}$(曲霉属真菌中的一种天然产物)的ECD预测。图3a表明ECDFormer可以成功预测$R$型和$S$型分子对的ECD光谱。我们还可视化了其他药物分子的ECD预测,包括Wulfenioidins${\mathrm{L}}^{31}$(抗寨卡病毒作用)、Purpurascenines${\mathrm{B}}^{32}$(拮抗作用)和生物碱${}^{33}$(抗炎作用)。我们的ECDFormer预测也与这些具有药物作用的复杂天然产物的ECD理论光谱相匹配。
Predictions for mass spectra. Tandem mass spectrum is an important spectral metric for gauging molecular attributes. MassBank of North America (MONA) ${}^{34}$ is a large-scale mass spectrum dataset with one million mass spectra. We apply MONA for both training and evaluation. By decoupling the peaks in mass spectra, we can utilize the peak prediction module of ECDFormer to accomplish the task of mass spectra prediction. Figure 3c illustrates a visual example of ECDFormer’s approach to mass spectra prediction under the ${\left\lbrack M + H\right\rbrack }^{ + }$ adduct. It is important to note that, due to the adducts, the largest peak in the tandem mass spectra does not necessarily correspond to the overall molecular mass. In Fig. 3c, blue represents the real spectra and red represents the predicted spectra. Our model exhibits commendable generalization to the task of mass spectra prediction, further elucidating the flexible generalizability of our ECDFormer framework.
对质谱的预测。串联质谱是衡量分子属性的重要光谱指标。北美质谱库(MONA)${}^{34}$是一个拥有100万个质谱的大规模质谱数据集。我们将MONA用于训练和评估。通过解耦质谱中的峰,我们可以利用ECDFormer的峰预测模块完成质谱预测任务。图3c展示了在${\left\lbrack M + H\right\rbrack }^{ + }$加合物下ECDFormer进行质谱预测方法的一个可视化示例。需要注意的是,由于加合物的存在,串联质谱中最大的峰不一定对应于整体分子量。在图3c中,蓝色代表真实光谱,红色代表预测光谱。我们的模型在质谱预测任务上表现出值得称赞的泛化能力,进一步阐明了我们的ECDFormer框架的灵活泛化性。
Prediction for IR spectra. We follow the IR spectrum dataset in Deta- ${\text{ Net }}^{9}$ , which contains 130,000 molecules and their IR spectra. Due to time constraints, we used only 10,000 molecules for the training and evaluation datasets. However, with the small dataset, ECDformer achieved strong performance without modifying the model structure. Figure 3d shows examples of predicted IR spectra, further illustrating the model’s generalization capability in the spectral domain. Detailed analyses are shown in Supplementary Section 4.
对红外光谱的预测。我们遵循Deta - ${\text{ Net }}^{9}$中的红外光谱数据集,该数据集包含130,000个分子及其红外光谱。由于时间限制,我们仅使用10,000个分子作为训练和评估数据集。然而,在这个小数据集上,ECDFormer在不修改模型结构的情况下取得了很强的性能。图3d展示了预测红外光谱的示例,进一步说明了模型在光谱领域的泛化能力。详细分析见补充部分4。
The interpretable analysis for ECDFormer
ECDFormer的可解释性分析
For the interpretability aspect, in comparison with other spectral generation methods, our ECDFormer framework exhibits commendable interpretability due to its attribute prediction for spectral peak disentanglement. Specifically, Fig. 4 demonstrates the interpretability of ECDFormer. To elucidate the process of how ECDFormer generates spectra, we used the integrated gradients method to delineate regions within the entire molecule that contribute most substantially to spectrum generation. Figure 4a demonstrates the contribution of different molecules to peaks at various positions in the spectrum through integrated gradients. We observe that chromophores within the molecules generally contribute substantially to the peaks, which is consistent with the chemical principles of ECD spectroscopy.
在可解释性方面,与其他光谱生成方法相比,我们的ECDFormer框架由于其对光谱峰解缠的属性预测而表现出值得称赞的可解释性。具体而言,图4展示了ECDFormer的可解释性。为了阐明ECDFormer生成光谱的过程,我们使用积分梯度法来描绘整个分子中对光谱生成贡献最大的区域。图4a通过积分梯度展示了不同分子对光谱中不同位置峰的贡献。我们观察到分子中的发色团通常对峰有很大贡献,这与ECD光谱的化学原理一致。
Figure 4b further validates the correctness of the highlighted chromophores in Fig. 4a through quantum chemical calculations. Specifically, the three-dimensional structure of a molecule dictates the shape of its ECD spectrum. For theoretical computations, we selected three molecules depicted in Fig. 4a, each characterized by vital chromophores such as benzene rings, carbon-carbon double bonds, carbon-carbon triple bonds and carbon-oxygen double bonds. In the computational results, by examining the characteristic peaks of the ECD spectra for these molecules, we discovered a correlation with specific electronic transitions within the molecules. These transitions involve particular molecular orbitals deemed crucial in quantized computations. Upon comparison, the regions marked using the integral gradient method were observed to closely align with molecular orbital regions contributing to ECD peaks as determined by quantum chemical calculations. Hence, we postulate that ECDFormer can learn the chiral features of molecules, thereby enabling the accurate generation of molecular ECD spectra.
图4b通过量子化学计算进一步验证了图4a中突出显示的发色团的正确性。具体来说,分子的三维结构决定了其ECD光谱的形状。对于理论计算,我们选择了图4a中描绘的三个分子,每个分子都具有重要的发色团,如苯环、碳 - 碳双键、碳 - 碳三键和碳 - 氧双键。在计算结果中,通过检查这些分子的ECD光谱的特征峰,我们发现了与分子内特定电子跃迁的相关性。这些跃迁涉及在量子计算中被认为至关重要的特定分子轨道。经比较,观察到使用积分梯度法标记的区域与量子化学计算确定的对ECD峰有贡献的分子轨道区域紧密对齐。因此,我们推测ECDFormer可以学习分子的手性特征,从而能够准确生成分子ECD光谱。
Discussion
讨论
This study proposes a research framework for integrating deep learning techniques into the field of chemistry to improve the efficiency of researchers in acquiring the ECD spectra of chiral molecules. The proposed ECDFormer focuses on several core issues including data collection, three-dimensional characterization of chiral molecules and understanding of chirality. We also explore the ECDFormer framework’s potential to infer molecular structures from predicted spectra in Supplementary Table 4. For the ECD spectrum, although the resolution is low, it still provides some structural information at the molecular level, which is based on the already-established atomic-level structure. Figure 4 demonstrates that ECDFormer partially correlates predicted CD peaks with molecular orbital regions. For the IR spectrum that provides structural information at the atom level, ECDFormer accurately identifies common functional groups from predicted IR peak positions. However, ECDFormer still cannot reconstruct the overall structure of the molecule from IR and ECD spectra, and this challenge remains unresolved.
本研究提出了一个将深度学习技术整合到化学领域的研究框架,以提高研究人员获取手性分子ECD光谱的效率。所提出的ECDFormer关注几个核心问题,包括数据收集、手性分子的三维表征以及对手性的理解。我们还在补充表4中探讨了ECDFormer框架从预测光谱推断分子结构的潜力。对于ECD光谱,尽管分辨率较低,但它仍然基于已建立的原子级结构在分子水平上提供了一些结构信息。图4表明ECDFormer将预测的CD峰与分子轨道区域部分关联起来。对于在原子水平上提供结构信息的红外光谱,ECDFormer从预测的红外峰位置准确识别常见官能团。然而,ECDFormer仍然无法从红外光谱和ECD光谱重建分子的整体结构,这一挑战仍未解决。
Furthermore, there are areas for improvement in this study that could be addressed in future research. Initially, in compiling the extensive ECD spectral data, we bypassed the conformational search for each molecule to minimize time and cost. This may potentially affect the precision of the ECD spectra of flexible molecules. In addition, our CMCDS dataset focused solely on molecules with a monochiral center, intentionally excluding those with polychiral centers. Despite the effective zero-shot generalization of our ECDFormer model to molecules with polychiral centers (details available in Supplementary Section 3), we aspire to refine the polychiral molecule component in subsequent dataset expansions to enable the model to learn a more comprehensive representation of chiral structures. Despite these constraints, we remain optimistic about the ECDFormer model’s potential in accurately determining the absolute configuration of chiral molecules. The model offers a rapid way to acquire ECD spectra directly from the SMILES notation of the molecules.
此外,本研究还有一些可以在未来研究中改进的地方。首先,在汇编广泛的ECD光谱数据时,我们绕过了对每个分子的构象搜索,以尽量减少时间和成本。这可能会影响柔性分子ECD光谱的精度。此外,我们的CMCDS数据集仅专注于具有单一手性中心的分子,有意排除了具有多个手性中心的分子。尽管我们的ECDFormer模型对具有多个手性中心的分子进行了有效的零样本泛化(补充第3节中有详细信息),但我们希望在后续的数据集中扩展中优化多手性分子成分,以使模型能够学习到手性结构更全面的表示。尽管有这些限制,我们仍然对ECDFormer模型在准确确定手性分子绝对构型方面的潜力持乐观态度。该模型提供了一种直接从分子的SMILES表示法获取ECD光谱的快速方法。
Methods
方法
Problem definition and preliminary for ECD prediction
ECD预测的问题定义与预备知识
We first briefly introduce the problem definition of the ECD prediction task for the convenience of description and discussion.
为便于描述和讨论,我们首先简要介绍ECD预测任务的问题定义。
ECD prediction task. Generally, each chiral molecule has its ECD. For molecule ${M}_{1}$ , we represent the ECD of ${M}_{1}$ as ${\left\{ {S}_{1 : i}\right\} }_{i = 1}^{{N}_{\mathrm{w}}}$ , where ${S}_{1 : i}$ is the input light wavelength from 80 to ${450}\mathrm{\;{nm}}$ , and ${N}_{\mathrm{w}}$ is the ECD range from -200 mdeg to 200 mdeg. For ${M}_{1}$ ’s enantiomer ${\widetilde{M}}_{1}$ , we represent its ECD as ${\left\{ -{S}_{1 : i}\right\} }_{i = 1}^{{N}_{\mathrm{w}}}$ . When applying deep learning models for ECD prediction, it seems reasonable to establish a site-level sequence prediction model to predict every ${S}_{1 : i}$ of the ECD. However, in practice analysis, molecular representation lacks the knowledge to reconstruct the site-level ECD sequence. Thus, we simplify the ECD prediction task from the chemical perspective, focusing on the peak features in the ECD sequence. Specifically, we represent molecule ${M}_{1}$ ’s ECD sequence as ${\left\{ {\mathcal{R}}_{i;j}\right\} }_{i = 1}^{{N}_{\mathrm{p}}}$ , where ${\mathcal{R}}_{i;j}$ is the $j$ th peak in ECD sequence and ${N}_{\mathrm{p}}$ is the peak number. The ECD prediction task aims to predict the peak number ${N}_{\mathrm{p}}$ , the peak position and the height for ${\mathcal{P}}_{1 : j}$ . Under the new task setting, deep learning models achieve better performance on ECD prediction and chiral molecule distinguishment.
ECD预测任务。一般来说,每个手性分子都有其ECD。对于分子${M}_{1}$,我们将${M}_{1}$的ECD表示为${\left\{ {S}_{1 : i}\right\} }_{i = 1}^{{N}_{\mathrm{w}}}$,其中${S}_{1 : i}$是80至${450}\mathrm{\;{nm}}$的输入光波长,${N}_{\mathrm{w}}$是-200 mdeg至200 mdeg的ECD范围。对于${M}_{1}$的对映体${\widetilde{M}}_{1}$,我们将其ECD表示为${\left\{ -{S}_{1 : i}\right\} }_{i = 1}^{{N}_{\mathrm{w}}}$。在应用深度学习模型进行ECD预测时,建立一个位点级序列预测模型来预测ECD的每个${S}_{1 : i}$似乎是合理的。然而,在实际分析中,分子表示缺乏重建位点级ECD序列的知识。因此,我们从化学角度简化ECD预测任务,专注于ECD序列中的峰特征。具体来说,我们将分子${M}_{1}$的ECD序列表示为${\left\{ {\mathcal{R}}_{i;j}\right\} }_{i = 1}^{{N}_{\mathrm{p}}}$,其中${\mathcal{R}}_{i;j}$是ECD序列中的第$j$个峰,${N}_{\mathrm{p}}$是峰的数量。ECD预测任务旨在预测${\mathcal{P}}_{1 : j}$的峰数量${N}_{\mathrm{p}}$、峰位置和高度。在新的任务设置下,深度学习模型在ECD预测和手性分子区分方面取得了更好的性能。
Graph neural network and transformer. Graph neural network ${}^{35}$ is an outstanding model for graph representation learning. For molecules, the atoms and chemical bonds are easy to interpret as a graph. Thus, GNN has become the regular model to extract molecular representation ${}^{{14},{36} - {39}}$ . For an input molecular graph, GNN takes the weighted average of node features and their neighbor features, resulting in new representations for nodes. GNN iterates this process through multiple layers of fully connected layers to progressively propagate and aggregate information from the nodes, leading to richer molecule representations.
图神经网络和Transformer。图神经网络${}^{35}$是一种用于图表示学习的优秀模型。对于分子,原子和化学键很容易解释为一个图。因此, GNN已成为提取分子表示${}^{{14},{36} - {39}}$的常用模型。对于输入的分子图,GNN对节点特征及其邻居特征进行加权平均,从而得到节点的新表示。GNN通过多层全连接层迭代此过程,以逐步传播和聚合来自节点的信息,从而得到更丰富的分子表示。
The transformer ${}^{40}$ is a seminal deep-learning model for the sequence processing task. It utilizes stacked attention ${}^{{29},{41},{42}}$ modules to fuse sequence features from different positions, thereby achieving improved sequence prediction performance. The transformer consists of two parts: the encoder and the decoder. The encoder uses bidirectional attention modules to better integrate input features, while the decoder uses unidirectional attention modules for sequence prediction. In this work, we have redefined the ECD prediction task as peak information prediction, and therefore, we apply the transformer encoder structure for its enhanced feature fusion capability.
Transformer${}^{40}$是一种用于序列处理任务的开创性深度学习模型。它利用堆叠的注意力${}^{{29},{41},{42}}$模块来融合来自不同位置的序列特征,从而提高序列预测性能。Transformer由两部分组成:编码器和解码器。编码器使用双向注意力模块来更好地整合输入特征,而解码器使用单向注意力模块进行序列预测。在这项工作中,我们将ECD预测任务重新定义为峰信息预测,因此,我们应用Transformer编码器结构以增强其特征融合能力。
The framework of the proposed ECDFormer
所提出的ECDFormer框架
The overview of our ECDFormer is illustrated in Fig. 1b, c. Our ECD-Former contains four major modules: (1) feature extraction module with modified geometric-enhanced ${\mathrm{{GNN}}}^{{43} - {45}}$ ,(2) peak property learning module with QFormer ${}^{{46},{47}}$ encoder,(3) peak property prediction module and (4) ECD rendering module. The workflow of our ECDFormer is described below.
我们的ECDFormer概述如图1b、c所示。我们的ECD-Former包含四个主要模块:(1) 具有修改后的几何增强${\mathrm{{GNN}}}^{{43} - {45}}$的特征提取模块,(2) 具有QFormer${}^{{46},{47}}$编码器的峰属性学习模块,(3) 峰属性预测模块和(4) ECD渲染模块。我们的ECDFormer的工作流程如下所述。
The feature extraction module utilizes GeoGNN containing two graph convolutional networks to extract the molecule’s geometric and descriptor information from the molecule’s atom-bond graph and bond-angle graph. Then, the molecule representation features are fed into the peak property learning module together with empty query tokens. With the transformer encoder structure, the peak property learning module extracts the peak-related features from the molecule features to the empty query tokens. In the peak property prediction module, the resulting peak-related features are simultaneously fed into three specific task heads: the peak-number head, the peak-position head and the peak-height head to predict the peak properties. Finally, the ECD rendering module reconstructs the ECD spectra from the peak properties using mathematical simulation methods. Our framework obeys physical conservation conditions including the translation, rotation and permutation symmetry. The detailed proof is proposed in Supplementary Section 6. We further introduce more details about the feature extraction module, peak property learning module, peak property prediction module and ECD rendering module in the following subsections.
特征提取模块利用包含两个图卷积网络的GeoGNN从分子的原子键图和键角图中提取分子的几何和描述符信息。然后,分子表示特征与空查询令牌一起被输入到峰属性学习模块中。利用Transformer编码器结构,峰属性学习模块从分子特征中提取与峰相关的特征到空查询令牌。在峰属性预测模块中,所得的与峰相关的特征同时被输入到三个特定任务头:峰数头、峰位置头和峰高度头,以预测峰属性。最后,ECD渲染模块使用数学模拟方法从峰属性重建ECD光谱。我们的框架遵守包括平移、旋转和置换对称性在内的物理守恒条件。详细证明见补充第6节。我们将在以下小节中进一步介绍特征提取模块、峰属性学习模块、峰属性预测模块和ECD渲染模块的更多细节。
Molecular feature extraction module
分子特征提取模块
As shown in Fig. 1b, for the molecular feature extraction module, we apply the geometric-enhanced GNN structure to encode molecular geometric features by modeling the atom-bond-angle corresponding relations. Compared with the traditional GNNs that consider only the atom-bond relationship, GeoGNN ${}^{{43},{44}}$ has a stronger ability in molecular representation modeling.
如图1b所示,对于分子特征提取模块,我们应用几何增强的GNN结构,通过对原子-键角对应关系进行建模来编码分子几何特征。与仅考虑原子-键关系的传统GNN相比,GeoGNN ${}^{{43},{44}}$ 在分子表示建模方面具有更强的能力。
Specifically, for an input molecule $M$ , we denote its atom set as $\mathcal{V}$ , its bond set as $\varepsilon$ and its bond-angle set as $\mathcal{A}$ . Then, we introduce $M$ ’s atom-bond graph $G$ and bond-angle graph $H$ . The atom-bond graph is defined as $G = \left( {\mathcal{V},\mathcal{E}}\right)$ , where atom $u \in \mathcal{V}$ is regarded as the node of $G$ and bond $\left( {u, v}\right) \in \mathcal{E}$ as the edge of $G$ . Similarly, the bond-angle graph is defined as $H = \left( {\mathcal{E},\mathcal{A}}\right)$ , where bond $\left( {u, v}\right) \in \mathcal{E}$ is regarded as the node of $H$ and bond angle $\left( {u, v, w}\right) \in \mathcal{A}$ as the edge of $H$ . Both the atom-bond graph and the bond-angle graph are fed into the GeoGNN for further feature extraction.
具体来说,对于输入分子 $M$ ,我们将其原子集记为 $\mathcal{V}$ ,键集记为 $\varepsilon$ ,键角集记为 $\mathcal{A}$ 。然后,我们引入 $M$ 的原子-键图 $G$ 和键角图 $H$ 。原子-键图定义为 $G = \left( {\mathcal{V},\mathcal{E}}\right)$ ,其中原子 $u \in \mathcal{V}$ 被视为 $G$ 的节点,键 $\left( {u, v}\right) \in \mathcal{E}$ 被视为 $G$ 的边。类似地,键角图定义为 $H = \left( {\mathcal{E},\mathcal{A}}\right)$ ,其中键 $\left( {u, v}\right) \in \mathcal{E}$ 被视为 $H$ 的节点,键角 $\left( {u, v, w}\right) \in \mathcal{A}$ 被视为 $H$ 的边。原子-键图和键角图都被输入到GeoGNN中进行进一步的特征提取。
Then, our feature extraction module learns the representation of atoms and bonds iteratively. For the $k$ th iteration, we use ${\mathbf{h}}_{u}$ and ${\mathbf{h}}_{uv}$ as the representation of atom $u$ and bond $\left( {u, v}\right)$ . To achieve information aggregation between the atom-bond graph $G$ and the bond-angle graph $H$ , the representation vectors of the bonds are taken as the information link between $G$ and $H$ . Specifically, the iteration of our feature extraction module contains two stages.
然后,我们的特征提取模块迭代地学习原子和键的表示。对于第 $k$ 次迭代,我们使用 ${\mathbf{h}}_{u}$ 和 ${\mathbf{h}}_{uv}$ 作为原子 $u$ 和键 $\left( {u, v}\right)$ 的表示。为了实现原子-键图 $G$ 和键角图 $H$ 之间的信息聚合,键的表示向量被用作 $G$ 和 $H$ 之间的信息链接。具体来说,我们的特征提取模块的迭代包含两个阶段。
In the first stage, the bonds’ representation vectors are learned by aggregating messages from the neighboring bonds and corresponding bond angles in the bond-angle graph $H$ . Given bond $\left( {u, v}\right)$ , in $k$ th iteration, its representation ${\mathbf{h}}_{uv}^{\left( k\right) }$ is formalized by
在第一阶段,通过在键角图 $H$ 中聚合来自相邻键和相应键角的消息来学习键的表示向量。给定键 $\left( {u, v}\right)$ ,在第 $k$ 次迭代中,其表示 ${\mathbf{h}}_{uv}^{\left( k\right) }$ 形式化为
$$ {\mathbf{a}}_{uv}^{\left( k\right) } = {\mathcal{F}}_{\text{ bond-angle }}^{\left( k\right) }\left( \left\{ \left( {{\mathbf{h}}_{uv}^{\left( k - 1\right) },{\mathbf{h}}_{uw}^{\left( k - 1\right) },{\mathbf{x}}_{wuv}}\right) \right. \right. \tag{1} $$$$ \left. \left. {\left. { : w \in \mathcal{N}\left( u\right) }\right) \cup \left\{ {\left( {{\mathbf{h}}_{uv}^{\left( k - 1\right) },{\mathbf{h}}_{vw}^{\left( k - 1\right) },{\mathbf{x}}_{uvw}}\right) : w \in \mathcal{N}\left( v\right) }\right) }\right\} \right) , $$$$ {\mathbf{h}}_{uv}^{\left( k\right) } = {\mathcal{W}}_{s} \times {\mathbf{h}}_{uv}^{\left( k - 1\right) } + {\mathbf{a}}_{uv}^{\left( k\right) }, \tag{2} $$where $\mathcal{N}\left( u\right)$ and $\mathcal{N}\left( v\right)$ are the neighbor atoms of $u$ and $v.\{ \left( {u, w}\right)$ : $w \in \mathcal{N}\left( u\right) \} \cup \{ \left( {v, w}\right) : w \in \mathcal{N}\left( v\right) \}$ are the neighbor bonds of bond $\left( {u, v}\right)$ . ${\mathcal{F}}_{\text{ bond-angle }}$ is an MLP with two linear layers, acting as the message aggregation function. ${\mathbf{a}}_{uv}$ is bond $\left( {u, v}\right)$ ’s aggregated feature from neighbor bonds. Then, the bond $\left( {u, v}\right)$ ’s representation vector is updated according to ${\mathbf{a}}_{uv}$ in equation (2).
其中 $\mathcal{N}\left( u\right)$ 和 $\mathcal{N}\left( v\right)$ 是 $u$ 和 $v.\{ \left( {u, w}\right)$ 的邻居原子:$w \in \mathcal{N}\left( u\right) \} \cup \{ \left( {v, w}\right) : w \in \mathcal{N}\left( v\right) \}$ 是键 $\left( {u, v}\right)$ 的邻居键。${\mathcal{F}}_{\text{ bond-angle }}$ 是一个具有两个线性层的MLP,用作消息聚合函数。${\mathbf{a}}_{uv}$ 是键 $\left( {u, v}\right)$ 来自邻居键的聚合特征。然后,根据公式(2)中的 ${\mathbf{a}}_{uv}$ 更新键 $\left( {u, v}\right)$ 的表示向量。
In the second stage, with the updated bond representation in $H$ , we further learn the atoms’ representation by aggregating messages from the neighboring atoms and the corresponding bond representations from $H$ . Given an atom $u$ , its representation ${\mathbf{h}}_{u}^{\left( k\right) }$ in the $k$ th iteration is formalized as
在第二阶段,利用 $H$ 中更新后的键表示,我们通过聚合来自相邻原子的消息和来自 $H$ 的相应键表示来进一步学习原子的表示。给定一个原子 $u$ ,其在第 $k$ 次迭代中的表示 ${\mathbf{h}}_{u}^{\left( k\right) }$ 形式化为
$$ {\mathbf{a}}_{u}^{\left( k\right) } = {\mathcal{F}}_{\text{ atom-bond }}^{\left( k\right) }\left( \left\{ {\left( {{\mathbf{h}}_{u}^{\left( k - 1\right) },{\mathbf{h}}_{v}^{\left( k - 1\right) },{\mathbf{h}}_{uv}^{\left( k - 1\right) }}\right) : v \in \mathcal{N}\left( u\right) }\right\} \right) , \tag{3} $$$$ {\mathbf{h}}_{u}^{\left( k\right) } = {\mathcal{W}}_{s} \times {\mathbf{h}}_{u}^{\left( k - 1\right) } + {\mathbf{a}}_{u}^{\left( k\right) }, \tag{4} $$where $\mathcal{N}\left( u\right)$ represents the neighbor atoms of atom $u.{\mathcal{F}}_{\text{ atom-bond }}$ is an MLP with two linear layers, acting as the message aggregation function. ${\mathbf{a}}_{u}$ is the atom $u$ ’s aggregated feature from neighbor atoms. The representation of $u$ is updated according to ${\mathbf{a}}_{u}$ in equation (4).
其中$\mathcal{N}\left( u\right)$表示原子$u.{\mathcal{F}}_{\text{ atom-bond }}$的邻居原子,是一个具有两个线性层的多层感知器,用作消息聚合函数。${\mathbf{a}}_{u}$是原子$u$从邻居原子聚合得到的特征。$u$的表示根据公式(4)中的${\mathbf{a}}_{u}$进行更新。
After all iterations, we calculate the molecular global representation ${\mathbf{h}}_{G}$ by summarizing and pooling over the atoms’ representation $\left\{ {\mathbf{h}}_{u}\right\} ,\forall u \in \mathcal{V}$ . We further take the input molecule $M$ ’s global representation ${\mathbf{h}}_{G}$ and atom representations $\left\{ {\mathbf{h}}_{u}\right\}$ as the input of further modules.
在所有迭代之后,我们通过对原子表示$\left\{ {\mathbf{h}}_{u}\right\} ,\forall u \in \mathcal{V}$进行汇总和池化来计算分子全局表示${\mathbf{h}}_{G}$。我们进一步将输入分子$M$的全局表示${\mathbf{h}}_{G}$和原子表示$\left\{ {\mathbf{h}}_{u}\right\}$作为进一步模块的输入。
Peak property learning module
峰属性学习模块
Our peak property learning module aims to fuse the atom representation features and extract the key features with peak property information. We apply the transformer encoder as the fusion model due to its powerful feature fusion capability enabled by its cross-attention structure. Specifically, for molecule $M$ , we first random initialize a set of tokens ${\left\{ {\mathbf{Q}}_{i}\right\} }_{i = 1}^{n}$ as the peak tokens for $M$ . Then, we combine the peak tokens $\left\{ {\mathbf{Q}}_{i}\right\}$ with $M$ ’s global feature ${\mathbf{h}}_{G}$ and $M$ ’s atom features $\left\{ {\mathbf{h}}_{u}\right\}$ as the input tokens for transformer encoder, which is formalized as
我们的峰属性学习模块旨在融合原子表示特征并提取具有峰属性信息的关键特征。由于其交叉注意力结构具有强大的特征融合能力,我们将Transformer编码器用作融合模型。具体来说,对于分子$M$ ,我们首先随机初始化一组 tokens ${\left\{ {\mathbf{Q}}_{i}\right\} }_{i = 1}^{n}$ 作为$M$ 的峰 tokens。然后,我们将峰 tokens $\left\{ {\mathbf{Q}}_{i}\right\}$ 与$M$ 的全局特征${\mathbf{h}}_{G}$ 和$M$ 的原子特征$\left\{ {\mathbf{h}}_{u}\right\}$ 相结合,作为Transformer编码器的输入 tokens,其形式化为
$$ \left\lbrack {{\mathbf{Q}}_{j},{\mathbf{h}}_{G, j},{\mathbf{h}}_{u, j}}\right\rbrack = {\operatorname{Layer}}_{j}\left( {{\mathbf{Q}}_{j - 1},{\mathbf{h}}_{G, j - 1},{\mathbf{h}}_{u, j - 1}}\right) \tag{5} $$where Layer, represents the jth transformer encoder layer. After the cross-attention in $N$ transformer encoder layers, the ${\mathbf{Q}}_{N}$ denote the final representations for peak tokens. We get the peak number ${N}_{\mathrm{p}}$ from the molecular ground-truth ECD spectra ${\left\{ {\mathcal{P}}_{1 : j}\right\} }_{j = 1}^{{N}_{p}}$ . Thus, we extract the first ${N}_{\mathrm{p}}$ peak token features from ${\left\{ {\mathbf{Q}}_{i}\right\} }_{i = 1}^{n}$ as the peak property information of molecule $M$ .
其中Layer,表示第j个Transformer编码器层。在$N$ 个Transformer编码器层中的交叉注意力之后,${\mathbf{Q}}_{N}$ 表示峰 tokens的最终表示。我们从分子的真实ECD光谱${\left\{ {\mathcal{P}}_{1 : j}\right\} }_{j = 1}^{{N}_{p}}$ 中得到峰数${N}_{\mathrm{p}}$ 。因此,我们从${\left\{ {\mathbf{Q}}_{i}\right\} }_{i = 1}^{n}$ 中提取前${N}_{\mathrm{p}}$ 个峰token特征作为分子$M$ 的峰属性信息。
Peak property prediction module
峰属性预测模块
Our peak property prediction module aims to reconstruct the peak property, including the peak number, peak symbol and peak position, from the output features of the peak property learning module. For the peak number prediction, we apply the two-layer MLP to predict the peak number from the molecule global feature ${\mathbf{h}}_{G}$ , which is formalized as
我们的峰属性预测模块旨在从峰属性学习模块的输出特征中重建峰属性,包括峰数、峰符号和峰位置。对于峰数预测,我们应用两层MLP从分子全局特征${\mathbf{h}}_{G}$预测峰数,其形式化为
$$ {\mathcal{P}}_{\text{ num }} = \operatorname{Linear}\left( {\operatorname{ReLU}\left( {\operatorname{Linear}\left( {\mathbf{h}}_{G}\right) }\right) }\right) , \tag{6} $$where ${\mathcal{P}}_{\text{ num }}$ represents the peak number for the ECD spectra of molecule $M$ . For peak height ${\mathcal{P}}_{\text{ height }}$ and peak position ${\mathcal{P}}_{\text{ pos }}$ . we also apply two separate two-layer MLPs to predict ${\mathcal{P}}_{\text{ symbol }}$ and ${\mathcal{P}}_{\text{ pos }}$ from the corresponding peak token ${\mathbf{Q}}_{i}$ from ${\left\{ {\mathbf{Q}}_{i}\right\} }_{i = 1}^{n}$
其中${\mathcal{P}}_{\text{ num }}$表示分子$M$的ECD光谱的峰数。对于峰高${\mathcal{P}}_{\text{ height }}$和峰位置${\mathcal{P}}_{\text{ pos }}$,我们还应用两个单独的两层MLP从来自${\left\{ {\mathbf{Q}}_{i}\right\} }_{i = 1}^{n}$的相应峰令牌${\mathbf{Q}}_{i}$预测${\mathcal{P}}_{\text{ symbol }}$和${\mathcal{P}}_{\text{ pos }}$
$$ {\mathcal{P}}_{\text{ pos }} = \operatorname{Linear}\left( {\operatorname{ReLU}\left( {\operatorname{Linear}\left( {\mathbf{Q}}_{i}\right) }\right) }\right) , \tag{7} $$$$ {\mathcal{P}}_{\text{ symbol }} = \operatorname{Linear}\left( {\operatorname{ReLU}\left( {\operatorname{Linear}\left( {\mathbf{Q}}_{i}\right) }\right) }\right) . \tag{8} $$Here, we predict all three peak properties that are vital for ECD spectra prediction.
在这里,我们预测对ECD光谱预测至关重要的所有三个峰属性。
ECD spectrum rendering module
ECD光谱渲染模块
The final module, the ECD spectrum rendering module, aims to render the predicted ECD spectra from the abstract peak properties. We use the Gaussian noise distribution model to fit the spectral curve. Specifically, given the position ${l}_{\mathrm{p}}$ and the corresponding height ${l}_{\mathrm{h}}$ of a peak, we set a Gaussian noise distribution with mean value: $\mu = {l}_{\mathrm{p}}$ and a standard deviation of $\sigma = {l}_{\mathrm{h}}$ . We then extract the distribution range of $\left\lbrack {\mu - {6\sigma },\mu + {6\sigma }}\right\rbrack$ as the fitting curve for the peak. We render the predicted ECD spectra for molecule $M$ by combining the fitting curves of all predicted peaks.
最后一个模块,即ECD光谱渲染模块,旨在根据抽象的峰属性渲染预测的ECD光谱。我们使用高斯噪声分布模型来拟合光谱曲线。具体来说,给定一个峰的位置${l}_{\mathrm{p}}$和相应的高度${l}_{\mathrm{h}}$,我们设置一个均值为$\mu = {l}_{\mathrm{p}}$、标准差为$\sigma = {l}_{\mathrm{h}}$的高斯噪声分布。然后,我们提取$\left\lbrack {\mu - {6\sigma },\mu + {6\sigma }}\right\rbrack$的分布范围作为该峰的拟合曲线。我们通过组合所有预测峰的拟合曲线来渲染分子$M$的预测ECD光谱。
Experimental settings and training hyperparameters
实验设置和训练超参数
In the molecular feature extraction module, we set the number of GINConv in GeoGNN to be 5 and the graph pooling strategy to be summation. The embedding dimension of molecular features is 128 , and the batch size for ECDFormer is 256. We apply the AdamW ${}^{48}$ optimizer implemented in Pytorch. The learning rate is $1{\mathrm{e}}^{-3}$ . For better convergence, we apply the StepLR schedular with a decreasing rate of 0.25 to adaptively adjust the learning rate. During training, the CMCDS dataset is randomly divided into 90, 5 and 5 respectively for train, valid and test splits. ECDFormer is trained with 1,000 epochs, selecting the best valid checkpoint for the testing procedure. For other deep-learning baselines, we apply a learning rate of $5{\mathrm{e}}^{-4}$ and epoch of 800, while other parameters are the same as ECDFormer.
在分子特征提取模块中,我们将GeoGNN中的GINConv数量设置为5,并将图池化策略设置为求和。分子特征的嵌入维度为128,ECDFormer的批量大小为256。我们应用Pytorch中实现的AdamW ${}^{48}$优化器。学习率为$1{\mathrm{e}}^{-3}$。为了更好地收敛,我们应用步长衰减率为0.25的StepLR调度器来自适应调整学习率。在训练期间,CMCDS数据集被随机分为90、5和5,分别用于训练、验证和测试分割。ECDFormer训练1000个epoch,为测试过程选择最佳的验证检查点。对于其他深度学习基线,我们应用学习率$5{\mathrm{e}}^{-4}$和800个epoch,而其他参数与ECDFormer相同。
Data availability
数据可用性
The first large-scale ECD spectra dataset for chiral molecules, the CMCDS dataset, is available via figshare at https://doi.org/10.6084/ m9.figshare.27763119.v1 (ref. 49). Source data are provided with this paper.
首个用于手性分子的大规模ECD光谱数据集,即CMCDS数据集,可通过figshare获取,网址为https://doi.org/10.6084/m9.figshare.27763119.v1(参考文献49)。本文提供了源数据。
Code availability
代码可用性
All code used in data analysis and preparation of the manuscript, alongside a description of necessary steps for reproducing results, is available via GitHub at https://github.com/HowardLi1984/ECDFormer (ref. 50) and Zenodo at https://doi.org/10.5281/zenodo.14172585 (ref. 51).
数据分析和稿件准备中使用的所有代码,以及重现结果所需步骤的说明,可通过GitHub(https://github.com/HowardLi1984/ECDFormer (参考文献50))和Zenodo(https://doi.org/10.5281/zenodo.14172585 (参考文献51))获取。
References
参考文献
Noyori, R. Asymmetric catalysis: science and opportunities (Nobel lecture). Angew. Chem. Int. Ed. Engl. 41, 2008-2022 (2002).
Mukherjee, S. The 2021 Nobel Prize in Chemistry: asymmetric catalysis with small organic molecules. Curr. Sci. 121, 1148 (2021).
Amabilino, D. B. & Veciana, J. Supramolecular chiral functional materials. Supramol. Chiral 265, 253-302 (2006).
Shen, B., Kim, Y. & Lee, M. Supramolecular chiral 2D materials and emerging functions. Adv. Mater. 32, 1905669 (2020).
Teng, Y. et al. Advances and applications of chiral resolution in pharmaceutical field. Chirality 34, 1094-1119 (2022).
Lininger, A. et al. Chirality in light-matter interaction. Adv. Mater. 35, 2107325 (2023).
Evers, F. et al. Theory of chirality induced spin selectivity: progress and challenges. Adv. Mater. 34, 2106629 (2022).
Ye, S. et al. A machine learning protocol for predicting protein infrared spectra. J. Am. Chem. Soc. 142, 19071-19077 (2020).
Zou, Z. et al. A deep learning model for predicting selected organic molecular spectra. Nat. Comput. Sci. 3, 957-964 (2023).
Ghosh, K. et al. Deep learning spectroscopy: neural networks for molecular excitation spectra. Adv. Mater. 6, 1801367 (2019).
Park, J., Jo, J. & Yoon, S. Mass spectra prediction with structural motif-based graph neural networks. Sci. Rep. 14, 1400 (2024).
Young, A., Røst, H. & Wang, B. Tandem mass spectrum prediction for small molecules using graph transformers. Nat. Mach. Intell. 6, 404-416 (2024).
Goldman, S., Bradshaw, J., Xin, J. & Coley, C. Prefix-tree decoding for predicting mass spectra from molecules. Adv. Neural Inform. Process. Syst. 36, 48548-48572 (2023).
Xu, H., Lin, J., Zhang, D. & Mo, F. Retention time prediction for chromatographic enantioseparation by quantile geometry-enhanced graph neural network. Nat. Commun. 14, 3095 (2023).
Li, J., Li, D., Savarese, S. & Hoi, S. Blip-2: bootstrapping language-image pre-training with frozen image encoders and large language models. ICML 19730-19742 (2023).
Zhang, H., Qi, A. & Li, R. Traceability and development of optical activity and chiroptical spectroscopy. Daxue Huaxue 37, 2105009 (2021).
Frisch, M. J., Trucks, G. W. & Schlegel, H. B. Gaussian ~ 16 Revision A.03 (Gaussian, 2016).
Stephens, P. J., Devlin, F. J., Chabalowski, C. F. & Frisch, M. J. Ab initio calculation of vibrational absorption and circular dichroism spectra using density functional force fields. J. Phys. Chem. 98, 11623-11627 (1994).
Yanai, T., Tew, D. P. & Handy, N. C. A new hybrid exchange-correlation functional using the Coulomb-attenuating method (CAM-B3LYP). Chem. Phys. Lett. 393, 51-57 (2004).
Rogers, D. M. et al. Electronic circular dichroism spectroscopy of proteins. Chem. 5, 2751-2774 (2019).
Mao, A., Mohri, M. & Zhong, Y. Cross-entropy loss functions: theoretical analysis and applications. Int. Conf. Mach. Learn. 23803-23828 (2023).
Nagy, G., Igaev, M., Jones, N. C., Hoffmann, S. V. & Grubmuller, H. SESCA: predicting circular dichroism spectra from protein molecular structures. J. Chem. Theory Comput. 15, 5087-5102 (2019).
Micsonai, A., Bulyáki, É. & Kardos, J. BeStSel: from secondary structure analysis to protein fold prediction by circular dichroism spectroscopy. Methods Mol. Biol. https://doi.org/10.1007/978-1- 0716-0892-0_11 (2021).
Zhao, L. et al. Accurate machine learning prediction of protein circular dichroism spectra with embedded density descriptors. JACS Au. 1, 2377-2384 (2021).
Artrith, N. et al. Best practices in machine learning for chemistry. Nat. Chem. 13, 505-508 (2021).
Wei, J. et al. Machine learning in materials science. InfoMat. 1, 338-358 (2019).
Shi, X. et al. Convolutional LSTM network: a machine learning approach for precipitation nowcasting. Adv. Neural Inform. Process. Syst. 28, 802-810 (2015).
Chung, J., Gulcehre, C., Cho, K. & Bengio, Y. Empirical evaluation of gated recurrent neural networks on sequence modeling. Ada. Neural Inform. Process. Syst. 26, 756-764 (2014).
Article
文章
Vaswani, A. Attention is all you need. Adv. Neural Inform. Process. Syst. 30, 6000-6010 (2017).
Xu, W. F. et al. 17-Hydroxybrevianamide N and its N1-methyl derivative, quinazolinones from a soft-coral-derived Aspergillus sp. fungus: 13S enantiomers as the true natural products. J. Nat. Prod. 84, 1353-1358 (2021).
Tu, W. C. et al. Wulfenioidins D-N, structurally diverse diterpenoids with anti-Zika virus activity isolated from Orthosiphon wulfenioides. J. Nat. Prod. 86, 2348-2359 (2023).
Lam, Y. T. et al. Purpurascenines A-C, azepino-indole alkaloids from cortinarius purpurascens: isolation, biosynthesis, and activity studies on the 5-HT ${}_{2\mathrm{\;A}}$ receptor. J. Nat. Prod. 86,1373-1384 (2023).
Liu, F. et al. Anti-inflammatory quinoline alkaloids from the roots of Waltheria indica. J. Nat. Prod. 86, 276-289 (2023).
Wallace, W. E., Ji, W., Tchekhovskoi, D. V., Phinney, K. W. & Stein, S. E. Mass spectral library quality assurance by inter-library comparison. J. Am. Soc. Mass Spectrom. 28, 733-738 (2017).
Zhang, S., Tong, H., Xu, J. & Maciejewski, R. Graph convolutional networks: a comprehensive review. Comput. Soc. Netw. 6, 1-23 (2019).
Mahmood, O., Mansimov, E., Bonneau, R. & Cho, K. Masked graph modeling for molecule generation. Nat. Commun. 12, 3156 (2021).
Zhong, W., Yang, Z. & Chen, C. Y. C. Retrosynthesis prediction using an end-to-end graph generative architecture for molecular graph editing. Nat. Commun. 14, 3009 (2023).
Wang, Y. et al. Retrosynthesis prediction with an interpretable deep-learning framework based on molecular assembly tasks. Nat. Commun. 14, 6155 (2023).
Chen, Z. et al. Multi-granularity score-based generative framework enables efficient inverse design of complex organics. Preprint at https://arxiv.org/abs/2409.07912 (2024).
Han, K. et al. A survey on vision transformer. IEEE Trans. Pattern Anal. 45, 87-110 (2022).
Li, H., Jia, C., Jin, P., Cheng, Z., Li, K., Sui, J. & Yuan, L. Freestyleret: retrieving images from style-diversified queries. Eur. Conf. Comput. Vis. 81, 258-274 (2024).
Li, H. et al. Weakly-supervised 3D spatial reasoning for text-based visual question answering. IEEE Trans. Image Process. 32, 3367-3382 (2023).
Fang, X. et al. Geometry-enhanced molecular representation learning for property prediction. Nat. Mach. Intell. 4, 127-134 (2022).
Peng, Y. et al. Enhanced graph isomorphism network for molecular admet properties prediction. IEEE Access. 8, 168344-168360 (2020).
Li, H., Li, X., Karimi, B., Chen, J. & Sun, M. Joint learning of object graph and relation graph for visual question answering. Int. Conf. Multimedia Expo. 1-6 (2022).
Zhu, X., Su, W., Lu, L., Li, B., Wang, X. & Dai, J. Deformable DETR: deformable transformers for end-to-end object detection. In International Conference on Learning Representations 2021 https://openreview.net/pdf?id=gZ9hCDWe6ke (ICLR, 2021).
Luong, K. D. & Singh, A. Application of transformers in cheminformatics. J. Chem. Inf. Model. 64, 4392-4409 (2024).
Kingma, D. P. & Ba, J. Adam: a method for stochastic optimization. Preprint at https://arxiv.org/abs/1412.6980 (2014).
Li, H. et al. Public data files for CMCDS dataset. figshare https://doi.org/10.6084/m9.figshare.27763119.v1 (2024).
Li, H. et al. Public code for ECDFormer. GitHub https://github.com/HowardLi1984/ECDFormer (2024).
Li, H. et al. Public code for ECDFormer v1.0.0 Zenodo. Zenodo https://doi.org/10.5281/zenodo.14172585 (2024).
李,H. 等人。ECDFormer v1.0.0的公开代码。Zenodo。Zenodo https://doi.org/10.5281/zenodo.14172585 (2024)。
Acknowledgements
致谢
We acknowledge the financial support from the Natural Science Foundation of China (nos. 62202014, 62332002, 62425101, 62425101, 62088102, 22272133, 21971217, 22150013, 22071004 and 21933001), Shenzhen Basic Research Program (no. JCYJ20220813151736001) and the Fundamental Research Funds for the Central Universities (nos. 20720240053 and 20720240070). F.M. thanks Peking University Shenzhen Graduate School and Shenzhen Government for the start-up funding support. We thank the High-Performance Computing Platform of Peking University for machine learning model training. We also extend our gratitude to all the reviewers for their insightful and constructive feedback, which has greatly contributed to the enhancement of our work.
我们感谢中国国家自然科学基金(项目编号:62202014、62332002、62425101、62425101、62088102、22272133、21971217、22150013、22071004 和 21933001)、深圳市基础研究计划(项目编号:JCYJ20220813151736001)以及中央高校基本科研业务费专项资金(项目编号:20720240053 和 20720240070)的资助。F.M. 感谢北京大学深圳研究生院和深圳市政府提供的启动资金支持。我们感谢北京大学高性能计算平台为机器学习模型训练提供的支持。我们还要感谢所有审稿人提出的深刻且具有建设性的反馈,这些反馈对提升我们的工作有很大帮助。
Author contributions
作者贡献
H.L., D.L., X.W. and F.M. conceived the basic idea and designed the research study. D.L. and F.M. generated the ECD spectra dataset using DFT calculation. H.L. developed the method. L.Y. and F.M. further modified the method. D.L. and X.W. conceived the evaluation metric in the experiment. H.L. and D.L. evaluated the performance of the CMCDS dataset and natural product molecules. H.L. and D.L. wrote the manuscript. L.Y., Y.T., X.W. and F.M. revised the manuscript. Y.W. revised the figures of the manuscript. L.Y. and Y.T. provided the deep learning computing platform.
H.L., D.L., X.W. 和 F.M. 构思了基本思路并设计了研究。D.L. 和 F.M. 使用 DFT 计算生成了ECD光谱数据集。H.L. 开发了该方法。L.Y. 和 F.M. 进一步修改了该方法。D.L. 和 X.W. 构思了实验中的评估指标。H.L. 和 D.L. 评估了CMCDS数据集和天然产物分子的性能。H.L. 和 D.L. 撰写了手稿。L.Y., Y.T., X.W. 和 F.M. 对手稿进行了修订。Y.W. 对手稿的图表进行了修订。L.Y. 和 Y.T. 提供了深度学习计算平台。
Competing interests
利益冲突
The authors declare no competing interests.
作者声明无利益冲突。
Additional information
附加信息
Supplementary information The online version contains supplementary material available at https://doi.org/10.1038/s43588-024-00757-7.
补充信息 在线版本包含可在https://doi.org/10.1038/s43588-024-00757-7获取的补充材料。
Correspondence and requests for materials should be addressed to Li Yuan, Xinchang Wang or Fanyang Mo.
有关通信和材料请求应寄给袁粒、王新昌或莫凡洋。
Peer review information Nature Computational Science thanks the anonymous reviewer(s) for their contribution to the peer review of this work. Primary Handling Editor: Katilin McCardle, in collaboration with the Nature Computational Science team. Peer reviewer reports are available.
同行评审信息 《自然计算科学》感谢匿名评审员对这项工作的同行评审所做的贡献。主要处理编辑:凯蒂琳·麦卡德尔,与《自然计算科学》团队合作。可获取同行评审报告。
Reprints and permissions information is available at www.nature.com/reprints.
重印和许可信息可在www.nature.com/reprints上获取。
Publisher’s note Springer Nature remains neutral with regard to jurisdictional claims in published maps and institutional affiliations.
出版商说明 施普林格·自然对于已发表地图中的管辖权主张和机构隶属关系保持中立。
Springer Nature or its licensor (e.g. a society or other partner) holds exclusive rights to this article under a publishing agreement with the author(s) or other rightsholder(s); author self-archiving of the accepted manuscript version of this article is solely governed by the terms of such publishing agreement and applicable law.
施普林格·自然或其许可方(例如协会或其他合作伙伴)根据与作者或其他权利所有者的出版协议对本文拥有独家权利;作者自行存档本文的录用稿件版本仅受此类出版协议和适用法律的条款约束。
© The Author(s), under exclusive licence to Springer Nature America, Inc. 2025
© 作者,施普林格·自然美国公司独家许可 2025年