Cycle-MS: A Closed-Loop End-to-End Framework for Mass Spectrometry Structure Elucidation
中文 / Bilingual · English version
Jinglong Lin, Hao Li, Chengchun Liu, Zhiyuan Yan, Li Yuan, and Fanyang Mo*
Cite This: J. Chem. Inf. Model. 2026, 66, 2709-2718
ACCESS Supporting Information
ABSTRACT: Mass spectrometry (MS) is indispensable for molecular analysis; however, elucidating complex molecular structures from spectra remains a major challenge. Here, we present Cycle-MS, an end-to-end framework that unifies inverse spectrum-to-molecule prediction with forward spectrum reconstruction, with cycle-consistency losses refining latent representations. Cycle-MS demonstrates enhanced accuracy in predicting atomic compositions, molecular formulas, scaffolds, and functional groups, offering robust recovery of molecular scale and key chemical features. Interpretability analysis shows that Cycle-MS prioritizes structurally diagnostic fragments over nonspecific abundant peaks, ensuring chemical plausibility and structural reliability. Together, these advances establish Cycle-MS as a robust, accurate, and interpretable framework that offers a path toward fully automated, high-precision MS-based structure elucidation.
INTRODUCTION
Mass spectrometry (MS) is a critical analytical technique frequently coupled with chromatography, where chromatography provides sample separation, while MS primarily provides qualitative information, although quantitative analyses are also achievable. In MS, analytes are ionized and subsequently separated according to their mass-to-charge ratios $\left( {m/z}\right)$ , generating data characterized by high sensitivity and specificity, enabling researchers to elucidate the molecular composition of complex samples. Consequently, MS has become an indispensable tool in diverse fields, including metabolomics, ${}^{1 - 3}$ proteomics, ${}^{4 - 6}$ and drug detection. ${}^{7 - 9}$ However, conventional approaches to interpreting MS data, such as rule-based methods relying on characteristic fragmentation patterns ${}^{{10},{11}}$ or database matching, ${}^{{12},{13}}$ exhibit inherent limitations. Rule-based methods are highly dependent on predefined fragmentation criteria, restricting their ability to accurately interpret complex mixtures. Database matching enables rapid analysis but is limited by database completeness and accuracy, which presents significant challenges in the identification of novel compounds.
With the rapid advancement of artificial intelligence in recent years, machine learning (ML) has become increasingly prevalent in analytical chemistry, ${}^{{14} - {20}}$ particularly in MS. ${}^{{21} - {23}}$ Beyond tasks such as spectrum denoising ${}^{24}$ and forward spectrum prediction, ${}^{{25} - {29}}$ ML-assisted MS interpretation has emerged as a key research frontier (Figure 1). In molecular formula annotation, SIRIUS ${4}^{30}$ constructs fragmentation trees and integrates isotopic patterns for precise formula prediction and feature fingerprint extraction. In the CASMI 2016 data set, it achieved a Top-1 accuracy of 93.8%. MIST-CF ${}^{31}$ offers similar capabilities, using a data-driven energy modeling approach and an enhanced Set Transformer to replace traditional fragmentation tree inference. In the CASMI 2022 challenge, MIST-CF achieved an accuracy of 86.8% for the prediction of the joint molecular formula and the adduct, which is comparable to that of SIRIUS 4. In molecular structure elucidation, MSNovelist ${}^{32}$ uses SIRIUS 4 to extract molecular formulas and fingerprints, followed by prediction of structure with LSTM. In the CASMI 2016 data set, it achieved a Top-1 accuracy of 26% and a Top- 128 coverage of 57%. CMSSP ${}^{33}$ and CSU-MS2 ${}^{34}$ are both built on cross-modal contrastive learning, in which a unified spectrum-structure embedding space is constructed to enable high-accuracy database retrieval. CMSSP typically achieves Top-10 accuracies exceeding 80%, whereas CSU-MS2 further improves representation capacity and large-scale retrieval performance. MSGo ${}^{35}$ proposes a Transformer-based molecular structure generation framework that directly infers small-molecule structures from MS/MS spectra by incorporating in silico spectra and probabilistically guided masking strategies. Spec2Mol ${}^{36}$ represents the first end-to-end framework that directly predicts molecular SMILES from MS/MS spectra. However, in the NIST 2020 data set, Spec2Mol achieved a Top- 1 accuracy of only 7% and is currently limited to analyzing the precursor ions ${\left\lbrack \mathrm{M} + \mathrm{H}\right\rbrack }^{ + }$ and ${\left\lbrack \mathrm{M} - \mathrm{H}\right\rbrack }^{ - }$ . In recent years, diffusion-based approaches to mass-spectrometry-driven structure elucidation have attracted growing interest. DiffNovo ${}^{37}$ and DiffMS ${}^{38}$ formulate spectrum-to-structure inference as a conditional diffusion process and, through iterative denoising and structural refinement, outperform conventional sequence-to-sequence methods (e.g., Spec2Mol) in terms of chemical plausibility and structural similarity.
Received: December 7, 2025
Revised: January 30, 2026
Accepted: February 18, 2026
Published: February 25, 2026
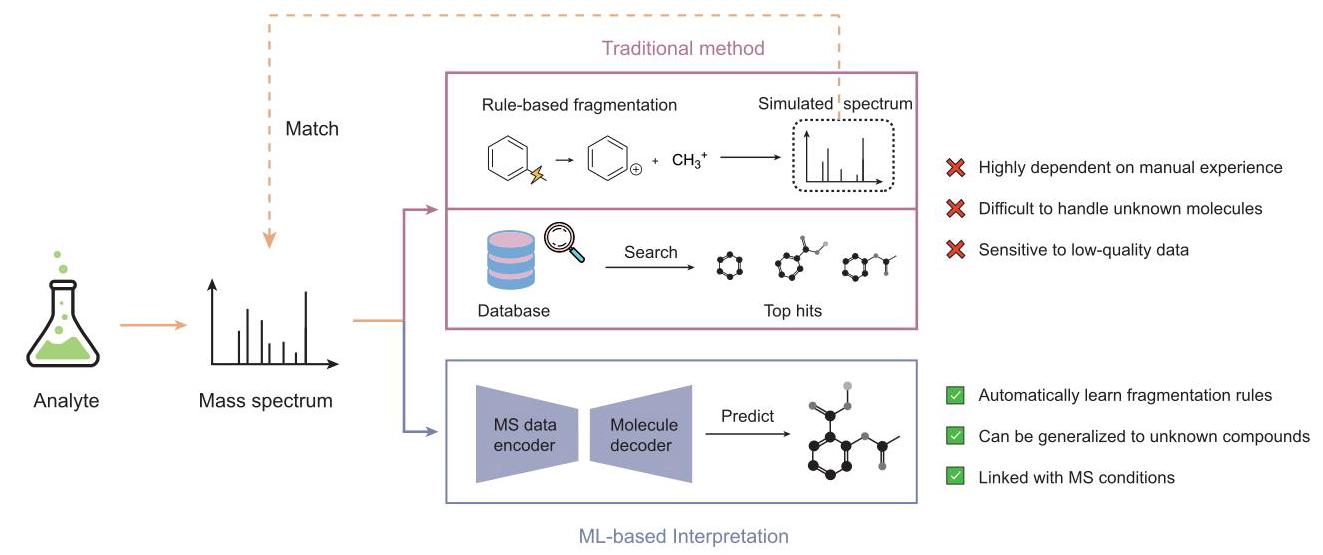
Figure 1. Comparison of traditional and ML-based mass spectrometry interpretation methods. Traditional MS interpretation relies on rule-based fragmentation and database search, which are constrained by expert dependence and limited robustness to noise. ML-based approaches learn from data, predict structures directly, and generalize across diverse experimental conditions.
Despite progress in molecular formula annotation and structural elucidation, achieving high-precision, end-to-end mass spectrometry interpretation remains an outstanding challenge. The main contributions of this work are as follows.
We present Cycle-MS, a novel end-to-end framework that directly predicts molecular structures from a single MS/ MS spectrum without relying on external fragmentation tools. Unlike prior approaches, Cycle-MS integrates spectrum-to-molecule inference and molecule-to-spectrum reconstruction within a unified architecture, guided by a cycle-consistency loss that regularizes and refines the latent representation. The inverse path employs a Transformer-based spectrum encoder and a molecular decoder, augmented with molecular weight constraints and functional group-aware pruning during beam search to enhance generation precision and efficiency. The forward path utilizes a geometry-enhanced graph isomorphism network to encode molecular structures and an MLP to decode the corresponding spectra.
We compared Cycle-MS with representative baseline models, and the results consistently demonstrate superior performance across key molecular-level metrics, including atom count accuracy, molecular formula fidelity, and scaffold similarity. Additionally, we conducted comprehensive ablation studies, which revealed the significant impact of cycle training, experimental metadata, and pruning strategies on improving model performance.
To investigate the interpretability of the model, we analyze latent embeddings derived from the spectrum encoder, which exhibit clear clustering patterns corresponding to molecular weight scales. Furthermore, SHAP-based attribution analysis reveals that Cycle-MS preferentially leverages structurally informative fragments rather than merely abundant but uninformative peaks, thereby reinforcing both the chemical validity and structural accuracy of the predicted molecules.
BRESULTS AND DISCUSSION
Data Set Construction and Preprocessing
The dataset used in this study was derived from the high-resolution tandem mass spectrometry (HR-MS/MS) subset of the NIST 20 mass spectral library. To ensure data quality, molecules with molecular weights above 700 Da, spectra containing fewer than three fragment peaks, and entries lacking valid SMILES annotations were excluded, resulting in a curated dataset of 689,467 spectra with high mass accuracy. The molecular-weight distribution of the molecules in the dataset is shown in Figure S1. To ensure the consistency and uniqueness of molecular representations, standardized SMILES strings were extracted for each compound and tokenized at the substructure level using a pretrained SentencePiece model with a vocabulary size of 300. This tokenization of substructures eliminates redundant molecular encodings and improves the generalizability of the model in structurally diverse compounds by capturing frequent functional groups and scaffolds. For model input construction, each MS/MS spectrum was converted into a fixed-length sequence of ${64}\left( {\mathrm{\;m}/\mathrm{z}}\right.$ , intensity) pairs. In cases where more than 64 fragment peaks were present, only the top 64 peaks ranked by intensity were retained; spectra with fewer peaks were zero-padded. All $m/z$ and intensity values were normalized using the global mean and variance calculated from the training set to ensure statistical consistency across inputs.
In the molecule-to-spectrum prediction task, continuous MS/ MS data were discretized by partitioning the $m/z$ range (40- 600 Da) into 561 evenly spaced 1 Da bins. A ${\log }_{10}$ transformation was applied to the binned intensities to compress the dynamic range and reduce the dominance of high-intensity peaks. To improve model robustness under diverse experimental setups, associated metadata were incorporated as auxiliary inputs, including both categorical and continuous features. Categorical variables, ionization mode (positive/negative), instrument type (Fourier-transform mass spectrometry, FT-MS; quadrupole time-of-flight, QTOF), and fragmentation method (collision-induced dissociation, CID; higher energy collisional dissociation, HCD) were encoded with one heat into a six-dimensional binary vector. Continuous features included the normalized collision energy $\left( {NCE}\right)$ and precursor mass $M$ , which was inferred from the precursor $m/z$ and ion type. Given the large number of precursor ion types (3855 in total), these were treated as categorical indices and embedded as trainable vectors.
aromaticity
Latent space
degree
implicit valence
bond direction bond type in ring or not
explicit valence
chiral tag
topological polar surface area (TPSA)
moran coefficient (MATS)
Motecular
relative hydrophobic surface area (RASA)
descriptors
molecular distance edge (MEDC)
relative polar surface area (RPSA)
Angle features
————-
bond angle
Molecule Consistency Loss
Bond-angle graph (3D spatial geometry) –>
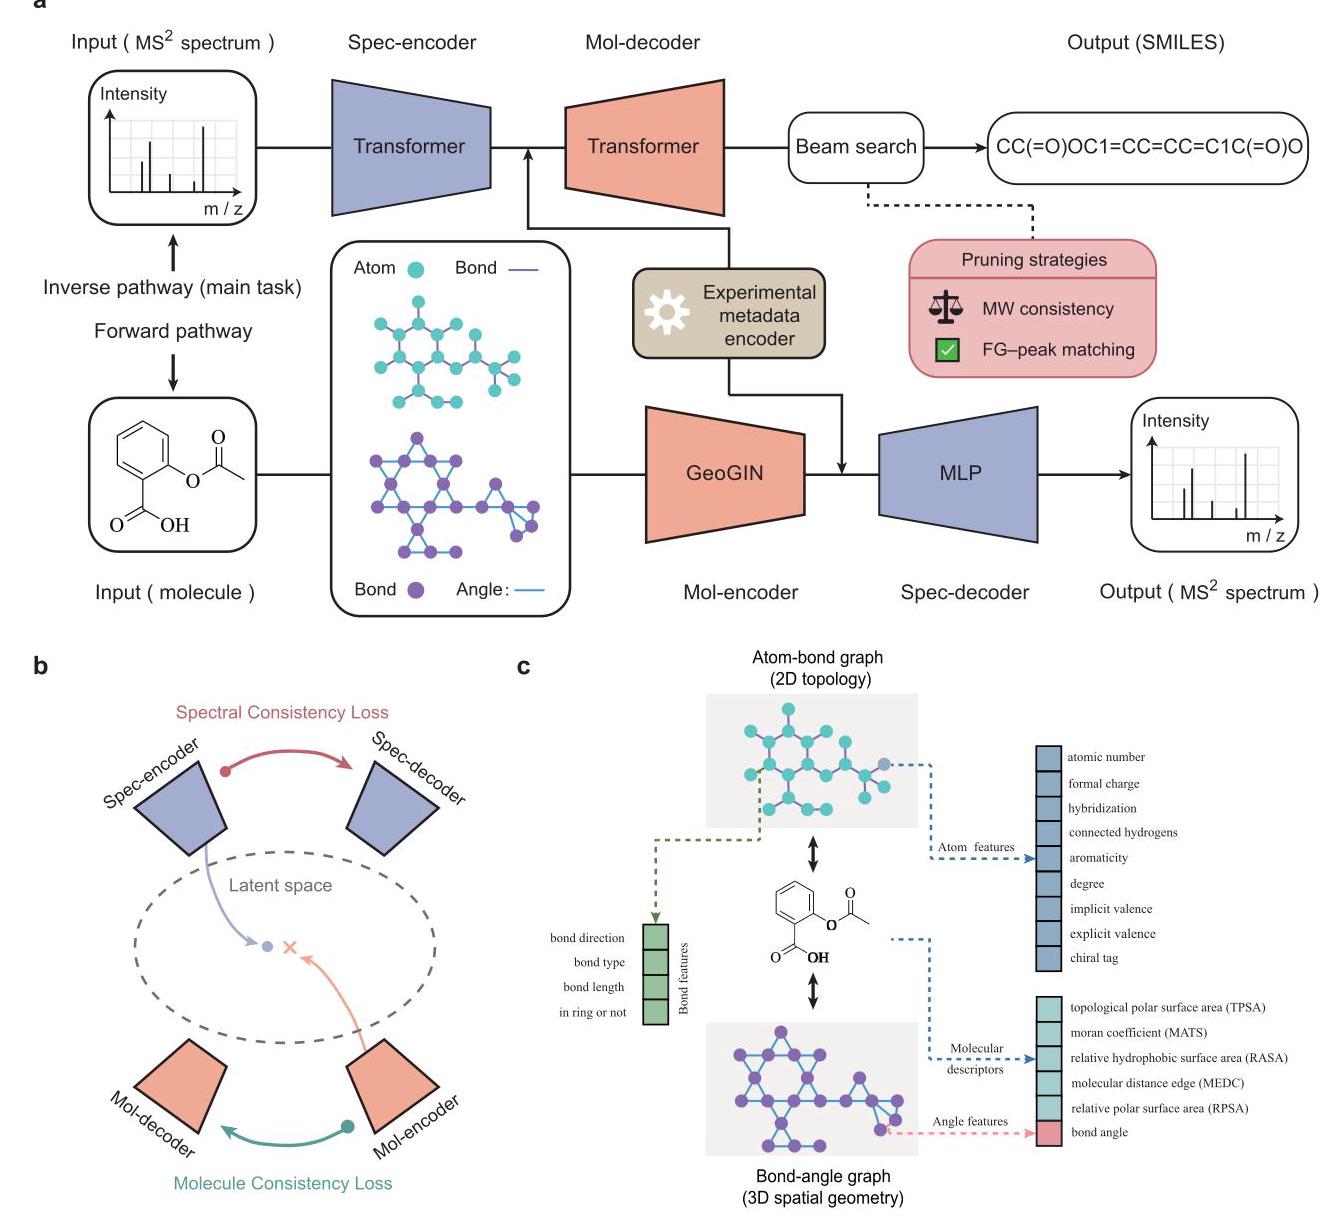
Figure 2. Schematic of Cycle-MS architecture and training strategy.(a) Inverse mass spectrum-molecule prediction (main task) employs a Transformer-based mass spectrum encoder and a molecular decoder, while the forward pathway (auxiliary task) applies a GeoGIN molecular encoder and an MLP-based mass spectrum decoder. (b) Spectral and molecular consistency losses enforce latent space alignment under a decoupled training strategy. (c) Node and edge embeddings in atom-bond and bond-angle graphs capture atomic, bonding, angular, and physicochemical descriptors, providing a comprehensive molecular representation.
Model Architecture and Training Strategy
The Cycle-MS architecture comprises two complementary pathways for inverse and forward prediction, built upon five core modules: a spectrum encoder, a spectrum decoder, a molecular encoder, a molecular decoder, and an experimental metadata encoder (Figure 2a). This dual-path design enables the model to learn bidirectional mappings between molecular structures and their tandem mass spectra while incorporating experimental information to improve generalizability across heterogeneous acquisition conditions. The metadata encoder processes the continuous variables $M$ and NCE by independently projecting them into high-dimensional latent spaces using dedicated MLP. The precursor ion type, treated as a categorical variable, is embedded through a trainable embedding layer to capture its impact on fragmentation behavior. These three feature representations are then integrated and passed through an attention-based fusion module, which dynamically adjusts the contribution of each input via learnable weights, yielding a unified conditional representation denoted as ${F}_{1}$ . In parallel, six one-hot encoded experimental parameters, such as ionization mode, instrument type, and fragmentation method, are processed by a separate MLP to produce another condition vector, ${F}_{2}$ , whereas ${F}_{1}$ emphasizes fine-grained physicochemical effects from continuous variables, and ${F}_{2}$ encodes coarser, protocol-level information reflecting the experimental platform. The combined representations ${F}_{1}$ and ${F}_{2}$ are provided as auxiliary priors to the molecular and spectral decoders, thus constraining the generative process in specific experimental settings.
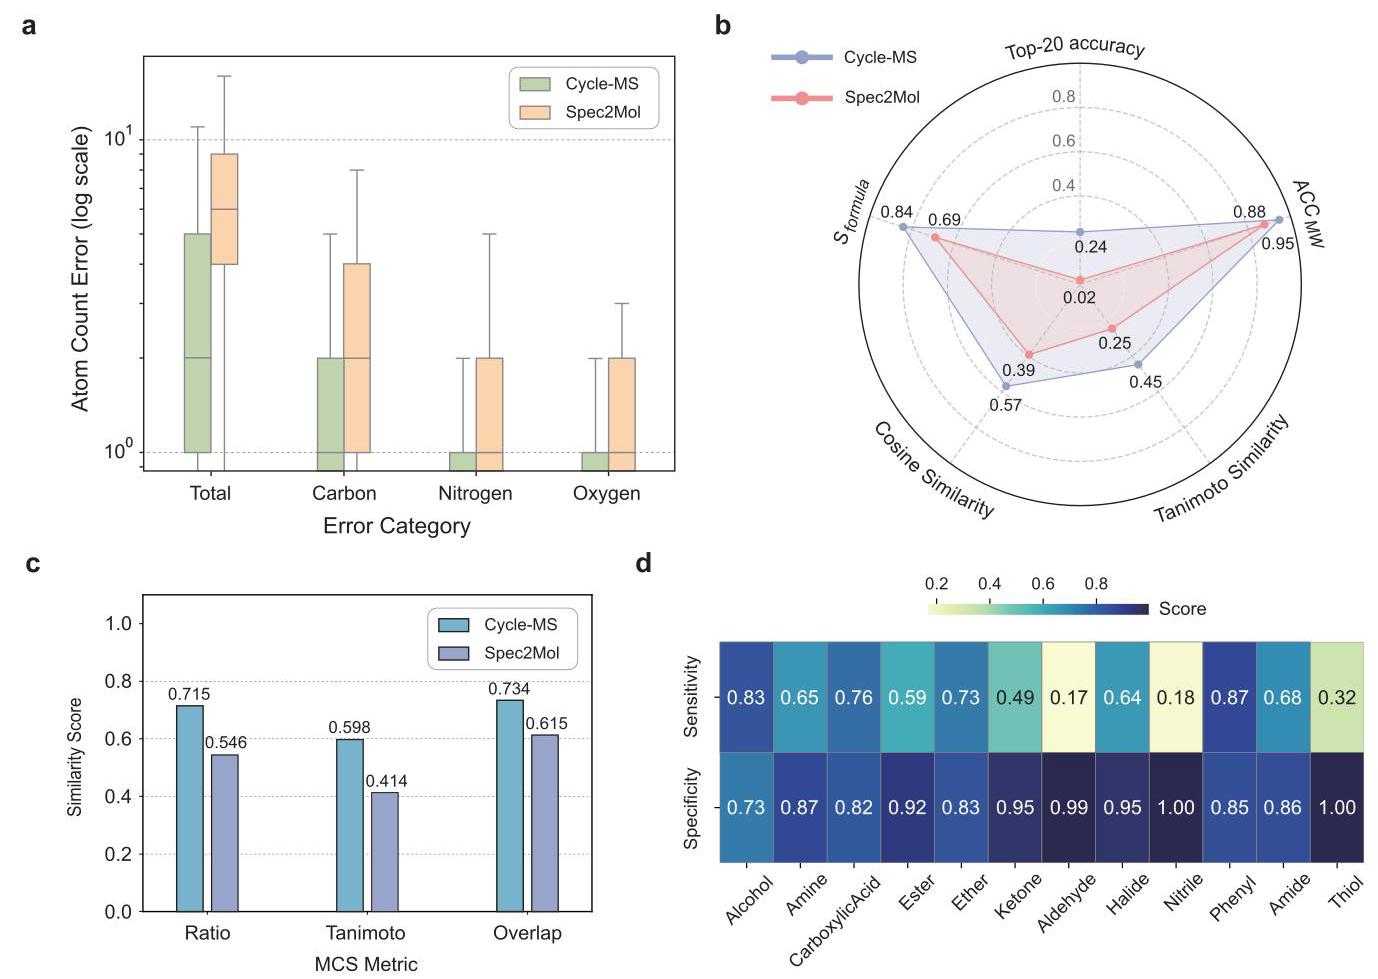
Figure 3. Comparative evaluation of Cycle-MS and Spec2Mol. (a) Atom-count prediction errors for total atoms, carbon, nitrogen, and oxygen. Cycle-MS shows consistently lower errors than that of Spec2Mol, especially for total and carbon counts. (b) Radar plot of molecular-level metrics. Cycle-MS achieves higher scores across all measures, reflecting a more faithful molecular reconstruction. (c) Maximum common substructure (MCS) analysis, where Cycle-MS attains higher ratio, Tanimoto, and overlap values. (d) Functional-group prediction performance. Cycle-MS maintains strong sensitivity and specificity for frequent groups, while sensitivity decreases for rare groups, though specificity remains high.
In the reverse prediction pathway of Cycle-MS, the spectrum encoder is constructed using a two-layer Transformer with dual-head self-attention and rotary positional encoding. This encoding scheme injects relative positional information into the sequence of fragment peak pairs sorted by $m/z$ , thereby enhancing the model’s capacity to represent spectral sequences. The encoded spectral representation is integrated with condition vectors ${F}_{1}$ and ${F}_{2}$ , which are derived from experimental metadata encoders. The fused features are passed through two residual blocks, each comprising fully connected layers, ReLU activation, and dropout regularization, to capture higher-order interactions between spectral and metadata information. The residual architecture facilitates gradient flow and stabilizes feature fusion across modalities. The resulting high-dimensional representation is then input into a three-layer Transformer decoder with four-head self-attention. This decoder generates the target SMILES sequence in an autoregressive manner, mapping spectral inputs to molecular structures. However, due to the presence of noise in mass spectrometric data, direct autoregressive decoding may yield chemically implausible or structurally invalid molecules. To improve the fidelity of structure generation, we introduced two pruning strategies during beam search decoding. The first is a molecular mass consistency constraint. Candidate sequences are discarded if their inferred molecular mass deviates beyond the tolerance range of the experimentally measured precursor ion mass. The second is a functional group-peak matching constraint. The Gemini-2.5 Pro large language model is employed to predict fragment $m/z$ values characteristic of common functional groups in each candidate; the corresponding prompts are provided in SI-2. Candidates are discarded if none of these predicted peaks are observed in the experimental spectrum. Together, these constraints effectively eliminate invalid structures, thereby improving the accuracy and reliability of de novo molecular structure elucidation from mass spectrometry.
In the auxiliary forward prediction pathway of Cycle-MS, molecular structures are formalized as graph representations to leverage their inherent graph nature. ${}^{{39} - {42}}$ Given the high sensitivity of mass spectrometry to subtle structural variations, we introduce two complementary graph representations to jointly capture the topological and three-dimensional geometric features of a molecule (Figure 2c): the atom-bond graph and the bond-angle graph. The atom-bond graph defines each atom as a node and each bond as an edge. Node features include formal charge, implicit valence, hybridization, and aromaticity, while edge features encode bond types and ring membership. This representation models molecular connectivity. The bond-angle graph, by contrast, treats bonds as nodes and connects pairs of bonds that share a common atom, thereby forming bond angles. Each edge in this graph corresponds to a real spatial angle and is annotated with its angle value together with a set of spatial and molecular descriptors, such as topological polar surface area (TPSA) and relative polar surface area (RPSA). To effectively integrate the rich structural and geometric information from both graphs, we employ a five-layer Geometry-Enhanced Graph Isomorphism Network (GeoGIN) as the molecular encoder. Unlike conventional graph neural networks such as GCN and GAT, GeoGIN introduces geometry-aware modulation into the message passing process, enabling the model to simultaneously consider topological adjacency and spatial directionality when updating node representations. After encoding, representations from the atom-bond and bond-angle graphs are fused and aggregated using global sum pooling to yield the final molecular embedding. This embedding is then concatenated with two condition vectors, ${F}_{1}$ and ${F}_{2}$ , derived from the experimental metadata encoders, producing a high-dimensional molecular representation tailored to the specific experimental context. Finally, the fused representation is passed into a three-layer multilayer perceptron spectrum decoder, which outputs predicted intensity distributions across 561 discrete $m/z$ bins ranging from 40 to 600 Da.
To enhance the representational capacity of Cycle-MS and preserve semantic-structural alignment in the latent space, we introduce two auxiliary tasks-spectrum-to-spectrum and molecule-to-molecule reconstruction-optimized via a decoupled training strategy (Figure 2b). For spectrum reconstruction, the spectrum encoder-decoder pair is loaded, and only the self-reconstruction loss is optimized. This encourages the encoder to learn informative representations of fragment intensity distributions and global spectral features. To mitigate overfitting and reward hacking, the fixed molecule decoder is incorporated to impose structural constraints, ensuring that spectral embeddings retain chemically meaningful semantics. In parallel, the molecule reconstruction task employs a frozen spectrum decoder while optimizing the molecular self-reconstruction loss, guiding the model to recover the original molecular structure from its latent representation. The frozen spectrum decoder acts as a mass spectral prior, promoting consistency across modalities. After training both tasks, we alternated forward and backward training paths to reinforce cycle consistency between the structural and spectral representations. This strategy improves the expressiveness and stability of the latent space, thereby enhancing convergence and accuracy in cross-modal prediction.
Model Performance Evaluation
Given that Cycle-MS is an end-to-end prediction model, we selected Spec2Mol, a representative end-to-end model for mass spectrometry interpretation, as the baseline. Spec2Mol requires four tandem MS spectra to infer a target molecule, whereas Cycle-MS needs only one. To ensure a fair comparison, we preprocessed the HR-MS/MS data set to extract a subset compatible with the input format of Spec2Mol and evaluated both models on this subset. Figure 3a compares the atom-count prediction errors of Cycle-MS and Spec2Mol. Cycle-MS consistently outperforms Spec2Mol across all categories (total atoms, carbon, nitrogen, and oxygen), with lower median errors and reduced variability. The advantage is most pronounced for total atom and carbon counts, underscoring its robustness in capturing molecular scale and backbone composition. Figure 3b compares Cycle-MS and Spec2Mol across multiple evaluation metrics. Overall, Cycle-MS significantly outperforms Spec2Mol in most categories, demonstrating greater robustness in molecular structure interpretation. ${S}_{\text{ formula }}$ is defined by comparing elemental counts between the predicted and true molecular formulas:
$$ {S}_{\text{ formula }} = \frac{\mathop{\sum }\limits_{{i \in E}}\min \left( {{c}_{i}^{\text{ pred }},{c}_{i}^{\text{ true }}}\right) }{\mathop{\sum }\limits_{{i \in E}}\max \left( {{c}_{i}^{\text{ pred }},{c}_{i}^{\text{ true }}}\right) } \tag{1} $$where $E$ denotes the set of elements, and ${c}_{i}^{\text{ pred }}$ and ${c}_{i}^{\text{ true }}$ represent the counts of element $i$ in the predicted and true formulas, respectively. Cycle-MS achieves a score of 0.84 , notably higher than Spec2Mol’s 0.69, indicating superior accuracy in recovering elemental composition. ${\mathrm{{ACC}}}_{\mathrm{{MW}}}$ is defined as the complement of the relative molecular weight error:
$$ {\mathrm{{ACC}}}_{\mathrm{{MW}}} = 1 - \frac{\left| {\mathrm{{MW}}}_{\text{ pred }} - {\mathrm{{MW}}}_{\text{ true }}\right| }{{\mathrm{{MW}}}_{\text{ true }}} \tag{2} $$Cycle-MS and Spec2Mol achieve 0.95 and 0.88, respectively, reflecting comparable performance, with a slight advantage for Cycle-MS. For structural similarity, Cycle-MS achieves 0.45 in fingerprint-based Tanimoto similarity, substantially higher than Spec2Mol’s 0.25. At the molecular level, prediction accuracy is assessed using Top-20 accuracy, where the correct molecule must appear among the top 20 candidates. Cycle-MS attains 0.24, an order of magnitude greater than Spec2Mol’s 0.02. Although absolute values remain modest, the substantial relative gains highlight Cycle-MS’s potential for chemically faithful molecular reconstruction. Figure 3c shows the similarity analysis based on the maximum common substructure (MCS), evaluated using three metrics: ratio, Tanimoto, and overlap. Respectively, these metrics capture the coverage of the true molecule by the prediction, the balance between shared and unique substructures, and the proportion of atoms correctly aligned. Across all three, Cycle-MS outperforms Spec2Mol, achieving 0.715, 0.598, and 0.734 compared with 0.546, 0.414, and 0.615. Overall, Cycle-MS demonstrates clear advantages in formula accuracy, scaffold similarity, and molecular integrity prediction, generating candidate structures that are both chemically plausible and structurally precise, thereby underscoring its potential for end-to-end mass spectrometry interpretation. Figure 3d shows the sensitivity and specificity of Cycle-MS in predicting functional groups on the test set, with Figure S2 reporting their frequencies. Prediction performance strongly depends on functional group frequency. For high-frequency groups such as phenyl (23,843), hydroxyl (19,338), and ether (13,930), Cycle-MS achieves sensitivities of 0.87, 0.83, and 0.73 , with specificities above 0.7 , demonstrating robust recognition of common motifs. For medium-frequency groups such as carboxylic acids (9166) and amides (9322), the model maintains stable performance, with sensitivities of 0.76 and 0.68 and specificities of 0.82 and 0.86 , reflecting strong generalization. For low-frequency groups such as aldehydes (619) and thiols (126), sensitivity drops sharply to 0.17 and 0.32 , while specificity remains close to 1.0, indicating a bias toward avoiding false positives over detecting rare motifs. Overall, Cycle-MS provides chemically consistent predictions for frequent functional groups but shows reduced sensitivity for rare ones.
To investigate the impact of varying search widths on model performance during beam search, we conducted experiments using four different search widths on the test set, with the results summarized in Table 1. Increasing the search width from 1 to 20 improved all evaluation metrics. Specifically, molecule accuracy rose from 0.061 to 0.264, formula accuracy increased from 0.113 to 0.324 , and the MCS-ratio grew from 0.696 to 0.776 . These findings demonstrate that increasing the search width effectively enhances the model’s predictive capability. However, while performance steadily improves, the rate of improvement diminishes with increasing search width. Therefore, selecting an appropriate search width is critical for balancing model performance and computational efficiency. Based on the results obtained from running on a NVIDIA 3090 GPU, Cycle-MS demonstrates exceptional performance. Specifically, Cycle-MS has a total of 5.46 million trainable parameters, requiring approximately 2639 MB of GPU memory during training, with a utilization rate ranging from 26 to 38%, effectively leveraging GPU resources. In terms of training time, Cycle-MS completes the process in ${12}\mathrm{\;h}$ and $5\mathrm{\;{min}}$ . The inference speed is equally impressive, with a processing time of ${0.08}\mathrm{\;s}$ per sample, enabling the model to process 134 batches, each containing 256 samples, within 50 min. In contrast, the traditional Spec2Mol model, with a larger parameter count of 49.41 million, exhibits slower inference at ${0.52}\mathrm{\;s}$ per sample, significantly lagging behind Cycle-MS. In summary, Cycle-MS offers clear advantages in resource utilization and inference efficiency, making it particularly suitable for large-scale data processing and real-time inference applications.
Table 1. Comparison of Cycle-MS Performance across Different Search Widths
| search width | ${S}_{\text{ formula }}$ | ACC ${}_{\mathrm{{MW}}}$ | MCS-ratio | molecule acc. | formula acc. |
| search width $= 1$ | 0.820 | 0.933 | 0.696 | 0.061 | 0.113 |
| search width $= 5$ | 0.855 | 0.949 | 0.743 | 0.180 | 0.236 |
| search width $= {15}$ | 0.876 | 0.958 | 0.767 | 0.244 | 0.305 |
| search width $= {20}$ | 0.881 | 0.960 | 0.776 | 0.264 | 0.324 |
In the Cycle-MS framework, several algorithm components are integrated. To evaluate the independent contributions of these components, we conducted an ablation study. Table 2 illustrates the impact of different configurations on model performance under greedy search conditions. Since ${S}_{\text{ formula }}$ is crucial for assessing the average molecular formula generation quality, we present the decrease in this metric relative to the baseline model in the table. The results show that the exclusion of experimental metadata had the largest impact on model performance, with ${S}_{\text{ formula }}$ decreasing by 11.71%. This is expected, as experimental metadata contains key information such as instrument type, precursor ion type, and NCE. For instance, precursor ion type directly influences ionization efficiency and fragmentation pathways, which, in turn, affect peak intensity; NCE determines fragmentation extent, impacting the complexity of the mass spectrum. Removing cycle consistency training and pruning strategies led to a 7% decrease in ${S}_{\text{ formula }}$ , demonstrating their importance in improving model accuracy and optimizing the molecular generation process. Additionally, replacing the GeoGIN encoder with a purely topological GNN resulted in a slight performance decrease, with ${S}_{\text{ formula }}$ dropping by 3.66%. This suggests that GeoGIN plays a role in enhancing molecular geometric encoding but is not a decisive factor. Finally, to simulate potential noise interference in experiments, we designed a noise addition strategy based on random noise, as described by the formula:
$$ \widehat{x} = x + \epsilon \cdot \operatorname{std}\left( x\right) \cdot N\left( {0,1}\right) \tag{3} $$Table 2. Ablation and Noise Effects on Cycle-MS Performance under Greedy Search Conditions
| conditions | ${S}_{\text{ formula }}$ | ${\mathrm{{ACC}}}_{\mathrm{{MW}}}$ | MCS-ratio | molecule acc. | formula acc. | decline |
| baseline | 0.820 | 0.933 | 0.696 | 0.061 | 0.113 | |
| W/O cycle | 0.761 | 0.897 | 0.642 | 0.028 | 0.074 | 7.20% |
| W/O metadata | 0.724 | 0.791 | 0.622 | 0.014 | 0.028 | 11.71% |
| W/O GeoGIN | 0.790 | 0.928 | 0.683 | 0.053 | 0.099 | 3.66% |
| W/O pruning | 0.760 | 0.918 | 0.658 | 0.050 | 0.094 | 7.32% |
| with noise | 0.817 | 0.934 | 0.694 | 0.061 | 0.113 | 0.37% |
Specifically, we randomly selected 10% of the intensity values in the data to add noise, with a standard deviation of 0.05 for the selected points. The noise was added to the original data, and the intensity values were clamped to remain above zero. Results show that noise introduction had minimal impact on model performance, with ${S}_{\text{ formula }}$ decreasing by only 0.37%, indicating that Cycle-MS exhibits a certain degree of robustness.
Given the commercial and limited nature of the NIST 20 data set, we decided to integrate open-source data sets for model training. We selected the MassSpecGym and MassBank data sets, obtaining 203,215 usable data points after duplicate removal and handling missing values. These data were then combined with the NIST 20 data set for training. A comparison between the trained model and the baseline model revealed a decline in several prediction metrics, with the results summarized in Table 3. This decline can be attributed to the
Table 3. Performance Comparison of Baseline and Incremental Model
| models | Top-1 Acc. | Top-5 Acc. | Top-20 Acc. | ${S}_{\text{ formula }}$ | ACC ${}_{\mathrm{{MW}}}$ | MCS-ratio |
| baseline | 0.061 | 0.180 | 0.264 | 0.881 | 0.960 | 0.776 |
| incremental model | 0.045 | 0.119 | 0.165 | 0.849 | 0.942 | 0.733 |
fact that the NIST 20 data set primarily consists of data from FT-MS and QTOF, while many samples in the MassSpecGym and MassBank data sets originate from different instrument types. Additionally, the precursor ions in the latter data sets are primarily focused on ${\left\lbrack \mathrm{M} + \mathrm{H}\right\rbrack }^{ + }$ and ${\left\lbrack \mathrm{M} + \mathrm{{Na}}\right\rbrack }^{ + }$ , which differ from the distribution observed in the NIST 20 data set, highlighting the impact of data distribution differences on model efficacy. Nevertheless, incorporating open-source data sets helps enhance the model’s adaptability and improves its generalization across diverse experimental conditions. Future work could explore how to customize training based on the distinct data characteristics of different instruments, further enhancing the model’s performance across various data sets.
In addition to the comparative experiments with Spec2Mol, we further conducted a systematic evaluation of other baseline models on the full test set, with the results summarized in Table 4. Cycle-MS demonstrates clear advantages across all evaluation metrics. MADGEN ${}^{43}$ adopts a framework prediction and molecular generation architecture, where molecular frameworks are predicted from mass spectrometry data and then used to generate the complete molecular structure. However, this framework-based approach is limited by the accuracy of scaffold prediction. If the predicted scaffold does not fully capture the structural differences between molecules, the generated structure may not accurately represent the true molecule, leading to lower prediction accuracy. DiffMS, on the other hand, uses a diffusion model to generate molecular structures progressively, predicting mass spectrometry data in a stepwise manner. Although the diffusion model performs well in generation tasks, it requires more steps and iterations to approach the final molecular structure. While DiffMS achieves similar Top-1 accuracy to Cycle-MS, its Top-20 accuracy is only 0.169, lower than Cycle-MS’s 0.264 . This indicates that compared to the diffusion model, the Transformer-based beam search method in Cycle-MS is more precise and efficient in generating candidate structures during the search process. These results highlight that Cycle-MS not only surpasses existing models in direct comparisons but also sustains robust, high-precision performance under broader and more heterogeneous test conditions, underscoring its real-world applicability and reliability.
Table 4. Comparison of Model Performance on Full Test Set across Various Metrics
| models | Top-1 Acc. | Top-5 Acc. | Top-20 Acc. | ${S}_{\text{ formula }}$ | ACC ${}_{\mathrm{{MW}}}$ | MCS-ratio |
| MADGEN | 0.045 | 0.077 | 0.114 | 0.829 | 0.935 | 0.705 |
| DiffMS | 0.053 | 0.107 | 0.169 | 0.833 | 0.940 | 0.721 |
| Cycle-MS (ours) | 0.061 | 0.180 | 0.264 | 0.881 | 0.960 | 0.776 |
Finally, we evaluated the performance of several models on the CASMI 2022 data set, with the results summarized in Table 5. Cycle-MS exhibited superior performance across several key evaluation metrics. It achieved 0.806 and 0.927 for ${S}_{\text{ formula }}$ and ${\mathrm{{ACC}}}_{\mathrm{{MW}}}$ , respectively, outperforming MADGEN and DiffMS, indicating superior accuracy in molecular composition and molecular weight prediction. Additionally, Cycle-MS excelled in the structural similarity metric MCS-ratio, with a score of 0.703. However, despite Cycle-MS’s strong performance on these metrics, its predictions still lag behind those in Table 4, suggesting that the molecules in the CASMI 2022 data set possess a higher degree of complexity and novelty. This indicates that the current models still face limitations in generalizing them to novel molecules. Therefore, future research should focus on enhancing the generalization capabilities of these models, particularly in handling unknown molecules and complex data sets, to further improve their performance in real-world applications.
Table 5. Performance Comparison of Different Models on the CASMI 2022 Dataset
| models | ${S}_{\text{ formula }}$ | ACC ${}_{\mathrm{{MW}}}$ | MCS-ratio | Cosine Smi. | Tanimoto Smi. |
| Spec2Mol | 0.652 | 0.867 | 0.522 | 0.372 | 0.236 |
| MADGEN | 0.721 | 0.913 | 0.551 | 0.405 | 0.245 |
| DiffMS | 0.746 | 0.916 | 0.641 | 0.427 | 0.277 |
| Cycle-MS (ours) | 0.806 | 0.927 | 0.703 | 0.511 | 0.413 |
Analysis of Model Interpretability
Figure 4 demonstrates the feature extraction capability of the spectrum encoder, with results visualized in two-dimensional space using t-SNE. In Figure 4a, we analyzed the largest test subset with identical experimental settings (e.g., fragmentation method and NCE). The latent representations extracted from ${\mathrm{{MS}}}^{2}$ spectra of molecules across different mass ranges formed clearly separable clusters. This indicates that the encoder effectively captures mass differences and models the internal structural relationships of the spectra. In Figure 4b, we expanded the analysis to the full test set to evaluate the encoder’s generalization across different experimental conditions. Although some overlap in feature vectors was observed under heterogeneous experimental setups, mass-dependent clustering remained evident. This demonstrates the encoder’s robust feature extraction capabilities, even in complex environments, and its ability to differentiate spectra from molecules of various mass levels. Overall, the spectrum encoder in Cycle-MS not only shows strong discriminative power within homogeneous data sets but also maintains excellent feature separability across heterogeneous data with varying conditions and instrumentation. This underscores its robustness and adaptability in multisource mass spectrometry analysis.
Figure 5 shows the SHAP-based interpretability analysis of the spectrum encoder, using the Levenshtein similarity between predicted and true SMILES as the target variable, with absolute SHAP values normalized for visualization. This method reveals the contribution of each fragment peak to the SMILES prediction, offering valuable insights into the model’s decision-making process. In Figure 5a, $m/z = {123}$ (fluorobenzoyl ion) and $m/z = {106}$ (aryliminium ion) are key diagnostic peaks that define the fluorobenzoyl-arylimine scaffold, playing a significant role in the model’s prediction. In contrast, common aromatic fragments such as $m/z = {95}$ , despite their frequent presence in the spectrum, contribute less to the prediction, indicating their weaker role in identifying specific molecular structures. Figure 5b highlights $m/z = {107}$ (hydroxybenzyl ion) and $m/z = {51},{53}$ (unsaturated C4 ions), which emphasize the hydroxybenzene core and tert-butylamine side chain. These fragments are heavily weighted in the model’s prediction, while common aromatic fragments like $m/z = {95},{77}$ are downweighted due to their limited impact on recognizing the molecular backbone. In Figure 5c, $m/z = {84}$ (pyrrolidone-type ion) marks the gamma-amino acid scaffold, while the intense $m/ \; z = {56}$ peak is deprioritized. This reflects the model’s preference for the amino acid backbone and its ability to improve prediction accuracy by minimizing the influence of irrelevant peaks. Figure $5\mathrm{\;d}$ shows $m/z = {69}$ (trifluoroacetyl ion) as key evidence for fluorinated structures, emphasizing the model’s precision in identifying fluorinated molecules. These results collectively demonstrate that Cycle-MS prioritizes diagnostic fragments over abundant but nonspecific peaks, enabling accurate identification of key scaffolds and functional groups. This strategy enhances Cycle-MS’s ability to generate chemically plausible and structurally precise predictions, showcasing its powerful potential for molecular structure elucidation from mass spectrometry data.
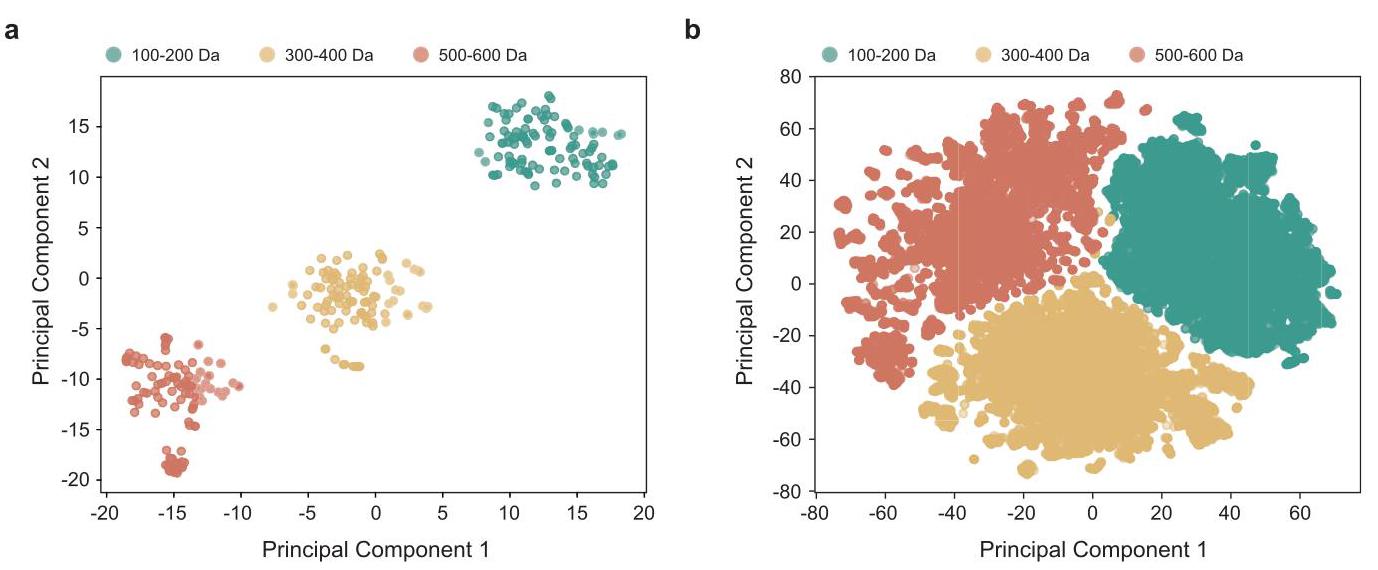
Figure 4. Visualization of spectrum encoder features using t-SNE. (a) Largest test subset under identical experimental conditions, showing clear mass-dependent clustering. (b) Full test set under heterogeneous conditions, where mass-dependent trends remain evident despite partial overlap.
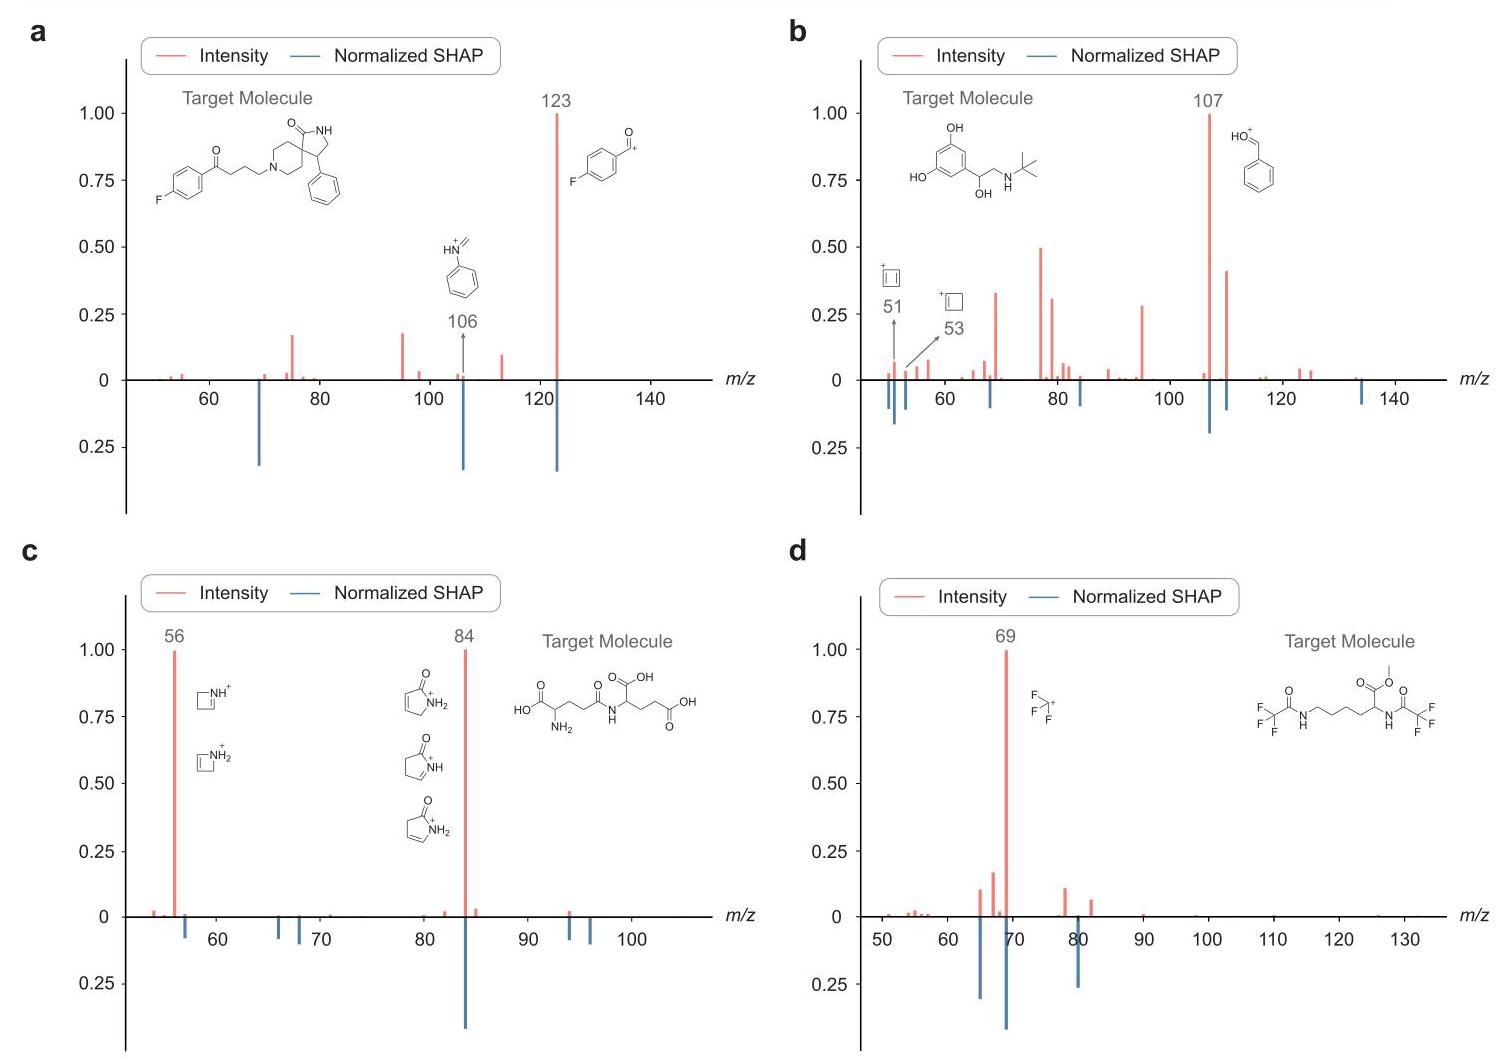
Figure 5. SHAP-based interpretability analysis of Cycle-MS. (a) Diagnostic peaks define the fluorobenzoyl-arylimine scaffold, while common aromatic fragments are downweighted. (b) Hydroxybenzene core and tert-butylamine side chain are identified by characteristic fragments, with nonspecific aromatic peaks contributing little. (c) $\gamma$ -Amino acid scaffold is highlighted by a pyrrolidone-type fragment, whereas intense but nonspecific peaks are deprioritized. (d) Dominant trifluoroacetyl fragment provides the key evidence for fluorinated motifs.
DISCUSSION
This study introduces Cycle-MS, a model that integrates inverse spectrum-to-molecule prediction with forward spectrum reconstruction, augmented by cycle-consistency losses, to enhance spectral feature representation. Compared with other models, Cycle-MS achieves higher accuracy in atom counts, molecular formulas, scaffold similarity, and functional group prediction, enabling more reliable capture of both the overall molecular scale and key chemical features. Through a series of ablation studies, the importance of cycle training, experimental metadata, and pruning strategies in enhancing the model’s predictive performance was revealed. Interpretability analysis further reveals that Cycle-MS relies primarily on structurally diagnostic fragments rather than merely abundant peaks, thereby ensuring chemical plausibility and structural reliability in its predictions.
While Cycle-MS offers a promising approach for high-precision end-to-end mass spectrometry analysis, it still faces several challenges. First, the available training data are insufficient. Future efforts should focus on incorporating more open-source data and refining data engineering to ensure effective integration of databases with diverse sources and distributions, thereby enhancing the comprehensiveness and robustness of model training. Second, Cycle-MS’s generalization ability needs improvement when dealing with novel data sets, such as CASMI 2022. To address this, future work could involve training specialized prediction models for different mass spectrometers and precursor ions, as well as the widespread use of transfer learning techniques to improve prediction accuracy across diverse data sets.
A ASSOCIATED CONTENT
Data Availability Statement
The mass spectra data used in this study originate from the commercial NIST Mass Spectral Library (https://www.nist.gov/programs-projects/tandem-mass-spectral-library).Access to the full library requires a license. To ensure the reproducibility and independent verification of the key findings, the complete independent test set used for the final model evaluation has been deposited in a Zenodo repository (https://zenodo.org/records/ 18415823). The source code for the Cycle-MS framework and all associated scripts are freely available on GitHub at https:// github.com/HowardLi1984/mass2_mol_unify.
Supporting Information
The Supporting Information is available free of charge at https://pubs.acs.org/doi/10.1021/acs.jcim.5c02981.
Molecular weight distribution in the data set; frequency distribution of functional groups in the test set; and prompting Gemini-2.5 for functional-group $m/z$ priors (PDF)
A AUTHOR INFORMATION
Corresponding Author
Fanyang Mo - School of Materials Science and Engineering, Peking University, Beijing 100871, P. R. China; School of Advanced Materials and AI for Science (AI4S)-Preferred Program, Peking University Shenzhen Graduate School, Shenzhen 518055, P. R. China; (C) orcid.org/0000-0002- 4140-3020;
Authors
Jinglong Lin - School of Materials Science and Engineering, Peking University, Beijing 100871, P. R. China
Hao Li - School of Electronic and Computer Engineering, Peking University Shenzhen Graduate School, Shenzhen 518055, P. R. China
Chengchun Liu - School of Materials Science and Engineering, Peking University, Beijing 100871, P. R. China; © orcid.org/ 0009-0002-5550-4145
Zhiyuan Yan - School of Electronic and Computer Engineering, Peking University Shenzhen Graduate School, Shenzhen 518055, P. R. China
Li Yuan - School of Electronic and Computer Engineering, Peking University Shenzhen Graduate School, Shenzhen 518055, P. R. China
Complete contact information is available at:
https://pubs.acs.org/10.1021/acs.jcim.5c02981
Author Contributions
J.L analyzed the data. H.L. and J.L. performed chemoinformatic and machine learning studies. J.L and C.L conducted the interpretability analysis of the model. F.M. conceived the idea and designed the overall research. F.M. supervised the whole project. All authors wrote the manuscript. J.L. and H.L. contributed equally to this work.
Notes
The authors declare no competing financial interest.
ACKNOWLEDGMENTS
We thank Peking University Shenzhen Graduate School and Shenzhen Government for the start-up funding support. We thank the High Performance Computing Platform of Peking University for machine learning model training. This work is supported by the PaddlePaddle team (https://www.paddlepaddle.org.cn/).
ERFERENCES
(1) Dunn, W. B.; Ellis, D. I. Metabolomics: Current Analytical Platforms and Methodologies. Trends Anal. Chem. 2005, 24, 285-294.
(2) Zhou, B.; Xiao, J. F.; Tuli, L.; Ressom, H. W. LC-MS-based metabolomics. Molecular BioSystems 2011, 8, 470-481.
(3) Li, S.; Siddiqa, A.; Thapa, M.; Chi, Y.; Zheng, S. Trackable and scalable LC-MS metabolomics data processing using asari. Nat. Commun. 2023, 14, 4113.
(4) Aebersold, R.; Mann, M. Mass Spectrometry-Based Proteomics. Nature 2003, 422, 198-207.
(5) Yates, J. R.; Ruse, C. I.; Nakorchevsky, A. Proteomics by Mass Spectrometry: Approaches, Advances, and Applications. Annu. Rev. Biomed. Eng. 2009, 11, 49-79.
(6) Pino, L. K.; Rose, J.; O’Broin, A.; Shah, S.; Schilling, B. Emerging mass spectrometry-based proteomics methodologies for novel biomedical applications. Biochem. Soc. Trans. 2020, 48, 1953-1966.
(7) Lee, M. S.; Kerns, E. H. LC/MS Applications in Drug Development. Mass Spectrom. Rev. 1999, 18, 187-279.
(8) Dueñas, M. E.; Peltier-Heap, R. E.; Leveridge, M.; Annan, R. S.; Büttner, F. H.; Trost, M. Advances in high-throughput mass spectrometry in drug discovery. EMBO Mol. Med. 2023, 15, No. e14850.
(9) Zhang, A.; Sun, H.; Wang, X. Mass spectrometry-driven drug discovery for development of herbal medicine. Mass Spectrom. Rev. 2018, 37, 307-320.
(10) Schymanski, E. L.; Meringer, M.; Brack, W. Matching structures to mass spectra using fragmentation patterns: are the results as good as they look? Analytical chemistry 2009, 81, 3608-3617.
(11) Reiz, B.; Kertész-Farkas, A.; Pongor, S.; Myers, M. P. Chemical rule-based filtering of MS/MS spectra. Bioinformatics 2013, 29, 925- 932.
(12) Ulintz, P. J.; Zhu, J.; Qin, Z. S.; Andrews, P. C. Improved classification of mass spectrometry database search results using newer machine learning approaches. Molecular & Cellular Proteomics 2006, 5, 497-509.
(13) Cottrell, J. S. Protein identification using MS/MS data. Journal of proteomics 2011, 74, 1842-1851.
(14) Ghosh, K.; Stuke, A.; Todorović, M.; Jørgensen, P. B.; Schmidt, M. N.; Vehtari, A.; Rinke, P. Deep learning spectroscopy: Neural networks for molecular excitation spectra. Adv. Sci. 2019, 6, No. 1801367.
(15) Debus, B.; Parastar, H.; Harrington, P.; Kirsanov, D. Deep learning in analytical chemistry. TrAC Trends in Analytical Chemistry 2021, 145, No. 116459.
(16) Wang, X.; Jiang, S.; Hu, W.; Ye, S.; Wang, T.; Wu, F.; Yang, L.; Li, X.; Zhang, G.; Chen, X.; et al. Quantitatively determining surface-adsorbate properties from vibrational spectroscopy with interpretable machine learning. J. Am. Chem. Soc. 2022, 144, 16069-16076.
(17) Zou, Z.; Zhang, Y.; Liang, L.; Wei, M.; Leng, J.; Jiang, J.; Luo, Y.; Hu, W. A deep learning model for predicting selected organic molecular spectra. Nature Computational Science 2023, 3, 957-964.
(18) Xu, H.; Lin, J.; Liu, Q.; Chen, Y.; Zhang, J.; Yang, Y.; Young, M. C.; Xu, Y.; Zhang, D.; Mo, F. High-throughput discovery of chemical structure-polarity relationships combining automation and machine-learning techniques. Chem. 2022, 8, 3202-3214.
(19) Xu, H.; Lin, J.; Zhang, D.; Mo, F. Retention time prediction for chromatographic enantioseparation by quantile geometry-enhanced graph neural network. Nat. Commun. 2023, 14, 3095.
(20) Xu, H.; Wu, W.; Chen, Y.; Zhang, D.; Mo, F. Explicit relation between thin film chromatography and column chromatography conditions from statistics and machine learning. Nat. Commun. 2025, 16, 832.
(21) Beck, A. G.; Muhoberac, M.; Randolph, C. E.; Beveridge, C. H.; Wijewardhane, P. R.; Kenttamaa, H. I.; Chopra, G. Recent developments in machine learning for mass spectrometry. ACS Measurement Science Au 2024, 4, 233-246.
(22) Gessulat, S.; Schmidt, T.; Zolg, D. P.; Samaras, P.; Schnatbaum, K.; Zerweck, J.; Knaute, T.; Rechenberger, J.; Delanghe, B.; Huhmer, A.; et al. Prosit: proteome-wide prediction of peptide tandem mass spectra by deep learning. Nat. Methods 2019, 16, 509-518.
(23) Jirayupat, C.; Nagashima, K.; Hosomi, T.; Takahashi, T.; Tanaka, W.; Samransuksamer, B.; Zhang, G.; Liu, J.; Kanai, M.; Yanagida, T. Image processing and machine learning for automated identification of chemo-/biomarkers in chromatography-mass spectrometry. Analytical chemistry 2021, 93, 14708-14715.
(24) Satoh, T.; Takei, M.; Uematsu, F. Development of a Peak Extraction Method Using the High-Resolution Matrix-Assisted Laser Desorption/Ionization Time-of-Flight Mass Spectrometry and Machine Learning Techniques: Analysis of Peak Shapes. Rapid Commun. Mass Spectrom. 2022, 36, No. e9235.
(25) Young, A.; Röst, H.; Wang, B. Tandem mass spectrum prediction for small molecules using graph transformers. Nature Machine Intelligence 2024, 6, 404-416.
(26) Wei, J. N.; Belanger, D.; Adams, R. P.; Sculley, D. Rapid prediction of electron-ionization mass spectrometry using neural networks. ACS central science 2019, 5, 700-708.
(27) Allen, F.; Pon, A.; Greiner, R.; Wishart, D. Computational prediction of electron ionization mass spectra to assist in GC/MS compound identification. Analytical chemistry 2016, 88, 7689-7697.
(28) Zhu, R. L.; Jonas, E. Rapid approximate subset-based spectra prediction for electron ionization-mass spectrometry. Analytical chemistry 2023, 95, 2653-2663.
(29) Li, Y.; Kuhn, M.; Gavin, A.-C.; Bork, P. Identification of metabolites from tandem mass spectra with a machine learning approach utilizing structural features. Bioinformatics 2020, 36, 1213- 1218.
(30) Dührkop, K.; Fleischauer, M.; Ludwig, M.; Aksenov, A. A.; Melnik, A. V.; Meusel, M.; Dorrestein, P. C.; Rousu, J.; Böcker, S. SIRIUS 4: a rapid tool for turning tandem mass spectra into metabolite structure information. Nat. Methods 2019, 16, 299-302.
(31) Goldman, S.; Xin, J.; Provenzano, J.; Coley, C. W. Mist-cf: Chemical formula inference from tandem mass spectra. J. Chem. Inf. Model. 2024, 64, 2421-2431.
(32) Stravs, M. A.; Dührkop, K.; Böcker, S.; Zamboni, N. MSNovelist: de novo structure generation from mass spectra. Nat. Methods 2022, 19, 865-870.
(33) Chen, L.; Xia, B.; Wang, Y.; Huang, X.; Gu, Y.; Wu, W.; Zhou, Y. Cmssp: A contrastive mass spectra-structure pretraining model for metabolite identification. Anal. Chem. 2024, 96, 16871-16881.
(34) Xie, T.; Zhang, H.; Yang, Q.; Sun, J.; Wang, Y.; Long, J.; Zhang, Z.; Lu, H. CSU-MS2: A Contrastive Learning Framework for Cross-Modal Compound Identification from MS/MS Spectra to Molecular Structures. Anal. Chem. 2025, 97, 13350-13360.
(35) Yu, N.; Ma, Z.; Shao, Q.; Li, L.; Wang, X.; Pan, B.; Yu, H.; Wei, S. Pseudodata-based molecular structure generator to reveal unknown chemicals. Nat. Mach. Intell. 2025, 7, 1879-1887.
(36) Litsa, E. E.; Chenthamarakshan, V.; Das, P.; Kavraki, L. E. An end-to-end deep learning framework for translating mass spectra to de-novo molecules. Commun. Chem. 2023, 6, 132.
(37) Zong, G.; Gao, J.; Qi, Y.; Zhao, H.; Feng, W.; Hu, B.; Ma, J.; Du, L.; Han, J. A Spectrum-to-Structure Diffusion Model for De Novo Small Molecule Generation. Anal. Chem. 2025, 97, 27325-27336.
(38) Bohde, M.; Manjrekar, M.; Wang, R.; Ji, S.; Coley, C. W. Diffms: Diffusion generation of molecules conditioned on mass spectra. arXiv preprint arXiv:2502.09571, 2025.
(39) Kearnes, S.; McCloskey, K.; Berndl, M.; Pande, V.; Riley, P. Molecular graph convolutions: moving beyond fingerprints. J. Comput. Aided Mol. Des. 2016, 30, 595-608.
(40) Schütt, K. T.; Sauceda, H. E.; Kindermans, P.-J.; Tkatchenko, A.; Müller, K.-R. Schnet-a deep learning architecture for molecules and materials. J. Chem. Phys. 2018, 148, 241722.
(41) Fang, X.; Liu, L.; Lei, J.; He, D.; Zhang, S.; Zhou, J.; Wang, F.; Wu, H.; Wang, H. Geometry-enhanced molecular representation learning for property prediction. Nat. Mach. Intell. 2022, 4, 127-134.
(42) Li, S.-W.; Xu, L.-C.; Zhang, C.; Zhang, S.-Q.; Hong, X. Reaction performance prediction with an extrapolative and interpretable graph model based on chemical knowledge. Nat. Commun. 2023, 14, 3569.
(43) Wang, Y.; Chen, X.; Liu, L.; Hassoun, S. MADGEN: Mass-Spec attends to De Novo Molecular generation. arXiv preprint arXiv:2501.01950, 2025.