Infrared Spectra Prediction for Carbonyl Group Utilizing a Graph Network Approach
中文 / Bilingual · English version
Jie Shi, Chengchun Liu, and Fanyang Mo*
Cite This: Precis. Chem. 2026, 4, 782-792
ABSTRACT: Infrared spectroscopy stands as a formidable analytical tool, ubiquitously employed across materials science and biomedical research. Yet, manual interpretation of spectral data remains a laborious and time-intensive endeavor. Carbonyl groups, pervasive in organic compounds, such as natural products, pharmaceuticals, and peptides, demonstrate both compelling predictive potential and critical diagnostic significance for interpretable spectral analysis. This work harnesses experimentally measured spectroscopic data from chemical literature, constructing a robust data set to propel efficiency. We introduce NE-GNN, a specialized feature extraction approach synergizing proximal structural analysis with graph neural networks-a method that marries predictive accuracy with interpretability. By leveraging this chemically intuitive framework, NE-GNN achieves remarkable precision in predicting carbonyl group peaks in infrared spectra. Beyond accelerating machine learning applications in spectroscopic analysis, this strategy supports data-driven discovery in chemistry.
KEYWORDS: GNN, infrared spectra, carbonyl group, interpretability, characteristic peak, machine learning
INTRODUCTION
Infrared spectroscopy (IR) stands as a powerful analytical tool, playing a pivotal role across diverse fields, including chemistry, materials science, biomedicine, and environmental monitoring. ${}^{1}$ By probing the vibrational signatures of chemical bonds, this technique provides a unique window into molecular structure, dynamics, and interactions. ${}^{2}$ However, conventional approaches to infrared spectral analysis often rely heavily on expert interpretation, which presents significant challenges in deciphering complex spectral data. ${}^{3}$ Key limitations include the identification and assignment of spectral features, the deconvolution of overlapping peaks, and the spectral baseline corrections. ${}^{4 - 6}$ These processes are not only time-consuming and labor-intensive but also prone to subjective errors. ${}^{7,8}$
The advent of artificial intelligence has inaugurated a transformative era for infrared spectral analysis, with cutting-edge algorithms that include convolutional neural networks (CNNs), message passing neural networks (MPNNs), and graph neural networks (GNNs) redefining traditional analytical paradigms. ${}^{9 - {11}}$ These sophisticated machine learning approaches possess an extraordinary capacity to autonomously extract meaningful patterns from vast spectral data sets, enabling rapid and precise interpretation of complex vibrational signatures without human intervention. ${}^{{12},{13}}$ Beyond merely accelerating analysis, these intelligent systems uncover hidden correlations within spectral data, offering researchers unprecedented insights into molecular structure-property relationships that were previously obscured by conventional methods. ${}^{{14},{15}}$ Molecular feature engineering bridges fundamental knowledge of chemistry with computational descriptors. ${}^{16}$ The synergy between advanced neural architectures and well-engineered molecular descriptors creates a powerful analytical framework, where physical insights guide algorithmic learning to achieve both interpretability and predictive accuracy. ${}^{{17},{18}}$
Infrared spectroscopy (IR) stands as an indispensable analytical tool in chemical synthesis, enabling rapid functional group characterization, real-time reaction monitoring, product structure verification, and process optimization. ${}^{19}$ While machine learning has ushered in revolutionary paradigms for interpreting such spectral data, its application to complex molecular systems remains hampered by the limitations of conventional feature engineering. ${}^{{20},{21}}$ However, a more fundamental issue is that current state-of-the-art chemical models often function as enigmatic black boxes, their decision-making processes obscured by computational complexity. ${}^{5,{22},{23}}$ This interpretability crisis becomes particularly acute in functional group identification: Despite advances in full-spectrum prediction within the mid-infrared region, the crucial task of peak assignment still relies heavily on experts. ${}^{{14},{24}}$ The fundamental challenge lies in developing models that can selectively predict localized molecular features with both algorithmic precision and chemical transparency. ${}^{25}$ An alternative methodological pathway involves developing specialized predictors targeting individual functional groups for granular single-band spectral predicting, followed by their systematic integration into a unified analytical framework. ${}^{26}$ This integrated approach promises to enable highly accurate characteristic peak predictions and interpretations of molecular spectra, fundamentally aligning the analytical process with the intuitive reasoning patterns employed by expert chemists.
Received: November 23, 2025
Revised: January 28, 2026
Accepted: January 29, 2026
Published: February 6, 2026
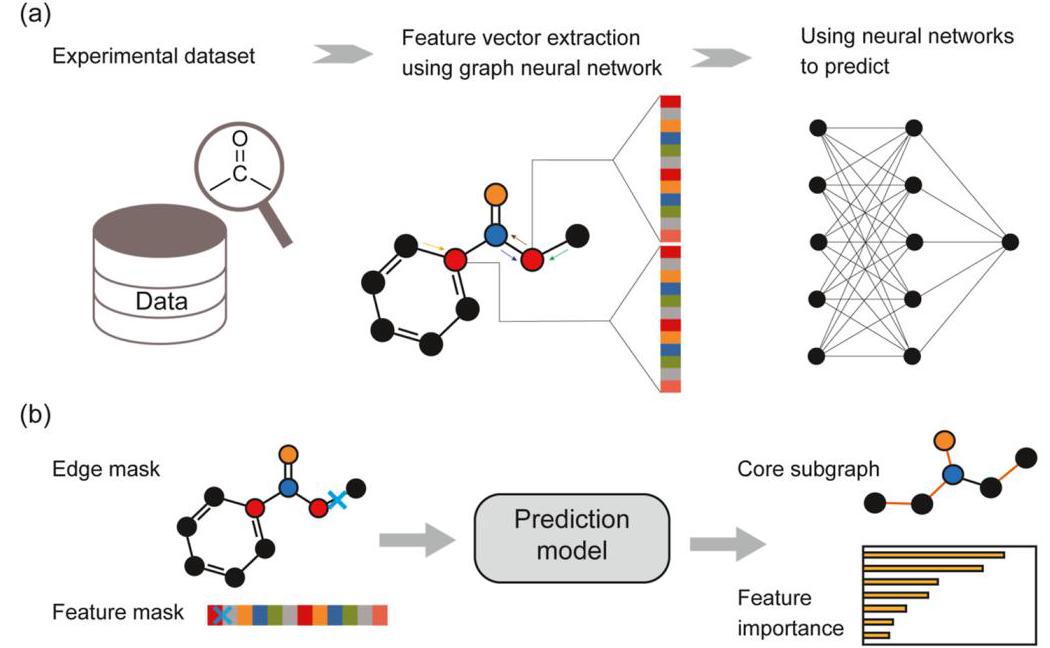
Figure 1. Workflow of this work. (a) This work establishes a predictive workflow leveraging graph neural networks for infrared spectral analysis. (b) The underlying prediction mechanism is elucidated through GNNExplainer, which interprets model decisions by identifying critical subgraph structures and feature contributions.
This work presents a purpose-built graph neural network architecture that integrates proximal structural features to address these limitations. By the design of chemically intuitive molecular representations that emphasize atomic neighborhoods and bonding environments, our approach enables the targeted prediction of specific functional group characteristic peaks. Carbonyl groups, with their extensive presence across diverse compounds and their fundamental role in synthesis and real-time analytical detection, serve as an ideal test case for demonstrating how machine learning can advance beyond broad spectral reproduction to deliver precise and interpretable group-specific predictions. ${}^{27}$ By comprehensively comparing our approach to conventional methods, we show how strategically designed neural networks can complement traditional analysis, especially in scenarios that demand both accuracy and explanatory power. ${}^{28}$ Through rigorous comparative benchmarking of diverse computational models, this study provides critical guidance for researchers seeking analytical methodologies. Furthermore, this work sets the essential foundation for a future paradigm: integrating specialized prediction models tailored to distinct functional groups.
METHODS
Data Set
We compiled the Characteristic Infrared Absorption Wavenumber of the Carbonyl group (CIAC) data set of experimental infrared spectra from 579 publications, focusing on carbonyl group absorption between 1590 and ${1850}{\mathrm{\;{cm}}}^{-1}$ (Figure S1). To ensure data quality, we selected molecules with only one peak in this range, excluding those with potential interference from other functional groups. For molecules exhibiting multiple peaks, we applied a criterion of chemical reasonableness, which guided our identification of structurally similar carbonyl subclasses from the same literature source and the selection of peaks with minimal wavenumber differences $\left( {{\Delta \nu } < {30}{\mathrm{\;{cm}}}^{-1}}\right)$ . The final data set contains 8072 monocarbonyl and 982 multicarbonyl compounds (Figure S2). The CIAC set generally conforms to the common distribution of carbonyl groups, and the data inside reflect different chemical environments (Figure 2). This carefully curated data set provides a reliable foundation for studying carbonyl vibrations while covering diverse molecular structures.
Molecular Graph Representation
We employed PyTorch Geometric’s data class to transform molecules into graph structures, where atoms serve as nodes and bonds serve as edges. To enhance feature representation, we introduced one critical attribute: ${}^{29}$
- carbonyl_mask: An indicator $\left( {0/1/2}\right)$ recognizes the atoms within the carbonyl 2-bond radius and marks the carbonyl carbon as 0.6 , so as to select the nodes in the subsequent graph convolution operation.
Selection of Node and Edge Features. We selected 16 node features and 5 edge features for molecular graph representation. Node features include: 9 fundamental atomic properties: atomic number, connectivity, implicit valence, ring membership, hybridization type, electronegativity, covalent radius, aromaticity, formal charge. Seven environmental attention features: ring size, summed electronegativity of adjacent atoms, total neighbor connectivity, aromatic atom count, Neighbor ring atom count, double bond count, triple bond count. Edge features comprise the following: bond type, conjugation status, ring membership, aromaticity, and polarity.
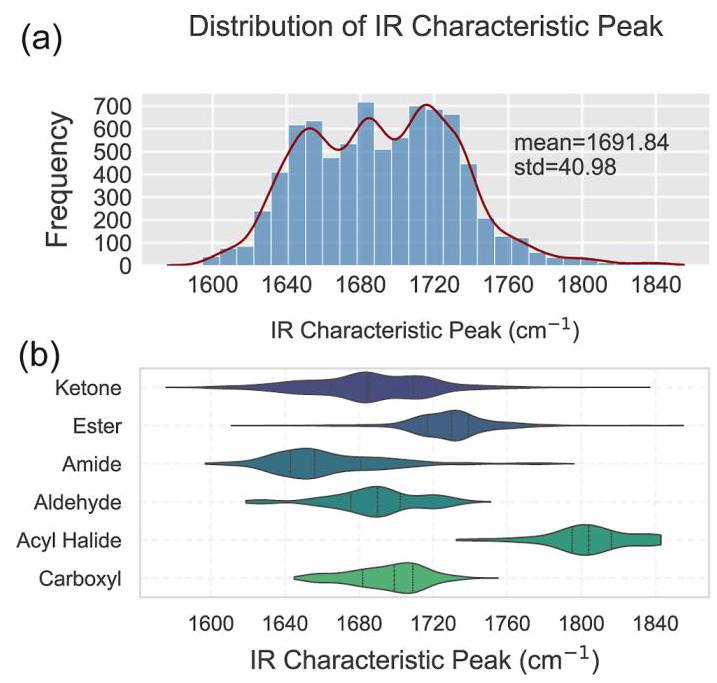
Figure 2. Distribution of the CIAC data set. (a) Wavenumber distribution in the CIAC data set. (b) Violin plot distribution of different types of carbonyl groups in the CIAC data set.
Atomic. Atomic number, Connectivity, Implicit valence, Ring membership, Hybridization, Electronegativity, Covalent radius, Aromaticity, and Formal charge.
Environmental. Ring size, ΣNeighbor electronegativity, Neighbor Degree, Neighbor Aromaticity, Neighbor in Ring, Neighbor Double Bond, and Neighbor Triple Bond.
Edge. Bond type, Conjugation status, Ring membership, Aromaticity, and Polarity.
Details for NE-GNN
The architecture of our proposed network, named Neighbor Enhanced Graph Neural Networks (NE-GNN), as illustrated in Figure 1, processes molecular graphs through a multistage computational pipeline. Initially, both atom and edge features are projected into 128-dimensional embeddings and subsequently fused together. These fused features then undergo four successive Graph Isomorphism Network (GINE) layers that perform iterative message passing and feature updating operations to capture complex molecular patterns. ${}^{30}$ For targeted carbonyl group analysis, the network pays attention to the characteristics of two atoms around the carbonyl carbon atom except for the carbonyl oxygen after being updated with the message and integrates the feature vectors of the two. The integrated features are finally processed through two fully connected layers to generate accurate spectral predictions. Furthermore, predictions can also be strategically generated by leveraging the feature vector of the carbonyl carbon atom itself, which inherently encodes the distinct chemical environment imposed by different functional groups. ${}^{31}$ This architecture uniquely combines local chemical environment analysis around carbonyl groups with global molecular structure learning through multiple GINE layers while maintaining computational efficiency through its efficient implementation. The network’s ability to focus on chemically relevant regions while preserving broader molecular context enables both precise spectral predictions and meaningful pattern recognition.
Training Detail
We performed hyperparameter optimization via grid search, evaluating graph convolution layers, node selection, and embedding dimensions. The optimal configuration uses 4 graph convolution layers with 128-dimensional embeddings, utilizing feature vectors from atoms directly bonded to carbonyl groups for prediction. For one node NE-GNN, the best configuration is four 256-dimensional GINE convolutional layers.
The data set was split into a training set (90%), a validation set (5%), and a test set (5%). We employed the Adam optimizer with MSE loss and a learning rate decay strategy. In order to improve training stability and avoid potential data leaks, we divided the data sets, normalized them separately, and normalized the ketone peak intensities by subtracting the mean of the data sets and dividing by the standard deviation. Subsequently, the normalized data are used for model training and prediction. During evaluation, we restore the predicted values and normalized values back, according to their respective normalized parameters.
Interpretability Methods
To demystify the decision logic of our graph neural network, we employ two complementary interpretability approaches: GNNEx-plainer and Perturbation-based Sensitivity Analysis (PSA). ${}^{32}$
GNNExplainer identifies chemically relevant substructures by optimizing a masked subgraph that maximizes its mutual information with the model’s prediction while remaining structurally concise. Its objective is formulated as
$$ \mathop{\max }\limits_{{{\mathrm{G}}_{\mathrm{S}},\mathrm{F}}}\mathrm{I}\left( {\widehat{\mathrm{Y}};\left( {{\mathrm{G}}_{\mathrm{S}},\mathrm{F}}\right) }\right) - {\lambda }_{1}\mathrm{H}\left( {\mathrm{A}}_{\mathrm{S}}\right) - {\lambda }_{2}\mathrm{H}\left( \mathrm{F}\right) \tag{1} $$where $\mathrm{I}\left( {\widehat{\mathrm{Y}};\left( {{\mathrm{G}}_{\mathrm{S}},\mathrm{F}}\right) }\right)$ is the mutual information between the prediction $\mathrm{Y}$ and the explanatory subgraph ${G}_{\mathrm{S}}$ with feature mask $\mathrm{F};\mathrm{H}\left( {\mathrm{A}}_{\mathrm{S}}\right)$ and H(F) are entropy terms penalizing structural and feature complexity; ${\lambda }_{1},{\lambda }_{2}$ control the fidelity-sparsity trade-off.
However, GNNExplainer yields non-negative importance scores and struggles with global feature attribution across variable-sized graphs. To address this, we introduce PSA, which quantifies the directional influence of atomic features via systematic perturbation. For a trained GNN $f$ and molecular graph $\mathcal{G}$ , the sensitivity of feature $k$ is
$$ {\Delta }_{k} = f\left( \mathcal{G}\right) - f\left( {\mathcal{G}}^{\left( k\right) }\right) \tag{2} $$where ${\mathcal{G}}^{\left( k\right) }$ is the graph with the $k$ -th atomic feature zero-masked across all atoms. A positive ${\Delta }_{k}$ implies that the feature promotes the target property, while a negative value indicates inhibition. The signed importance score ${S}_{k} = {\Delta }_{k}$ thus offers both magnitude and chemically intuitive directionality-without requiring fixed input dimensions.
RESULTS AND DISCUSSION
Model Performance Evaluation
To rigorously quantify our model’s predictive accuracy, we employ three complementary statistical measures that collectively assess different dimensions of regression performance. The Mean Absolute Error (MAE) captures the average prediction deviation without directional bias, particularly valuable when outlier rejection is prioritized. More sensitive to extreme errors, the Root Mean Squared Error (RMSE) exponentially penalizes larger inaccuracies, making it ideal for applications demanding strict error boundaries. Finally, the Coefficient of Determination $\left( {R}^{2}\right)$ evaluates the global predictive power by measuring the explained variance relative to naive baselines, with values approaching 1.0 indicating a near-perfect correlation between predicted and experimental values.
Figure 3a, b presents the predictive performance of various graph neural networks alongside a structure-aware tree-based model employing SNM (Substructure Neighborhood Mechanism). ${}^{14}$ Benchmark results for the identical test set demonstrate that the GINE-based approach consistently outperforms others by 0.6%. This performance gap highlights graph neural networks’ inherent advantages in capturing complex molecular patterns through explicit representation of atomic connectivity and chemical environments, and the RMSE was only 10.58, which was better than 12.151 ${\mathrm{{cm}}}^{-1}$ under random forest. Edge-aware architectures show particular efficacy for spectral prediction (Figure 3c) over their tree-based counterparts. The optimal GINE architecture achieves exceptional performance with ${R}^{2} = {0.931}$ , outperforming the best random forest implementation $\left( {{R}^{2} = {0.908}}\right)$ by a statistically significant margin of 0.023 .
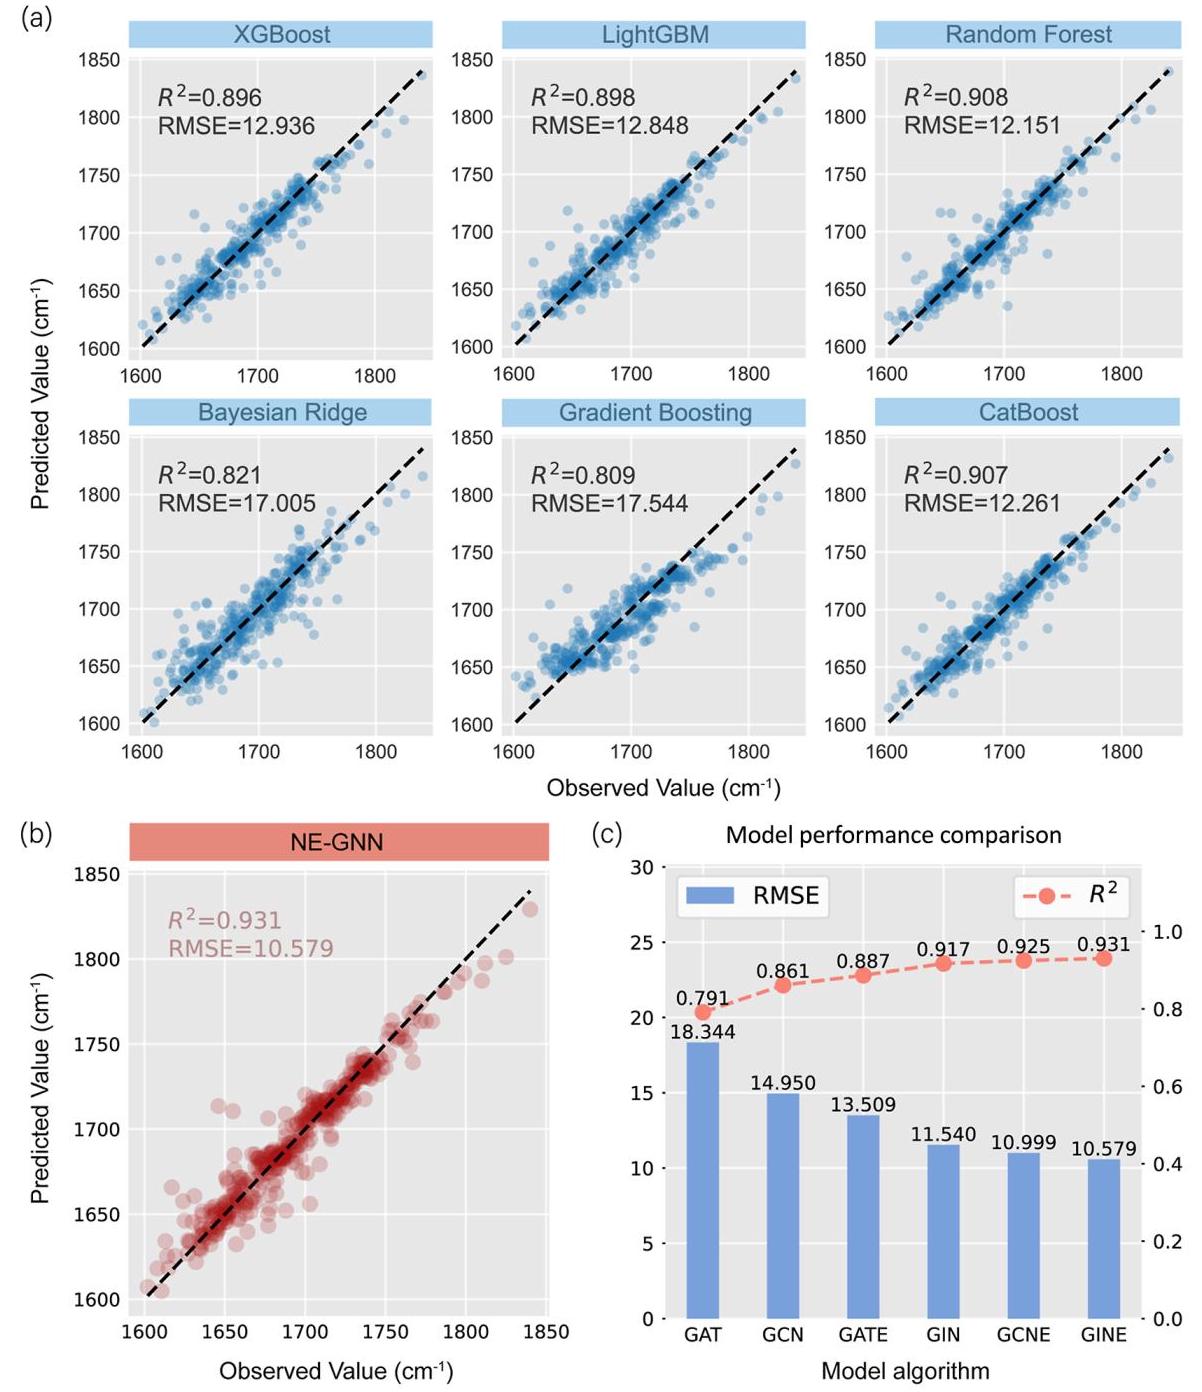
Figure 3. Model performance analysis. (a) Model performance analysis under different algorithms. (b) Prediction effect of NE-GNN. (c) Comparison of different graph convolution models.
Table 1. Prediction Results of Carbonyl Compounds
| molecule[cm ${}^{-1}$ ] |  |  |  |
| observed value | 1653.00 | 1767.00 | 1721.00 |
| NE-GNN | 1652.62 | 1767.26 | 1722.11 |
| Bayesian Ridge | 1666.95 | 1743.81 | 1710.66 |
| CatBoost | 1657.53 | 1746.45 | 1709.56 |
| Gradient Boosting | 1659.38 | 1744.62 | 1698.67 |
| LightGBM | 1663.67 | 1749.47 | 1703.01 |
| Random Forest | 1661.30 | 1753.55 | 1705.92 |
| XGBoost | 1654.66 | 1747.40 | 1704.84 |
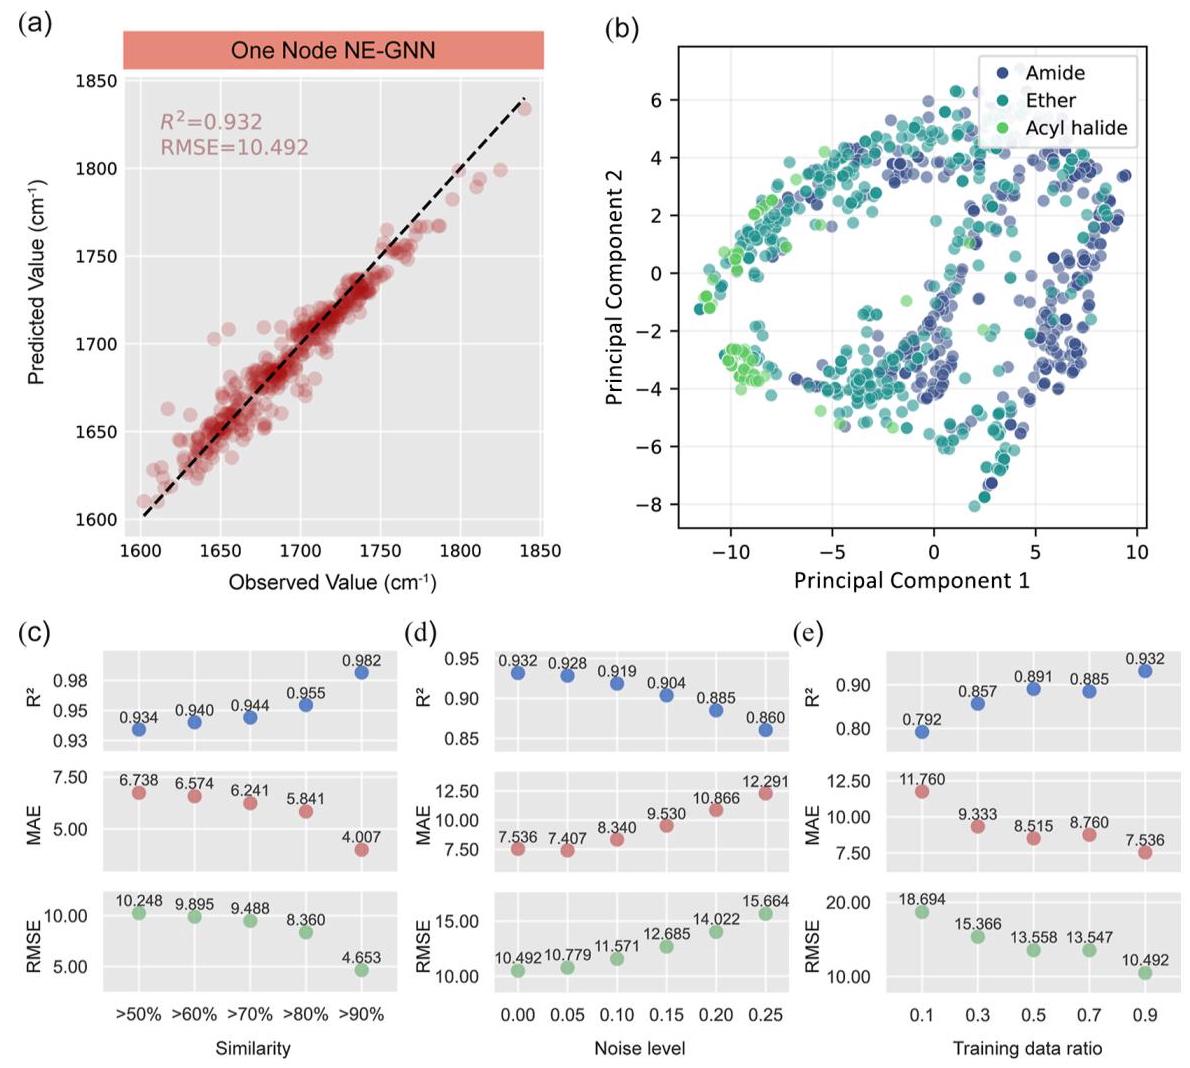
Figure 4. Model robustness analysis. (a) Model performance when selecting potential vectors of carbon in carbonyl groups for prediction. (b) Dimensionality reduction and visualization of molecular potential embeddings were performed using t-SNE, with the following hyperparameter configuration: perplexity $= {50}$ , learning_rate $= {200}$ , and $n\_ {iter} = {600}$ . (c) Comparison of model prediction performance on test-set molecules that conform to a similarity threshold relative to training-set molecules, where molecular similarity is computed using Morgan circular fingerprints (radius = 2) generated by RDKit’s ‘AllChem.GetMorganFingerprint. (d) Model tendency with introduced Gaussian noise at different intensity levels. (e) Performance comparison under different training set size.
The incorporation of neighbor features into our graph neural network architecture has yielded superior predictive performance for carbonyl stretching frequencies, particularly demonstrating an enhanced capability in capturing both ring strain effects and distal chemical environments. As evidenced in Table 1, the GNN achieves remarkable accuracy for carbonyl groups embedded in cyclic systems: for the first molecule featuring a six-membered ring carbonyl, the prediction error is merely ${0.38}{\mathrm{\;{cm}}}^{-1}$ , compared to the minimal error of the SNM model of ${1.662}{\mathrm{\;{cm}}}^{-1}$ . The second molecule, which contains a five-membered carbonyl ring, shows a negligible GNN prediction error of ${0.269}{\mathrm{\;{cm}}}^{-1}$ , dramatically less than the error of the random forest model of ${13.45}{\mathrm{\;{cm}}}^{-1}$ . This exceptional performance stems from the GNN’s heightened sensitivity to ring strain effects, which strengthen exocyclic double bonds and consequently increase vibrational frequencies, a phenomenon that aligns precisely with established chemical theory. Furthermore, the third molecule exemplifies the GNN’s superior ability to leverage distal structural information: by effectively accounting for atomic environments separated by one intervening atom, the model predicts 1722.11 ${\mathrm{{cm}}}^{-1}$ , closely matching the experimental value of 1721.00 ${\mathrm{{cm}}}^{-1}$ . This illustrates the architecture’s advanced capacity to capture subtle electronic influences that conventional SNM approaches fail to adequately represent.
Ablation Experiments
We systematically evaluated the impact of feature reduction through an ablation strategy: complete edge feature removal. As shown in Figure 3c, models without edge features (GIN, GAT, GCN) exhibited consistent performance degradation compared to their edge-aware counterparts. ${}^{24}$ The GAT architecture demonstrated particular sensitivity to feature removal, suffering the most significant performance drop. Notably, the edge-enhanced GCNE variant achieved near-parity with GINE $\left( {{R}^{2}\text{ difference } < {0.006}}\right)$ , indicating that conventional graph convolution mechanisms can rival more complex isomorphism-preserving architectures for carbonyl peak prediction when properly equipped with edge attributes (Figure S3).
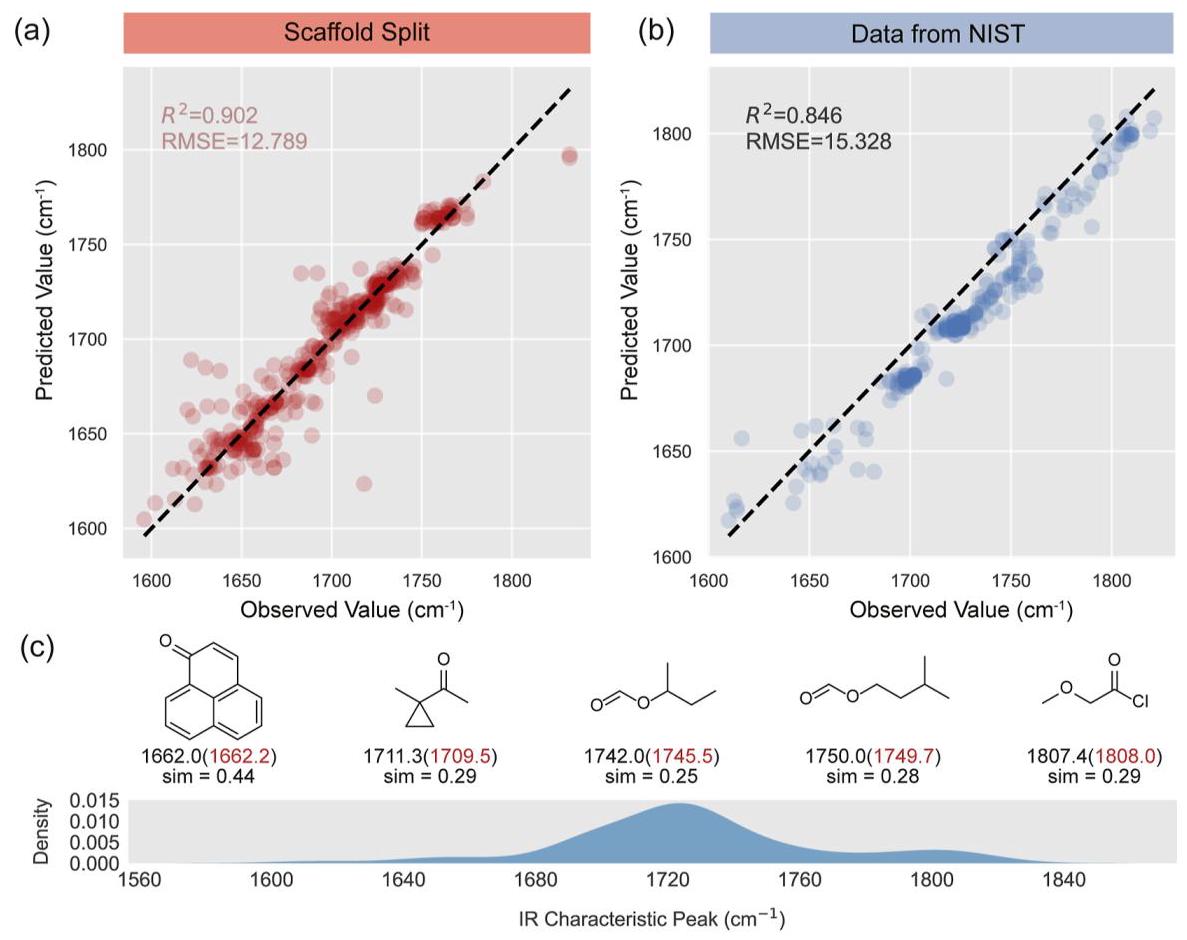
Figure 5. Model generalization analysis. (a) Performance of the model trained with a scaffold split on the test set. (b) The performance of the model in the data set acquired in Nist. (c) Distribution of infrared absorption frequencies for molecules from Nist and the example of OOD molecules in the Nist data set. The values outside the brackets are observed values, the wavenumber in the brackets represents the model predicted wavenumber, and sim is the Tanimoto similarity between the numerator and the training set.
In addition, we also tested NE-GNN with neighborhood features removed, NE-GNN with important neighborhood features (neighbor in ring, in ring, neighbor electronegativity, neighbor double bond) removed, and regular GNN with edge features and environmental features. The results demonstrated a significant performance degradation when several critical neighborhood features were removed, with the model exhibiting the poorest effectiveness when both edge features and environmental features were eliminated (Figure S3).
As illustrated in Figure 3c, our experimental results demonstrate that among edge-enhanced graph neural networks GINE achieves superior performance $\left( {{R}^{2} = {0.931}}\right)$ , while GCNE shows slightly reduced but still competitive results $\left( {R}^{2}\right.$ = 0.925). Both architectures significantly outperform the structural neighborhood matching (SNM) approach. In contrast, GATE exhibits notably poorer performance $\left( {{R}^{2} = }\right.$ 0.887), potentially attributable to two factors: (1) insufficient training data for effective attention weight learning and (2) inherent limitations in the default GATE architecture for capturing atomic interactions critical to carbonyl vibrations, suggesting the need for domain-specific architectural modifications.
Node Selection Strategy
Our investigation of node selection approaches reveals that single-node (carbonyl carbon) prediction outperforms dual-node (carbonyl carbon and adjacent atom) strategies (Figure 4a). This finding presents an important optimization direction, indicating that the complex structural analysis of both carbonyl neighbors (as employed in SNM) may be unnecessary. The performance degradation observed in dual-node approaches may stem from feature vector concatenation order sensitivity, an issue avoided when using solely the carbonyl carbon’s features. However, single-node prediction requires slightly higher latent space dimensionality (128 vs 256 dimensions) to maintain predictive accuracy. This suggests that while single-node strategies simplify the model architecture, they may necessitate richer feature representations to fully capture the local chemical environment’s influence on carbonyl vibrations.
Notably, dual-node strategies retain their utility for specific molecular contexts, particularly in characterizing symmetric functional groups like olefinic bonds, where bilateral atomic features provide more comprehensive representations. The inherent flexibility of our framework enables adaptive node selection strategies, allowing the model to dynamically employ either single- or dual-node approaches based on chemical context. This architectural versatility not only enhances predictive performance across diverse functional groups but also significantly improves the model’s generalization capability, establishing a robust foundation for broad-spectrum vibrational spectroscopy applications.
Latent Space Visualization
To elucidate the model’s internal representation of molecular structures, we employed t-SNE dimensionality reduction to visualize the learned latent space embeddings (Figure 4b). ${}^{33}$
The resulting plot reveals distinct clustering patterns corresponding to different carbonyl functional groups, indicating that the model effectively captures the chemically relevant features. It is worth noting that the carbonyl carbons of molecules with similar carbon-based environments are relatively tightly clustered in the potential space, the acyl halides are relatively far from the amides, and the esters are relatively clustered between the two, indicating that NE-GNN has learned to distinguish subtle structural changes that affect the vibration frequency. This clustering behavior underscores the model’s ability to internalize complex chemical relationships, providing insights into how molecular features are encoded and utilized for accurate spectral predictions.
Model Robustness Analysis
To further investigate the model’s robustness, we systematically evaluated its performance under varying training ratios, noise levels, and test set similarity conditions. Our methodology uses the Tanimoto coefficient-a standard similarity measure in cheminformatics that compares 2D molecular fingerprints. It ranges from 0 (no similarity) to 1 (identical), and is defined as
$$ T\left( {A, B}\right) = \frac{\left| A \cap B\right| }{\left| A\right| + \left| B\right| - \left| {A \cap B}\right| } \tag{3} $$where $\left| A\right|$ and $\left| B\right|$ are the numbers of bits set in the fingerprints of molecules $A$ and $B$ , and $\left| {A \cap B}\right|$ is the number of common bits. This ratio reflects the overlap of molecular features relative to their total distinct features.
According to assessments, the prediction accuracy shows that as the proportion of similar molecules increases, the performance of the model prediction tends to improve. For molecules with higher similarity, our model may be better at predicting (Figure 4c). The model maintains robust performance with ${R}^{2} = {0.904}$ at a noise level 0.15 and preserves ${R}^{2} =$ 0.860 even when the noise increases to 0.25 . Regarding data efficiency, the NE-GNN achieves ${R}^{2} = {0.857}$ with only 30% training data, while progressively improving with larger training sets, indicating substantial potential for enhanced accuracy with expanded data sets.
Model Generalization Analysis
To evaluate the generalizability of our model, we employed scaffold-based data splitting using the Murcko framework implemented in RDKit. This strategy groups molecules sharing similar core scaffolds into the same subset while assigning structurally distinct compounds to separate subsets, thereby providing a rigorous assessment of the out-of-distribution- (OOD) performance (Figure 5a). The resulting test yielded an ${R}^{2}$ of 0.902-slightly lower than the performance on random splits, yet still maintaining a high baseline. This indicates that our model retains strong predictive capability, even when confronted with molecules bearing unseen molecular scaffolds.
Furthermore, to probe model robustness on underrepresented carbonyl subclasses in our data set, we curated additional experimental IR spectra from the NIST Chemistry WebBook. When applied to this external test set, our model achieved an ${R}^{2}$ of 0.846 (Figure 5b, c). Although this represents a modest decline compared to the performance of our internal data, the root-mean-square error (RMSE) remains low, indicating strong predictive capability. The slight performance drop is likely attributable to the fact that the NIST spectra are predominantly recorded in the gas phase-whereas our training data primarily consist of condensed-phase measurements. This observation highlights a promising direction for future work: augmenting our data set with publicly available gas-phase IR spectra, particularly for rare carbonyl subclasses, to further enhance model coverage and robustness.
In order to comprehensively evaluate the performance of the NE-GNN model specifically used to predict the characteristic infrared absorption values of functional groups, we conducted a comparative analysis of two established infrared full-spectrum prediction models: AttentiveFP, which was trained based on experimental spectral data, and DetaNet, which was based on FT calculation data. ${}^{{15},{34}}$ Using the same test set data, we replicated both models and analyzed key performance indicators including RMSE and ${R}^{2}$ (Figure 6). NE-GNN achieves a significantly lower prediction error and higher correlation compared to these full-spectrum approaches. The full-spectrum models distribute their capacity across the entire vibrational landscape and optimize global loss functions (e.g., spectral intensity similarity or SIS loss) that do not prioritize accurate localization of individual functional group bands. Consequently, they often fail to produce a distinct, sufficiently intense peak in the carbonyl region for certain molecules-sometimes even missing the carbonyl absorption entirely. In contrast, our NE-GNN is explicitly designed to focus on the local chemical environment of the carbonyl group, making it less susceptible to interference from distant or unrelated functional groups. This focused architecture enables more chemically consistent predictions and higher interpretability.
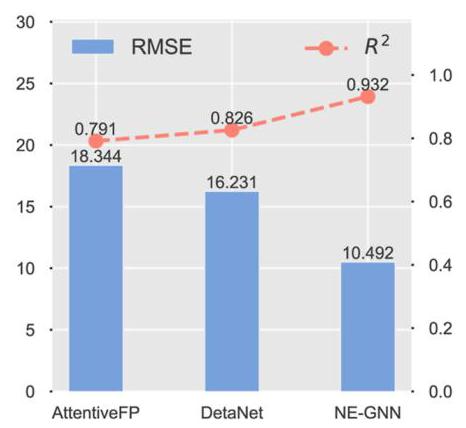
Figure 6. Performance comparison between AttentiveFP, DetaNet, and NE-GNN models. The bar chart shows the RMSE for each model, and the line chart shows the ${R}^{2}$ for each model.
Application to Multicarbonyl and Diazo Compounds
To evaluate the generalizability of our model, we conducted a parallel analysis on diazo functional groups using a data set of 1824 molecules compiled from existing literature. ${}^{14}$ Furthermore, we assessed the model’s performance on multicarbonyl compounds despite its exclusive training on monocarbonyl data. To establish a framework for multifunctional group prediction and evaluate integrated model performance, we selected two representative molecules containing two carbonyl groups and one diazo group for case analysis (Table 2). For the first molecule, NE-GNN more accurately predicted the peak of first group $\left( {{1738.51}{\mathrm{\;{cm}}}^{-1}\text{ vs observed }{1736}{\mathrm{\;{cm}}}^{-1}}\right)$ , while for the second carbonyl group, the errors of both models increased slightly, but the error of NE-GNN was slightly smaller. Both models exhibited a comparable deviation for the diazo group prediction (Figure S4). For the second molecule, the GNN maintained deviations below ${11}{\mathrm{\;{cm}}}^{-1}$ for both carbonyl groups, significantly outperforming RF’s deviations exceeding ${20}{\mathrm{\;{cm}}}^{-1}$ . This superior performance likely stems from our model’s enhanced ability to capture the influence of charged neighboring groups like diazo functionalities, where traditional RF approaches exhibit clear limitations in feature extraction. This performance indicates that the graph neural network effectively captures the fundamental chemical principles governing carbonyl vibrations, enabling accurate predictions even in the presence of multiple interacting carbonyl groups. As for the prediction of the diazo group of the second molecule, although the data set used to train the diazo group model is only 1824, our NE-GNN prediction value is 2134.23, which is closer to the observed value of 2137.00 than the RF prediction of 2133.31. The results suggest that the model’s learned representations are sufficiently general to extend beyond its training scope, highlighting its potential utility for broader applications in infrared spectral analysis.
Table 2. Prediction Results of Multi-Carbonyl and Diazo Compounds
| molecule | observed value[cm ${}^{-1}$ ] | NE-GNN predicted value $\left\lbrack {\mathrm{{cm}}}^{-1}\right\rbrack$ | Random Forest predicted value $\left\lbrack {\mathrm{{cm}}}^{-1}\right\rbrack$ |
 | ① 1736.00 | ① 1738.51 | ① 1740.57 |
| ② 1639.00 | ② 1644.43 | ② 1647.10 | |
| ③ 2110.00 | ③ 2104.90 | ③ 2104.06 | |
 | ① 1719.00 | ① 1729.93 | ① 1697.23 |
| ② 1655.00 | ② 1659.21 | © 1684.92 | |
| ③ 2137.00 | ③ 2134.23 | ③ 2133.31 |
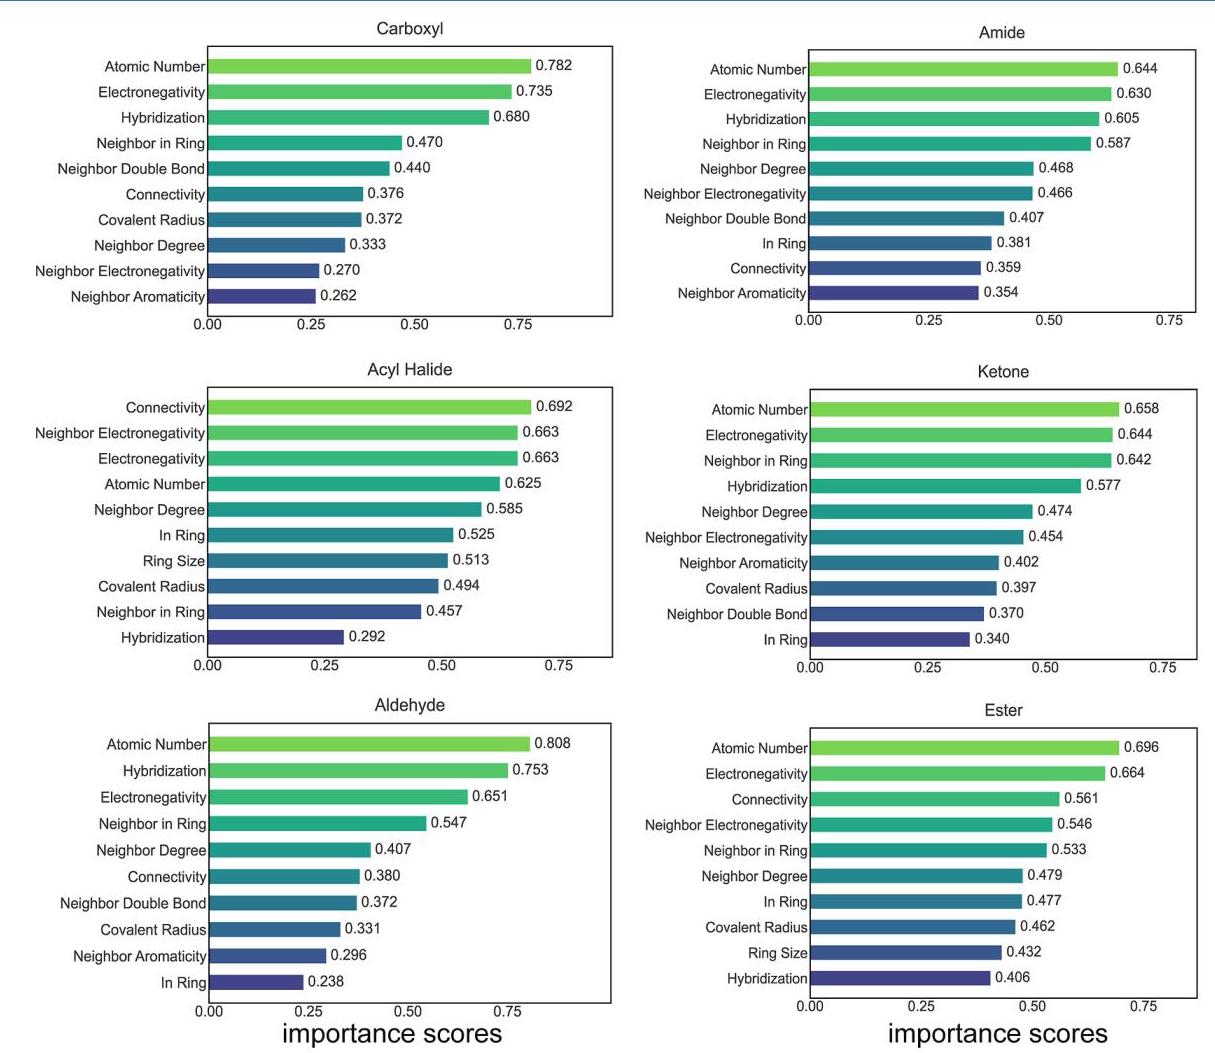
Figure 7. Statistical analysis of feature importance via GNNExplainer reveals the top ten critical characteristics across several carbonyl subclasses in the data set.
Model Decision-Making Process and Interpretability Analysis
We employed GNNExplainer to interpret the molecular prediction outcomes and performed direction-aware interpretability analysis by integrating GNNExplainer with a Perturbation-Based Sensitivity Analysis (PSA). Figure 7 gives the statistics on the importance of several carbonyl subclasses in the data set and Figure 8 gives the interpretable analytical examples of representative molecules in the carbonyl subclass.
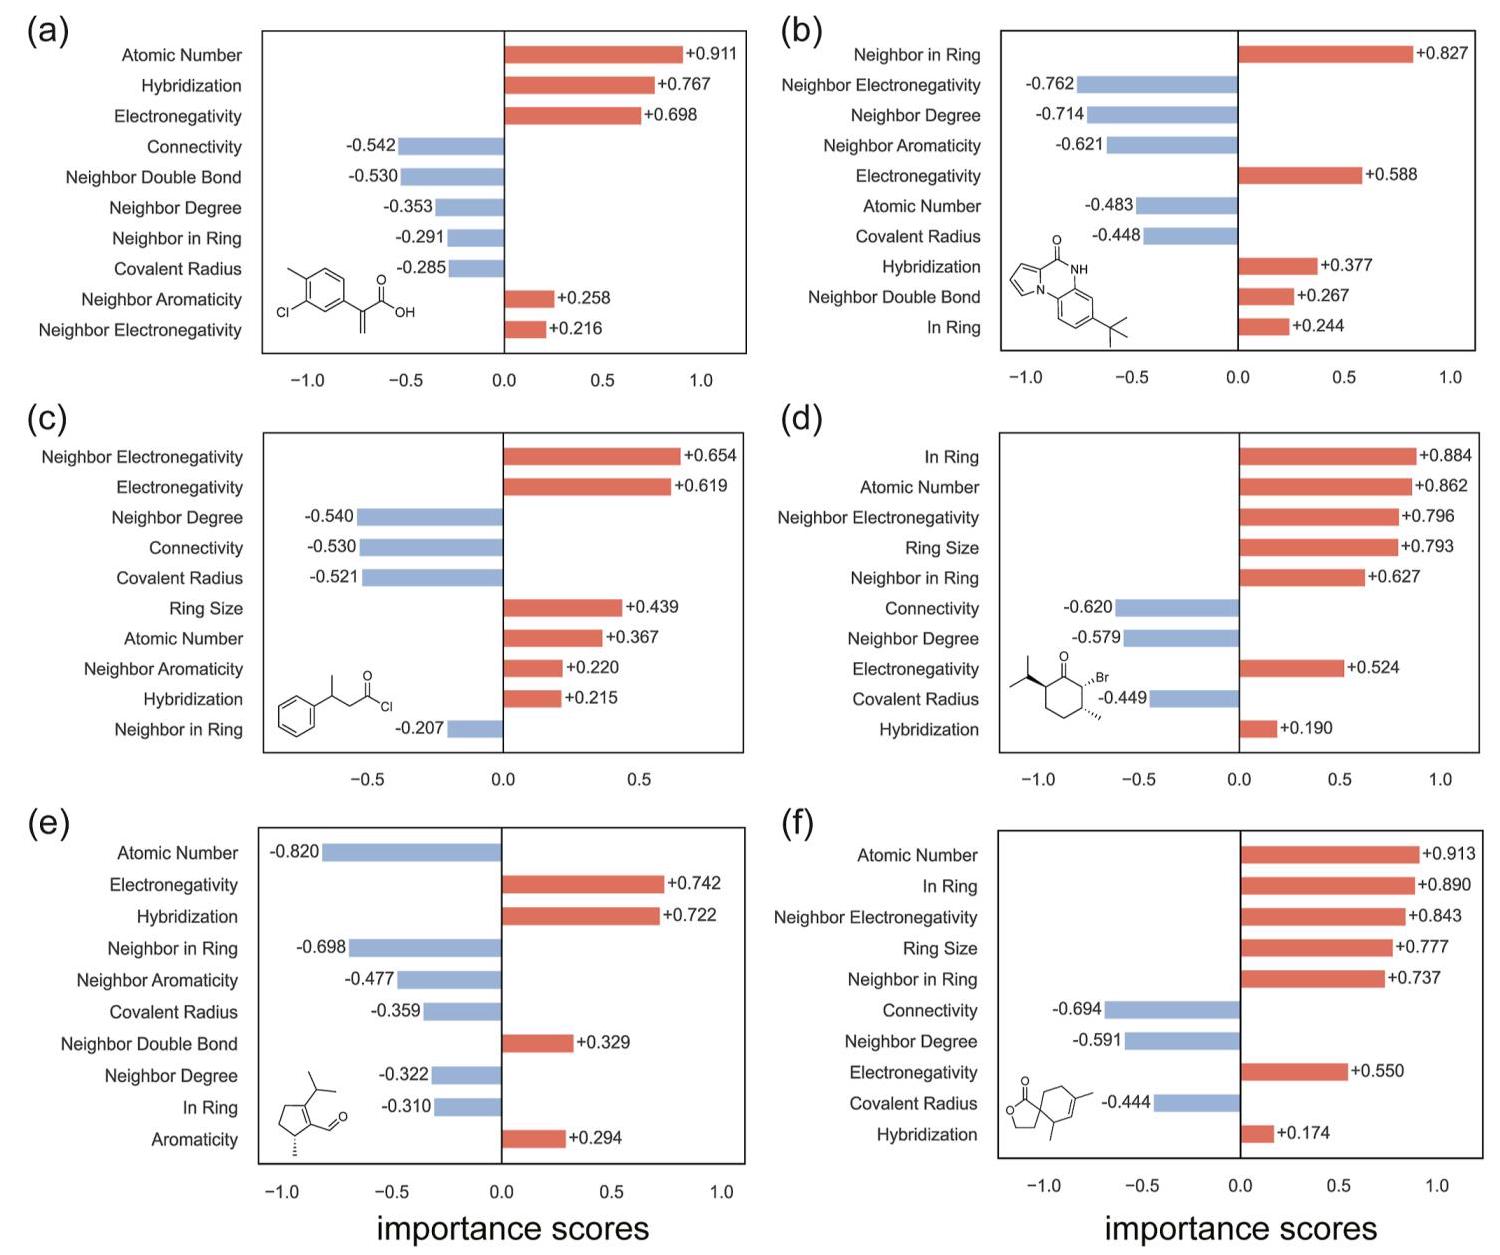
Figure 8. Interpretable analytical examples of representative molecules in the carbonyl subclass: (a) carboxylic acids, (b) amide, (c) acyl halide, (d) ketones, (e) aldehydes, (f) esters. Positive values (red) indicate features that promote absorption peak, while negative values (blue) indicate inhibitory effects.
Average absolute importance scores were computed for key structural features, using absolute values to account for potentially opposing directional effects across molecules, and results were stratified by the carbonyl subclass. As shown in Figure 7, electronegativity and atomic number consistently rank among the top contributors across nearly all subclasses. Ring-related features are especially important for cyclic carbonyls, appearing within the top five categories for ketones, esters, and lactams. Even in acid halides-where the carbonyl is rarely cyclic-the “neighbor in ring” feature retains notable importance (rank 9, score = 0.457), and both “ring size” and “in ring” appear at ranks 6 and 7. Additionally, features such as connectivity, hybridization, and neighboring double bonds exhibit relatively high importance across several subclasses. This suggests that within specific chemical contexts these structural attributes may collectively influence carbonyl stretching frequencies through complex electronic effects, including inductive, steric, and conjugative interactions. Aggregating importance scores by subclass and reporting their means reveal consistent trends that align with established principles of physical organic chemistry, indicating a plausible association between these features and spectral behavior.
Taking three representative molecules as examples, in Figure 8a, the enhancement of hybridization is pronounced: ${\mathrm{{sp}}}^{2}$ hybridization contributes to an increase in electronegativity. However, the neighbor-double bond likely engages in a conjugation effect with the carbonyl group, which appears to be the dominant factor. Consequently, an explainable analysis of this molecule reveals a strong inhibitory effect associated with the neighboring double bond. Additionally, the promoting roles of atomic number and electronegativity suggest that the model may have captured the inductive effect exerted by the oxygen atoms in the carboxyl group on the carbonyl moiety.
For 7-(tert-butyl)pyrrolo[1,2-a]quinoxalin-4(5H)-one in Figure 8b, the carbonyl group is embedded within a ring system, and consequently, the neighbor in ring exhibits the strongest promoting effect on the peak. In contrast, Neighbor Electronegativity likely reflects an inhibitory influence associated with the presence of less electronegative atoms-such as nitrogen-in the vicinity of the carbonyl group. Additionally, features such as Neighbor degree and Neighbor aromatic may indicate that the model has captured the suppressive effect of conjugation between the carbonyl and the surrounding aromatic rings on the peak intensity.
For 6,8-Dimethyl-2-oxaspiro[4.5]dec-7-en-1-one in Figure 8f, the framework identifies several characteristics with high importance scores: atomic number, neighbor electronegativity, and three ring-related characteristics, and all of these five characteristics positively affect the wavenumber of carbonyl groups, which is consistent with the induction effect of oxygen and the chemical principle that the chemical environment in the ring causes the carbonyl absorption peak to blue shift. The important subgraphs of the two molecules in Figure 8b, f can be found in Figure S5.
This direction-sensitive, importance analysis reveals a strong correlation between the model’s behavior and well-established concepts in physical organic chemistry-such as ring strain, inductive effects, resonance, conjugation, and steric constraints-enabling us to interpret the model’s predictions within a chemically reasonable framework. Our exploration of core subgraphs and critical edges for representative molecules highlights structural motifs that are plausibly associated with differences in carbonyl infrared stretching frequencies. The identified patterns reflect familiar chemical intuitions about how local connectivity and bonding environments may relate to vibrational properties. While these findings do not establish causal relationships, they indicate that the explanations generated by GNNExplainer align with expected chemical reasoning, offering interpretable and contextually relevant insights into the model’s decision process.
CONCLUSION
The Neighbor Enhanced Graph Neural Networks (NE-GNN) demonstrate exceptional predictive performance for carbonyl groups by effectively incorporating proximal structural features into molecular representations. This enhanced feature encoding strategy, particularly the utilization of feature vectors from key connecting atoms that bridge functional groups with the molecular scaffold, exhibits a remarkable generalization capability and promising application potential across diverse chemical contexts. The model’s ability to capture subtle electronic and steric effects through this approach provides a robust framework for accurate infrared spectral predictions.
Notwithstanding these advances, several limitations warrant further investigation. The CIAC data set focuses on the coverage of several carbonyl subclasses, and a more comprehensive data set can be further expanded in the future. The current implementation does not account for hydrogen bonding interactions or three-dimensional molecular conformations, which are known to significantly influence carbonyl vibrational frequencies through spatial and electronic effects. While the feature extraction component maintains reasonable chemical interpretability, the graph readout mechanism remains challenging to analyze through conventional chemical principles. Addressing these aspects, particularly through incorporation of spatial constraints and development of more interpretable aggregation operations, represents crucial directions for future optimization. Such improvements would not only enhance prediction accuracy but also provide deeper physicochemical insights, ultimately advancing the application of machine learning in functional-group-specific infrared spectral analysis and unlocking new possibilities in computational spectroscopy.
A ASSOCIATED CONTENT
Data Availability Statement
The computational models and data sets reported in this work are available at https://github.com/keyouss/IR-Carbonyl-Graph-main.
M Supporting Information
The Supporting Information is available free of charge at https://pubs.acs.org/doi/10.1021/prechem.5c00332.
Process of data acquisition; distribution of the CIAC data set; ablation experiments for NE-GNN; performance of the model applied to diazo compounds; importance subgraphs of two example molecules; mathematical formulas for evaluation; and the statistical table of the CIAC data set (PDF)
A UTHOR INFORMATION
Corresponding Author
Fanyang Mo - School of AI for Science, Peking University Shenzhen Graduate School, Shenzhen 518055, China; School of Advanced Materials and Guangdong Provincial Key Laboratory of Nano-Micro Materials Research, Peking University Shenzhen Graduate School, Shenzhen 518055, China; State Key Laboratory of Advanced Waterproof Materials, School of Materials Science and Engineering, Peking University, Beijing 100871, China; (Corcid.org/ 0000-0002-4140-3020;
Authors
Jie Shi - School of AI for Science, Peking University Shenzhen Graduate School, Shenzhen 518055, China; School of Advanced Materials, Peking University Shenzhen Graduate School, Shenzhen 518055, China
Chengchun Liu - School of AI for Science, Peking University Shenzhen Graduate School, Shenzhen 518055, China; State Key Laboratory of Advanced Waterproof Materials, School of Materials Science and Engineering, Peking University, Beijing 100871, China; © orcid.org/0009-0002-5550-4145
Complete contact information is available at:
https://pubs.acs.org/10.1021/prechem.5c00332
Author Contributions
F.M. and J.S. conceived the project, designed the method, and analyzed the results. J.S. trained the ML model. J.S. and C.L. organized and prepared structural data. F.M. and J.S. wrote the paper. F.M. supervised the project.
Notes
The authors declare no competing financial interest.
ACKNOWLEDGMENTS
We thank Peking University Shenzhen Graduate School and Shenzhen Government for the start-up funding support. We thank the High-Performance Computing Platform of Peking University for machine learning model training. We thank Dr. Hao Xu for his guidance on graph neural network theory.
REFERENCES
(1) Dutta, A. Fourier transform infrared spectroscopy. In Spectroscopic Methods for Manomaterials Characterization, 2017; pp 73-93..
(2) Lansford, J. L.; Vlachos, D. G. Infrared spectroscopy data-and physics-driven machine learning for characterizing surface microstructure of complex materials. Nat. Commun. 2020, 11, 1513.
(3) Hudgins, D. M.; Sandford, S. A. Infrared spectroscopy of matrix isolated polycyclic aromatic hydrocarbons. 1. PAHs containing two to four rings. J. Phys. Chem. A 1998, 102, 329-343.
(4) Wang, T.; Tan, Y.; Chen, Y. Z.; Tan, C. Infrared spectral analysis for prediction of functional groups based on feature-aggregated deep learning. J. Chem. Inf. Model. 2023, 63, 4615-4622.
(5) Ren, H.; Li, H.; Zhang, Q.; Liang, L.; Guo, W.; Huang, F.; Luo, Y.; Jiang, J. A machine learning vibrational spectroscopy protocol for spectrum prediction and spectrum-based structure recognition. Fundam. Res. 2021, 1, 488-494.
(6) Na, G. S.; Rho, Y. Explainable Machine Learning for Characterizing Unknown Molecular Structures in Infrared Spectra. Anal. Chem. 2025, 97, 20869-20878.
(7) Han, R.; Ketkaew, R.; Luber, S. A concise review on recent developments of machine learning for the prediction of vibrational spectra. J. Phys. Chem. A 2022, 126, 801-812.
(8) Punjabi, D.; Huang, Y.-C.; Holzhauer, L.; Tremouilhac, P.; Friederich, P.; Jung, N.; Bräse, S. Infrared spectrum analysis of organic molecules with neural networks using standard reference data sets in combination with real-world data. J. Cheminf. 2025, 17, 1-13.
(9) Shaban Tameh, M.; Coropceanu, V.; Purcell, T. A.; Brédas, J.-L. Prediction of the Infrared Absorbance Intensities and Frequencies of Hydrocarbons: A Message Passing Neural Network Approach. J. Phys. Chem. A 2024, 128, 9695-9706.
(10) Xu, H.; Lin, J.; Zhang, D.; Mo, F. Retention time prediction for chromatographic enantioseparation by quantile geometry-enhanced graph neural network. Nat. Commun. 2023, 14, 3095.
(11) Gillespie, R. J.; Robinson, E. A. Models of molecular geometry. Chem. Soc. Rev. 2005, 34, 396-407.
(12) Keith, J. A.; Vassilev-Galindo, V.; Cheng, B.; Chmiela, S.; Gastegger, M.; Muller, K.-R.; Tkatchenko, A. Combining machine learning and computational chemistry for predictive insights into chemical systems. Chem. Rev. 2021, 121, 9816-9872.
(13) Kovács, P.; Zhu, X.; Carrete, J.; Madsen, G. K.; Wang, Z. Machine-learning prediction of infrared spectra of interstellar polycyclic aromatic hydrocarbons. Astrophys. J. 2020, 902, 100.
(14) Liu, C.; Zou, R.; Mo, F. Infrared Spectra Prediction for Functional Group Region Utilizing a Machine Learning Approach with Structural Neighboring Mechanism. Anal. Chem. 2024, 96, 15550-15562.
(15) Saquer, N.; Iqbal, R.; Ellis, J. D.; Yoshimatsu, K. Infrared spectra prediction using attention-based graph neural networks. Digit. Discovery 2024, 3, 602-609.
(16) Zhang, W.; Kasun, L. C.; Wang, Q. J.; Zheng, Y.; Lin, Z. A review of machine learning for near-infrared spectroscopy. Sensors 2022, 22, 9764.
(17) Gastegger, M.; Schütt, K. T.; Müller, K.-R. Machine learning of solvent effects on molecular spectra and reactions. Chem. Sci. 2021, 12, 11473-11483.
(18) Lou, S.; Liu, C.; Zhang, D.; Chen, Y.; Mo, F. Unsupervised Hierarchical Symbolic Regression for Interpretable Property Modeling in Complex Multi-Variable Systems. Adv. Sci. 2026, No. e21200.
(19) Bellamy, L. The Infra-Red Spectra of Complex Molecules; Springer Science & Business Media, 2013; ..
(20) Margraf, J. T. Science-Driven Atomistic Machine Learning. Angew. Chem., Int. Ed. 2023, 62, No. e202219170.
(21) Kleine, T. S.; Lee, T.; Carothers, K. J.; Hamilton, M. O.; Anderson, L. E.; Ruiz Diaz, L.; Lyons, N. P.; Coasey, K. R.; Parker Jr, W. O.; Borghi, L.; et al. Infrared fingerprint engineering: a molecular-design approach to long-wave infrared transparency with polymeric materials. Angew. Chem., Int. Ed. 2019, 58, 17656-17660.
(22) Liu, Y.; Li, Y.; Yang, Q.; Yang, J.-D.; Zhang, L.; Luo, S. Prediction of Bond Dissociation Energy for Organic Molecules Based on a Machine-Learning Approach. Chin. J. Chem. 2024, 42, 1967- 1974.
(23) Liu, C.; Mo, F. Automation and AI-Powered Prediction in Chromatographic Separation. Acc. Chem. Res. 2026, 59, 138-150.
(24) Rao, J.; Zheng, S.; Lu, Y.; Yang, Y. Quantitative evaluation of explainable graph neural networks for molecular property prediction. Patterns 2022, 3, 100628.
(25) Liu, S.; Ying, R.; Dong, H.; Li, L.; Xu, T.; Rong, Y.; Zhao, P.; Huang, J.; Wu, D.. International Conference on Machine Learning, 2022; pp 14054-14072.
(26) Muratov, E. N.; Bajorath, J.; Sheridan, R. P.; Tetko, I. V.; Filimonov, D.; Poroikov, V.; Oprea, T. I.; Baskin, I. I.; Varnek, A.; Roitberg, A.; et al. QSAR without borders. Chem. Soc. Rev. 2020, 49, 3525-3564.
(27) Doan, V. H. M.; Ly, C. D.; Mondal, S.; Truong, T. T.; Nguyen, T. D.; Choi, J.; Lee, B.; Oh, J. Fcg-former: identification of functional groups in FTIR spectra using enhanced transformer-based model. Anal. Chem. 2024, 96, 12358-12369.
(28) Lin, J.; Mo, F. Empowering research in chemistry and materials science through intelligent algorithms. Artif. Intell. Chem. 2024, 2, 100035.
(29) McGill, C.; Forsuelo, M.; Guan, Y.; Green, W. H. Predicting infrared spectra with message passing neural networks. J. Chem. Inf. Model. 2021, 61, 2594-2609.
(30) Xu, K.; Hu, W.; Leskovec, J.; Jegelka, S. How powerful are graph neural networks? arXiv preprint. arXiv 2018, arXiv:1810.00826.
(31) Stienstra, C. M.; Hebert, L.; Thomas, P.; Haack, A.; Guo, J.; Hopkins, W. S. Graphormer-ir: Graph transformers predict experimental ir spectra using highly specialized attention. J. Chem. Inf. Model. 2024, 64, 4613-4629.
(32) Bao, C.; Fan, Z.; Zhang, C.; Zhang, Z. Graph Attention Networks for Accurate and Explainable Prediction of CO2 Solubility in Diverse Physical Solvents. Precis. Chem. 2025, 5c00207.
(33) Wattenberg, M.; Viégas, F.; Johnson, I. How to use t-SNE effectively. Distill 2016, 1, No. e2.
(34) Zou, Z.; Zhang, Y.; Liang, L.; Wei, M.; Leng, J.; Jiang, J.; Luo, Y.; Hu, W. A deep learning model for predicting selected organic molecular spectra. Nat. Comput. Sci. 2023, 3, 957-964.