Computed ECD spectral data for over 10,000 chiral organic small molecules
中文 / Bilingual · English version
Da Long ${}^{1,7}$ , Zhihao Li ${}^{2,7}$ , Xin Xu ${}^{1}$ , Chengchun Liu ${}^{3}$ , Hui Zhang ${}^{1}$ , Xiaoyu Cao ${}^{1\infty }$ , Liulin Yang ${}^{1\infty }$ , Xinchang Wang ${}^{1\infty }$ & Fanyang Mo ${}^{3,4,5,6\infty }$
Determining the absolute configuration of chiral molecules is of fundamental importance in the fields of natural products chemistry, asymmetric catalysis, and pharmaceutical development. A widely adopted approach involves the comparison of experimental and theoretical electronic circular dichroism (ECD) spectra, which has proven to be a reliable method for absolute configuration assignment. However, the generation of theoretical ECD spectra via time-dependent density functional theory (TD-DFT) remains the rate-limiting step in this workflow, making its acceleration both essential and challenging. Although recent advances in deep learning offer promising strategies for establishing structure-spectrum relationships and expediting theoretical spectrum prediction, the lack of standardized and comprehensive ECD spectral datasets continues to hinder progress. This study presents the Chiral Molecular Circular Dichroism Spectral (CMCDS) dataset, a systematically structural benchmark dataset that addresses the fragmentation of existing ECD data. Characterized by high standardization, scalability, and broad molecular diversity, CMCDS facilitates deep learning applications in ECD analysis and fosters data-driven discovery of chiral molecules.
Background & Summary
Chirality, a geometric property describing structures incapable of superimposition onto their mirror images via rotation or translation ${}^{1}$ , is ubiquitous in chemical and biological molecular systems ${}^{2,3}$ . Chiral molecular architectures play essential roles in a variety of functional materials, including liquid crystal displays ${}^{4}$ and nonlinear optical systems ${}^{5}$ . Owing to the differences in structure-property relationships between enantiomers, the determination of the absolute configuration has become a crucial part of chiral studies ${}^{6 - 9}$ .
The absolute configuration of small chiral molecules can be determined using various experimental and computational techniques, such as X-ray crystallography and chiroptical spectroscopy. X-ray crystallography, while offering unambiguous structural information, requires high-quality single crystals and is reliable only when the molecular structure contains atoms heavier than phosphorus, due to the need for significant anomalous dispersion effects. In cases where such heavy atoms are absent or crystallization is unsuccessful, chiroptical spectroscopies provide a powerful alternative. Techniques such as optical rotation (OR), vibrational circular dichroism (VCD), and electronic circular dichroism (ECD) are widely employed for their sensitivity to stereochemistry in solution. Among these, ECD is the most accepted and reliable method, often coupled with time-dependent density functional theory (TD-DFT) calculations to establish structure-spectrum correlations ${}^{{10},{11}}$ .
The simulation of ECD spectra is computationally demanding, and their cost increases significantly with increasing complexity of chiral structures ${}^{12}$ . This has gradually emerged as a non-negligible obstacle to the
${}^{1}$ State Key Laboratory of Physical Chemistry of Solid Surfaces, School of Electronic Science and Engineering, Innovation Laboratory for Science and Technologies of Energy Materials of Fujian Province (IKKEM) and College of Chemistry and Chemical Engineering, Xiamen University, Xiamen, 361005, China. ${}^{2}$ South China Advanced Institute for Soft Matter Science and Technology, School of Emergent Soft Matter, South China University of Technology, Guangzhou, 510640, China. ${}^{3}$ School of Materials Science and Engineering, Peking University, Beijing, 100871, China. 4AI for Science (AI4S)-Preferred Program, Peking University Shenzhen Graduate School, Shenzhen, 518055, China. ${}^{5}$ School of Advanced Materials, Peking University Shenzhen Graduate School, Shenzhen, 518055, China. ${}^{6}$ Guangdong Provincial Key Laboratory of Nano-Micro Materials Research, Peking University Shenzhen Graduate School, Shenzhen, 518055, China. ${}^{7}$ These authors contributed equally: Da Long, Zhihao Li. ${}^{\text{ ✉ }}$ ; ; ; further development of chiral research, making methodological innovations in simulation techniques increasingly imperative. A possible solution to accelerate the acquisition of ECD spectra is deep-learning method. As a data-driven methodology, deep learning extracts patterns from massive datasets through complex neural networks, achieving a paradigm shift from empirical approaches to computational intelligence in diverse fields including protein folding prediction ${}^{13}$ , targeted drug design ${}^{14}$ , and organic synthesis pathway optimization ${}^{15}$ . Based on the deep neural network framework, with the help of 130,000 organic molecules (QM9S dataset) and dynamic configuration data (QM7-X subset) for model training and testing, efficient and high-precision prediction of multi-type organic molecular spectra such as infrared, Raman, ultraviolet-visible and nuclear magnetic resonance can be achieved ${}^{16}$ . By establishing molecular structure-spectrum correlations through deep learning approaches that bypass wavefunction analysis, this predictive modelling strategy represents a transformative way to innovate ECD simulations.
OPEN
DATA DESCRIPTOR
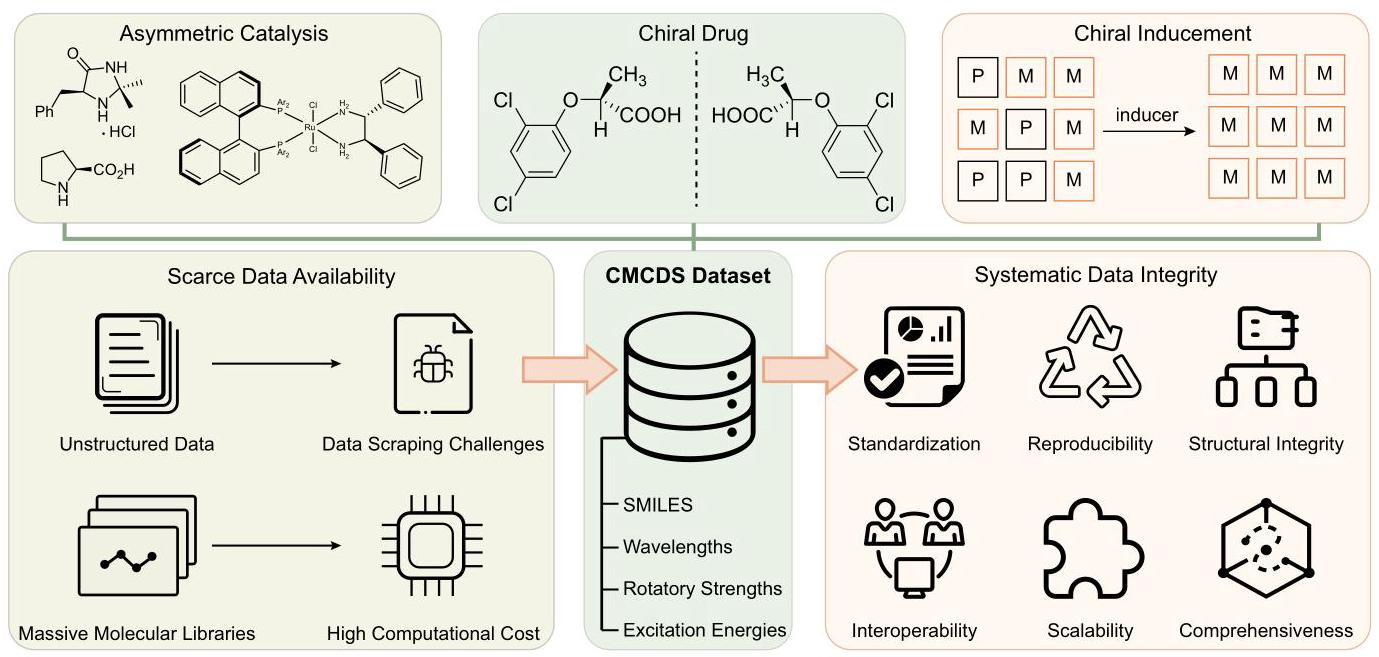
Fig. 1 Overview of the CMCDS Dataset. Chirality is widely present in various molecular structures, involving fields such as asymmetric catalysis ${}^{6,7}$ , chiral drug development ${}^{8}$ , and chiral inducement ${}^{9}$ . Due to the challenges in data collection and high computational costs, there is a lack of high-quality chiral molecular ECD spectral datasets. This work presents a standardized, highly scalable, and comprehensive CMCDS dataset with broad compound diversity.
Critical elements, including high-quality datasets, algorithmic selection and feature engineering, are essential for machine learning predictions. The development of high quality ECD spectral databases required for training sets of large-scale chiral molecules remains limited by the unstructured nature of existing experimental data and the high computational cost of theoretical simulations, posing significant challenges for machine learning applications. To address the scarcity of high-quality chiral ECD spectral datasets for chiral molecule research, this study leverages the previously established Chiral Molecule Retention Time (CMRT) dataset ${}^{17}$ . Through implementation of a systematic screening protocol, we have identified 11,095 monochiral molecular entities meeting stringent stereochemical purity criteria. Based on the SMILES structural descriptor, high-throughput calculations were performed: firstly, the molecular conformation was globally optimized by the B3LYP/6-31G(d) method ${}^{18}$ , and then the CAM-B3LYP/6-31G(d) method ${}^{19}$ was used to calculate the first 20 excited state transition parameters, and the theoretical ECD spectrum was generated by Gaussian broadening. After data cleaning, a high-fidelity chiral molecular circular dichroism spectral (CMCDS) database containing 10,887 molecules was successfully constructed ${}^{20}$ . The CMCDS dataset has the characteristics of standardization, strong scalability, and rich variety of chiral compounds, which can significantly improve ECD spectral predictions, and its systematic nature can effectively solve the problem of fragmentation of existing ECD data and provides new perspectives for advancing chiral research.
To promote transparency and reproducibility, we will publicly release all intermediate data associated with the CMCDS dataset, including the curated set of chiral molecules, geometry optimization files, and supporting code. These resources will facilitate in-depth data mining and further exploration of the structure-property relationships in chiral systems. The release of CMCDS not only supports machine-learning applications in chiral molecular research, but also serves as a foundational resource for large-scale, data-driven studies in other spectroscopy Fig. 1.
Methods
This section describes the methodological framework for generating ECD spectra through large-scale automated workflows. The workflow consists of three essential stages: (1) Molecular Coordinates Generation, (2) High-Accuracy Molecular Structure Acquisition and Excited State Simulation and (3) ECD Spectra Generation.
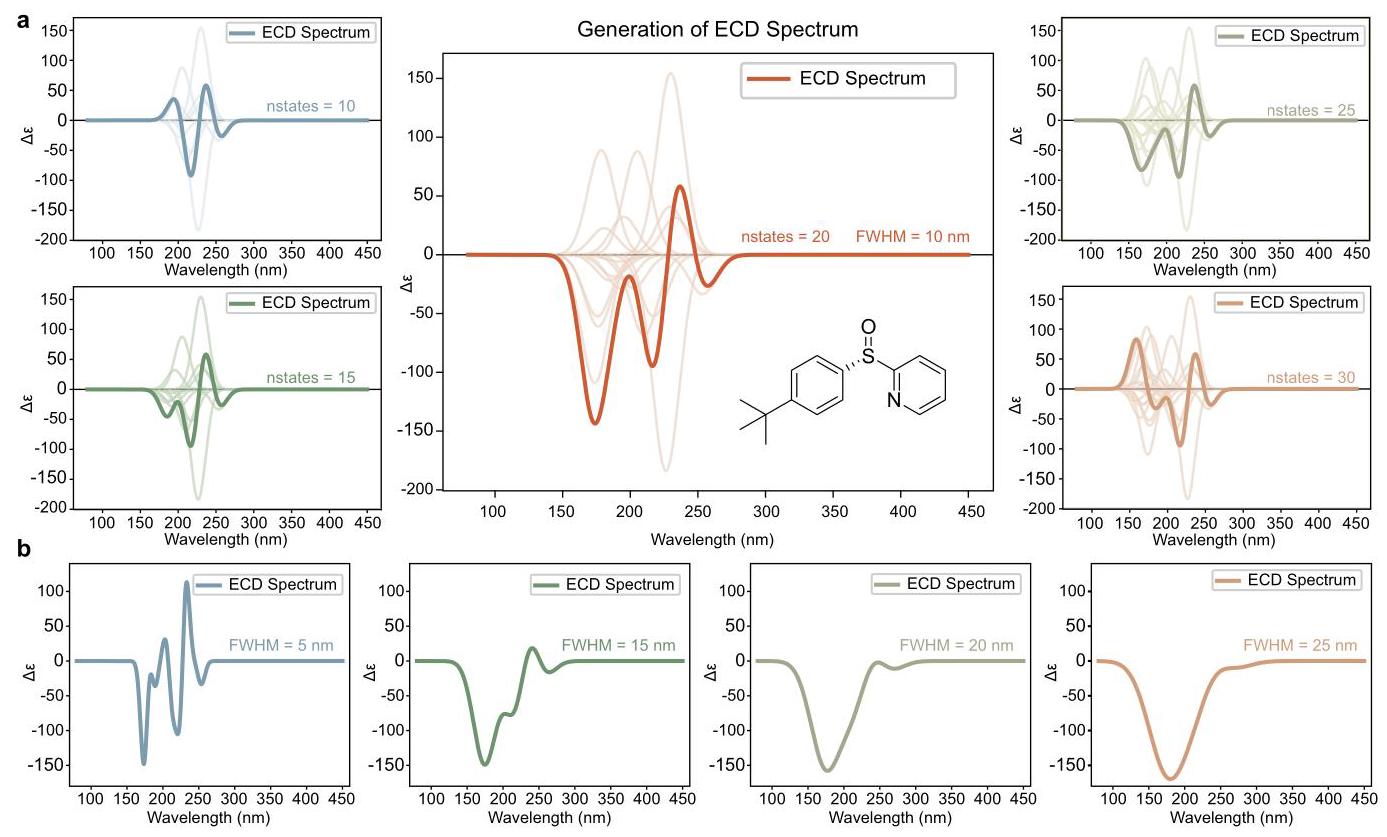
Fig. 2 Effects of the Number of Excited States (nstates) and Full Width at Half Maximum (FWHM) on ECD Spectra. (a) The complete ECD spectrum is formed by the summation of broadened peaks from individual excited states. When the number of excited states is increased, spectral features in the low-wavelength (high-energy) region exhibit significant changes, whereas the spectra in the high-wavelength (low-energy) region usually remain stable. (b) As the FWHM increases, the discrete peaks in the ECD spectrum progressively merge into a single broad peak, resulting in the loss of spectral fine structures.
Molecular Coordinates Generation. For the samples selection, SMILE descriptors of 11,095 organic molecules with mono-chiral center were extracted from the CMRT database. The 3D Cartesian coordinates of each molecule were generated by topologically dimensional expansion of the ASCII strings by RDKit packages ${}^{21}$ . The specific dimensional expansion method is Experimental-Torsion Basic Knowledge Distance Geometry (ETKDG), which based on empirical structural rules of organic molecular. The initial structures coordinates were stored in MDL Molfle format.
High-Accuracy Molecular Structure Acquisition and Excited State Simulation. To accurately evaluate the ECD spectrum for each molecule, high-accuracy structure acquisition and excited state calculations were performed on Gaussian 16 A03 packages ${}^{22}$ using geometry optimization and excited state calculation. The geometry optimization were carried out on B3LYP/6-31G(d) level. Subsequently, the excited state calculations were performed at CAM-B3LYP/6-31G(d) level using time-dependent density functional theory (TD-DFT) with 20 excited states. In this stages, four essential results were obtained for further research. The high-accuracy structures from geometry optimization provide accurate structural information for subsequent spectral property predictions. The excited states and rotatory strengths from excited state calculations detailed reflect the circular dichroism contributions of different conformations.
ECD Spectra Generation. The calculated ECD spectra for conformation were obtained through spectral broadening of discrete transitions. Specifically, the electronic excitation energies were used as peak positions, and their corresponding rotatory strengths were scaled appropriately to simulate Gaussian line shapes. The corresponding rotational strengths are scaled by a proportionality coefficient:
$$ {A}_{c, i} = k{R}_{c, i}\;\left( {k = {1.5}}\right) \tag{1} $$where ${A}_{c, i}$ is the scaled rotational strength of the $i$ -th excited state for conformation $c,{R}_{c, i}$ is the raw (unscaled) rotatory strength obtained from TD-DFT calculations, and $k$ is a proportionality constant set to 1.5 to adjust the overall intensity of the spectral peaks.
Then, a full width at half maximum (FWHM) parameter independently assigned to each excited state to construct the Gaussian function:
$$ {G}_{c, i}\left( \lambda \right) = {A}_{c, i} \cdot \exp \left( {-\frac{{\left( \lambda - {\lambda }_{0}^{\left( c, i\right) }\right) }^{2}}{2{w}^{2}}}\right) \tag{2} $$where ${G}_{c, i}\left( \lambda \right)$ is the Gaussian-broadened contribution of the $i$ -th excitation to the ECD spectrum at wavelength $\lambda ,{\lambda }_{0}^{\left( c, i\right) }$ is the central wavelength corresponding to the excitation energy after energy-to-wavelength conversion using $\lambda = {hc}/E$ , and $w$ is the width parameter related to the FWHM of the Gaussian, which determines the degree of spectral broadening (a uniform value of $w$ was used for all states).
| ID | molecule 1 | ||
| SMILES | O=C(OC)N(C)[C@H](B1OC(C)(C)C(C)C(C)C1)CC2=CC=CC=C2 | ||
| Excited State | Excitation Energy (eV) | Wavelength (nm) | Rotatory Strength (cgs (10 |
| State 1 | 5.5118 | 224.94 | 0.6422 |
| State 2 | 6.1878 | 200.37 | 12.4782 |
| State 3 | 6.9331 | 178.83 | 30.7996 |
| State 4 | 7.0228 | 176.54 | 2.9987 |
| State 5 | 7.1332 | 173.81 | -15.1975 |
| State 6 | 7.2924 | 170.02 | -29.1411 |
| State 7 | 7.4701 | 165.97 | -0.0871 |
| State 8 | 7.5577 | 164.05 | 25.5558 |
| State 9 | 7.7895 | 159.17 | -16.9203 |
| State 10 | 7.9981 | 155.02 | 1.632 |
| State 11 | 8.1545 | 152.04 | -0.0558 |
| State 12 | 8.1893 | 151.40 | 51.1103 |
| State 13 | 8.2186 | 150.86 | -7.7072 |
| State 14 | 8.3150 | 149.11 | 1.9563 |
| State 15 | 8.3695 | 148.14 | -0.2357 |
| State 16 | 8.4362 | 146.97 | -16.4282 |
| State 17 | 8.5755 | 144.58 | -6.8199 |
| State 18 | 8.5763 | 144.57 | -0.2329 |
| State 19 | 8.6046 | 144.09 | -0.9157 |
| State 20 | 8.6509 | 143.32 | 6.3453 |
Table 1. Descriptions in the CMCDS dataset. This table presents the SMILES structural formula of a compound from the CMCDS dataset and its ECD spectral calculation results, including excitation energy (eV), wavelength (nm), and rotational strength $\left( {{10}^{-{40}}\mathrm{{erg}}\text{ -esu-cm/Gauss })}\right.$ for 20 excited states.
Subsequently,20 discrete Gaussian broadened curves are generated in the ${80} - {450}\mathrm{\;{nm}}$ wavelength range, followed by pointwise integration and summation:
$$ {EC}{D}_{c}\left( \lambda \right) = \mathop{\sum }\limits_{{i = 1}}^{{20}}{G}_{c, i}\left( \lambda \right) \tag{3} $$where ${EC}{D}_{c}\left( \lambda \right)$ is the final ECD signal for conformation $c$ at wavelength $\lambda$ , obtained by summing the contributions of the lowest 20 excited states at each sampled wavelength point.
As shown in Fig. 2, the transition associated with each excited state was broadened using a Gaussian function to generate individual peaks. The complete ECD spectrum was then obtained by summing all broadened peaks.
Due to limited high-performance computing resources, this study adopted a rigid-conformation approximation strategy. Specifically, the default initial molecular conformations generated from SMILES-to-MOL conversion were directly utilized without systematic conformational searches, and their ECD spectra were computed accordingly. From an initial set of 11,095 calculation tasks, 10,887 ECD spectra that satisfied the established quality criteria were selected. Structures with unconverged geometry optimizations or unsuccessful excited-state calculations were excluded from the final dataset. Since the ECD spectra of mirror-image enantiomers are symmetric about the x-axis (wavelength axis), the enantiomeric spectra of 10,887 molecules were generated by sign inversion of their original spectra. This process yielded a comprehensive dataset containing ECD spectra of 21774 molecules in total.
Data Records
All data files associated with the creation of the CMCDS dataset have been publicly archived on Figshare ${}^{20}$ . This repository includes SMILES molecular descriptors, MOL-format files containing initial molecular structures, Gaussian input files for geometry optimizations, Gaussian output files resulting from these structural optimizations, Gaussian input files for ECD calculations, and corresponding Gaussian output files from ECD spectral simulations. Collectively, these resources provide a transparent, reproducible basis for computational studies involving conformational analyses, geometry optimization, and predictions of chiroptical properties.
As shown in Table 1, the CMCDS dataset compiles excitation energies and rotatory strengths extracted from Gaussian output files of ECD calculations, and generates continuous theoretical ECD spectra via Gaussian broadening. The dataset encompasses data for 10,887 chiral molecules, including molecular identifiers, SMILES representations, excitation energies, and rotatory strengths for each electronic transition in all conformations, along with the corresponding computed ECD spectral plots.
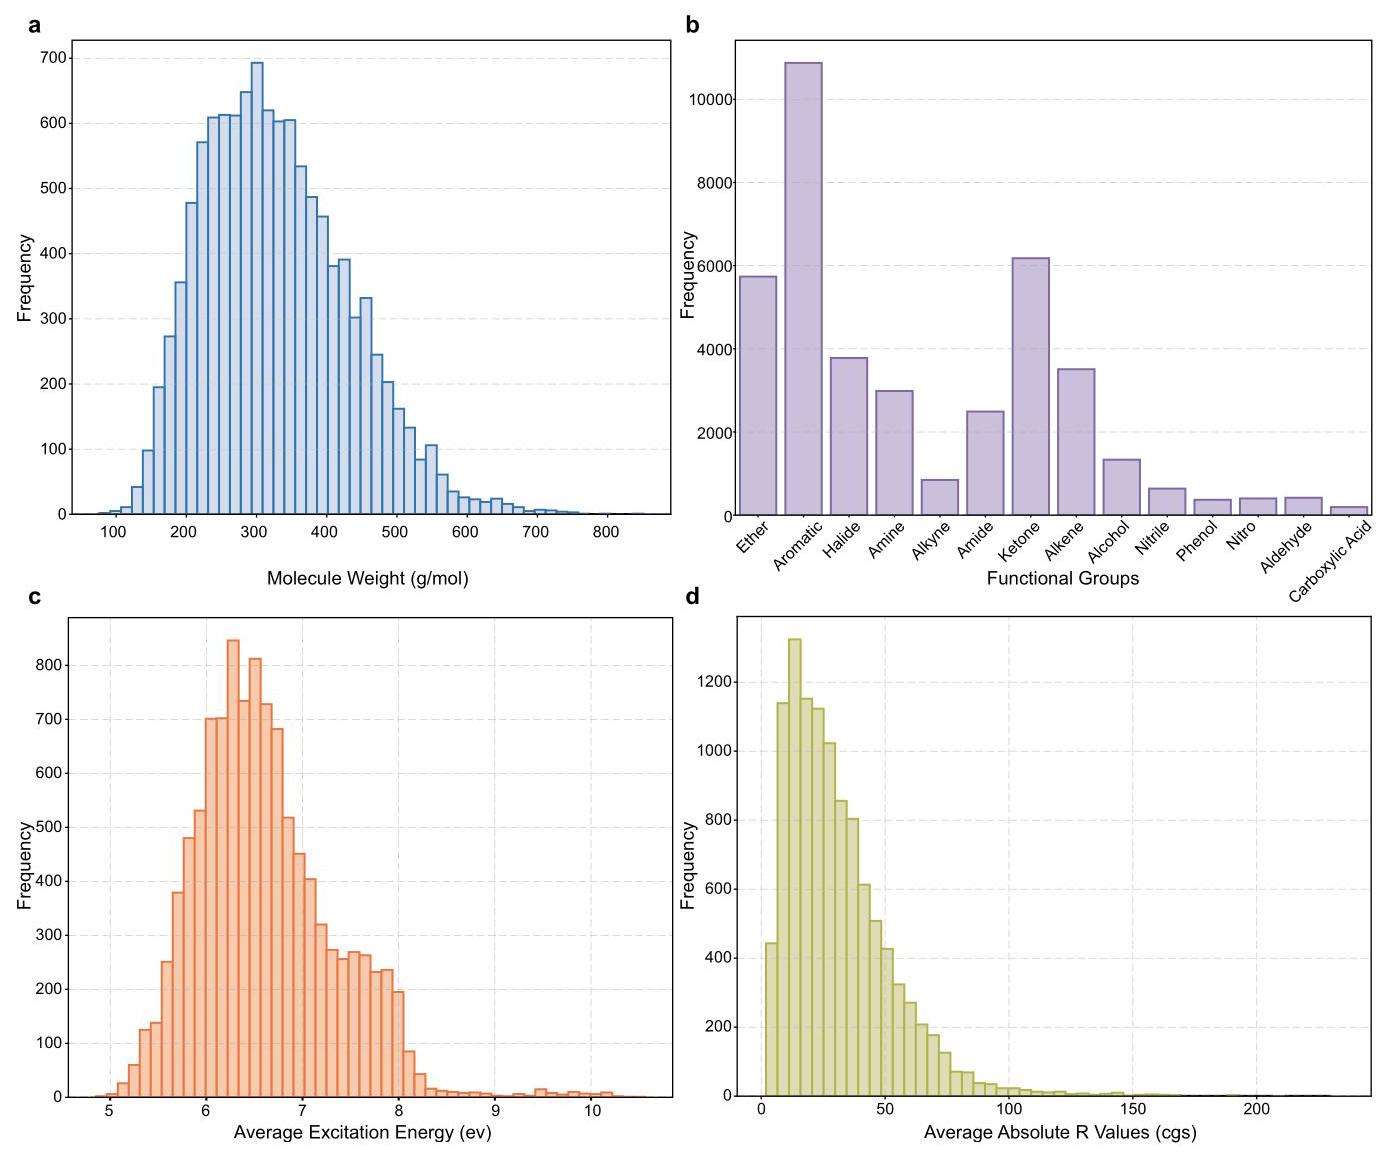
Fig. 3 Data statistics and analysis. (a) Molecular weight distribution statistical histogram. (b) Functional group statistical bar chart. (c) Average excited state energy distribution statistical histogram. (d) Average absolute rotational strength distribution statistical histogram.
To enhance clarity in the workflow of deriving averaged ECD spectra from chiral molecular SMILES, we have also provided a code repository. This repository demonstrates the end-to-end pipeline: starting from simplified molecular input structures (SMILES), generating three-dimensional molecular geometries, conducting DFT calculations to obtain key chiroptical parameters, and finally generating ECD spectra via Gaussian broadening functions. This workflow is designed to facilitate rapid application of the CMCDS dataset in analogous deep learning tasks, ensuring reproducibility and scalability in computational chiroptical studies.
Technical Validation
Data distribution. The CMCDS dataset exhibits well-defined distributions across molecular weight, functional groups, excitation energies, and chiroptical properties. As shown in Fig. 3, the CMCDS dataset analysis reveals that 68.2% of compounds fall within the molecular weight range of 200-400 g/mol, with merely 0.2% surpassing 800 g/mol. Statistical analysis of functional groups revealed that aromatic rings are present in 99% of the molecular structures, with ketone and ester groups accounting for 56.7% and 52.7%, respectively, whereas carboxylic acids constitute a mere 1.8%. In terms of electronic excitation properties, statistical evaluation of the average excitation energies based on the 20 lowest excited states indicates that 56.4% of the molecules have excitation energies clustered within the range of ${6.0} - {7.0}\mathrm{{eV}}$ (corresponding to a wavelength range of ${177} - {207}\mathrm{\;{nm}}$ ). Furthermore, analysis of calculated parameters concerning chirality demonstrates that 86.4% of the molecules display a mean absolute rotatory strength $\langle \left| R\right| \rangle$ below 50 cgs units ( $1\mathrm{{cgs}} = {10}^{-{40}}$ erg-esu-cm/Gauss), a parameter that effectively quantifies the chiral response strength (i.e., molecular chiroptical activity).
Construction of ECD Spectrum Prediction Model. Our group has constructed the ECDFormer model (based on the QFormer architecture) using the CMCDS dataset, achieving efficient generation of theoretical ECD spectra for chiral molecules through an innovative spectral properties decoupling strategy (joint peak attribute learning-prediction framework) ${}^{23}$ . The workflow involves: 1) embedding atomic topology, bond angles, and chiral descriptors of molecules into a geometric-enhanced graph neural network (Geo-GNN) to generate spatial-aware molecular representations; 2) extracting key peak attribute features (number, wavelength, Cotton effect symbol) via the QFormer encoder through a parallel prediction module; 3) synthesizing complete theoretical ECD spectra based on the predicted parameters. This deep learning model demonstrates precise and efficient ECD spectra prediction on the CMCDS dataset, providing robust support for chiral spectroscopy research while advancing machine-learning applications in chiral-related fields.
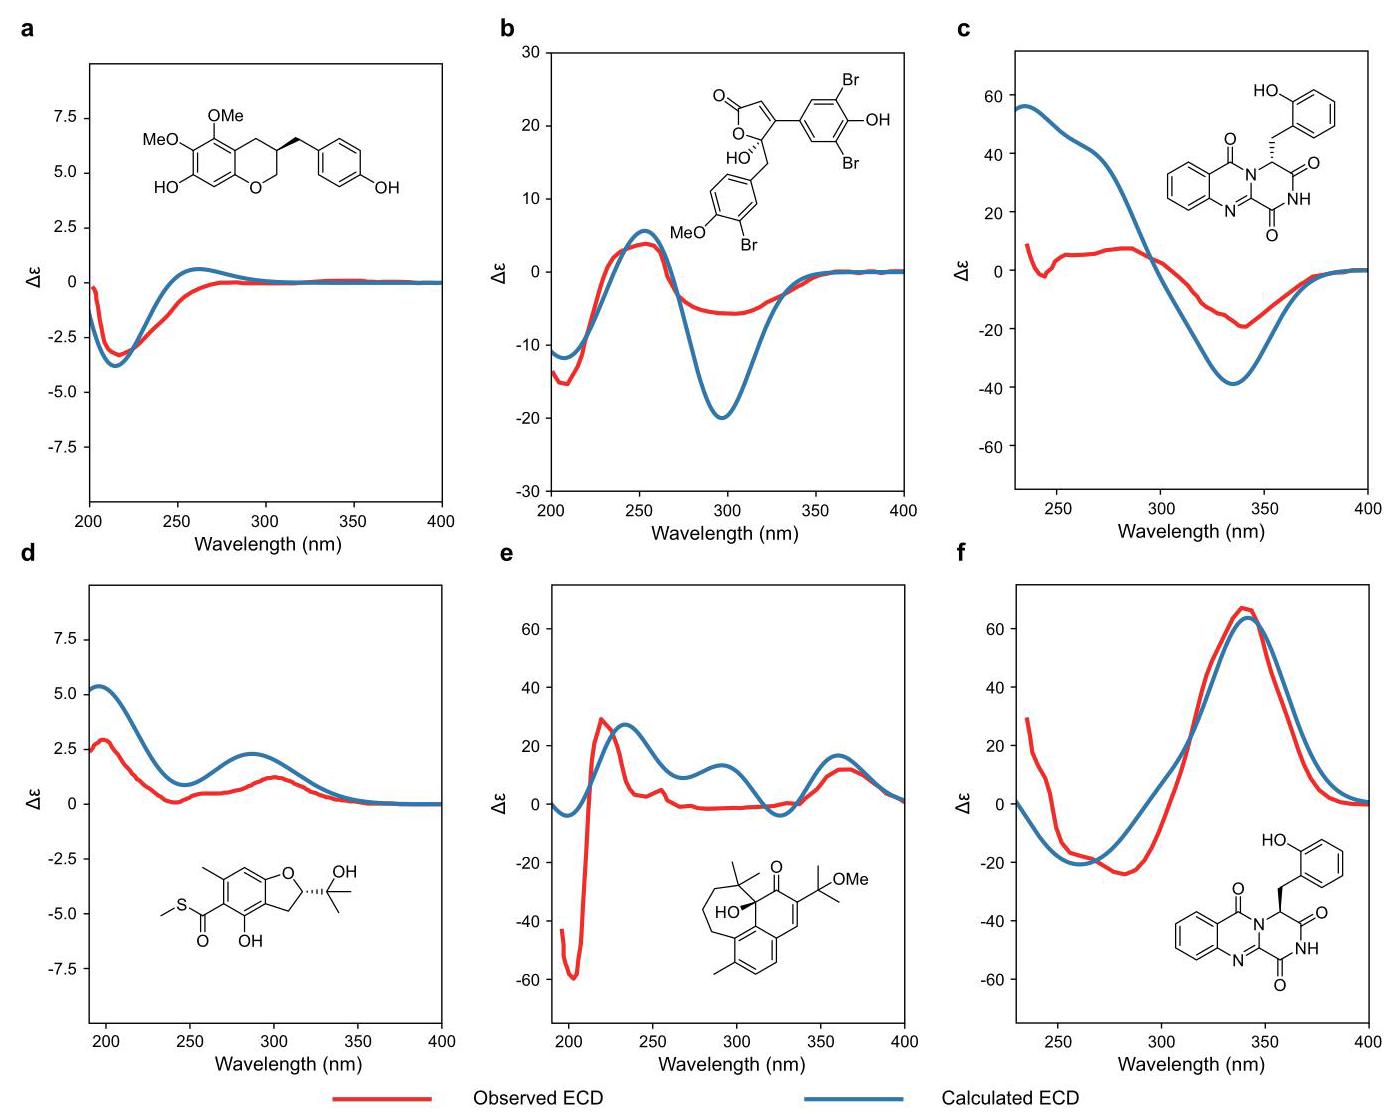
Fig. 4 ECD spectra of natural products were computed using the CMCDS dataset construction method. (a) Red line: Experimental ECD spectrum for (R)-dracaeconolide B, blue line: Calculated ECD spectrum for (R)- dracaeconolide B ${}^{24}$ . (b) Red line: Experimental ECD spectrum for procerolide E, blue line: Calculated ECD spectrum for procerolide ${\mathrm{E}}^{25}$ . (c) Red line: Experimental ECD spectrum for (-)-17-hydroxybrevianamide N, blue line: Calculated ECD spectrum for (-)-17-hydroxybrevianamide ${\mathrm{N}}^{26}$ . (d) Red line: Experimental ECD spectrum for (+)-eurothiocin A, blue line: Calculated ECD spectrum for (+)-eurothiocin A ${}^{27}$ . (e) Red line: Experimental ECD spectrum for wulfenioidin H, blue line: Calculated ECD spectrum for wulfenioidin ${\mathrm{H}}^{28}$ . (f) Red line: Experimental ECD spectrum for (+)-17-hydroxybrevianamide N, blue line: Calculated ECD spectrum for (+)-17-hydroxybrevianamide ${\mathrm{N}}^{26}$ .
Calculation of ECD Spectra of Natural Products Using Quantum Chemical Methods. As shown in Fig. 4, six representative molecular systems with experimental ECD spectra available from previous literature were selected, and their theoretical ECD spectra were computed using the CMCDS dataset construction work-flow based on DFT method. Comparative analysis revealed strong agreement between theoretical and experimental spectra across all tested molecules, with high consistency in peak positions and matching cotton effect signs. These results demonstrated that the CMCDS protocol exhibits excellent applicability and reliability in ECD spectrum prediction for complex molecular systems.
Code availability
All source code developed for this study can be accessed via the GitHub repository CMCDS dataset.
Received: 21 April 2025; Accepted: 2 September 2025;
Published online: 14 October 2025
References
Rau, L. H. Direct asymmetric photochemistry with circularly polarized light. In Chiral photochemistry, 13-56 (CRC Press, 2004).
Wang, X. et al. Assembled molecular face-rotating polyhedra to transfer chirality from two to three dimensions. Nature Communications 7, 12469 (2016).
Qu, H. et al. Truncated face-rotating polyhedra constructed from pentagonal pentaphenylpyrrole through graph theory. Journal of the American Chemical Society 142, 16223-16228 (2020).
Yang, L., Dong, Y., Hu, X. & Liu, A. Dendronized carbohydrates-liquid crystallinity study. Acta Chimica Sinica 70, 27 (2012).
Liu, X., Guo, Q. & Qiu, J. Emerging low-dimensional materials for nonlinear optics and ultrafast photonics. Advanced Materials 29, 1605886 (2017).
List, B., Lerner, R. A. & Barbas, C. F. Proline-catalyzed direct asymmetric aldol reactions. Journal of the American Chemical Society 122, 2395-2396 (2000).
Ahrendt, K. A., Borths, C. J. & MacMillan, D. W. New strategies for organic catalysis: the first highly enantioselective organocatalytic diels- alder reaction. Journal of the American Chemical Society 122, 4243-4244 (2000).
Bloom, B. P., Paltiel, Y., Naaman, R. & Waldeck, D. H. Chiral induced spin selectivity. Chemical Reviews 124, 1950-1991 (2024).
Niu, X. et al. Mechanisms for translating chiral enantiomers separation research into macroscopic visualization. Advances in Collioid and Interface Science 335, 103342 (2025).
Superchi, S., Scafato, P., Gorecki, M. & Pescitelli, G. Absolute configuration determination by quantum mechanical calculation of chiroptical spectra: Basics and applications to fungal metabolites. Current medicinal chemistry 25, 287-320 (2018).
Pescitelli, G. & Bruhn, T. Good computational practice in the assignment of absolute configurations by tddft calculations of ecd spectra. Chirality 28, 466-474 (2016).
Wang, Z., Lv, Z., Li, S. & Li, W. Electronic circular dichroism spectra calculation based on generalized energy-based fragmentation approach. Chinese Journal of Chemical Physics 38, 102-112 (2025).
Jumper, J. et al. Highly accurate protein structure prediction with alphafold. nature 596, 583-589 (2021).
Han, R., Yoon, H., Kim, G., Lee, H. & Lee, Y. Revolutionizing medicinal chemistry: the application of artificial intelligence (ai) in early drug discovery. Pharmaceuticals 16, 1259 (2023).
Coley, C. W. et al. A robotic platform for flow synthesis of organic compounds informed by ai planning. Science 365, eaax1566 (2019).
Zou, Z. et al. A deep learning model for predicting selected organic molecular spectra. Nature Computational Science 3, 957-964 (2023).
Xu, H., Lin, J., Zhang, D. & Mo, F. Retention time prediction for chromatographic enantioseparation by quantile geometry-enhanced graph neural network. Nature Communications 14, 3095 (2023).
Stephens, P. J., Devlin, F. J., Chabalowski, C. F. & Frisch, M. J. Ab initio calculation of vibrational absorption and circular dichroism spectra using density functional force fields. The Journal of physical chemistry 98, 11623-11627 (1994).
Yanai, T., Tew, D. P. & Handy, N. C. A new hybrid exchange-correlation functional using the coulomb-attenuating method (cam-b3lyp). Chemical physics letters 393, 51-57 (2004).
Long, D. et al. Computed ecd spectral data for over 10,000 chiral organic small molecules. figshare https://doi.org/10.6084/ m9.figshare.28805909 (2025).
Landrum, G. Rdkit: open-source cheminformatics. release 2014.03. 1. Zenodo (2014).
Frisch, M. J. et al. Gaussian ~ Revision A.03 (2016). Gaussian Inc. Wallingford CT.
Li, H. et al. Decoupled peak property learning for efficient and interpretable electronic circular dichroism spectrum prediction. Nature Computational Science 1-11 (2025).
Kwon, S. et al. Synthesis and structure revision of naturally occurring homoisoflavane (+)-dracaeconolide b. Journal of Natural Products 86, 149-156 (2022).
Prebble, D. W. et al. $\alpha$ -synuclein aggregation inhibitory procerolides and diphenylalkanes from the ascidian polycarpa procera. Journal of Natural Products 86, 533-540 (2023).
Xu, W.-F. et al. 17-hydroxybrevianamide n and its n1-methyl derivative, quinazolinones from a soft-coral-derived aspergillus sp. fungus: 13 senantiomers as the true natural products. Journal of Natural Products 84, 1353-1358 (2021).
Zhang, G., Pan, X., Yang, B., Li, L. & Liu, Z. The asymmetric total synthesis of (-)-eurothiocin a and its enantiomer. Journal of Natural Products 85, 997-1005 (2022).
Tu, W.-C. et al. Wulfenioidins d-n, structurally diverse diterpenoids with anti-zika virus activity isolated from orthosiphon wulfenioides. Journal of Natural Products 86, 2348-2359 (2023).
Acknowledgements
We acknowledge the financial support from the Natural Science Foundation of China (No. 22071004, 21933001, 22150013, 22272133, 21971217, 22372139 and 22250004), and the Fundamental Research Funds for the Central Universities (No. 20720240053 and 20720240070). We thank the High-Performance Computing Platforms of Peking University and Xiamen University for computational support in constructing the CMCDS dataset. We also extend our gratitude to all the reviewers for their insightful and constructive feedback, which has greatly contributed to the enhancement of our work.
Author contributions
D.L., X.W., and F.M. conceived the basic idea and designed the research study. D.L. and F.M. generated the ECD spectra dataset using DFT calculation. D.L., Z.L. developed the method. X.W., and F.M. further modified the method. D.L. and Z.L. wrote the manuscript. X.C., L.Y., X.W., and F.M. revised the manuscript. D.L. and H.Z. performed the CD calculations for the natural products. X.X. and C.L. revised the figures of the manuscript. X.C., L.Y., X.W., and F.M. provided the computing platform.
Competing interests
The authors declare no competing interests.
Additional information
Supplementary information The online version contains supplementary material available at https://doi.org/10.1038/s41597-025-05929-2.
Correspondence and requests for materials should be addressed to X.C., L.Y., X.W. or F.M.
Reprints and permissions information is available at www.nature.com/reprints.
Publisher’s note Springer Nature remains neutral with regard to jurisdictional claims in published maps and institutional affiliations.
Open Access This article is licensed under a Creative Commons Attribution-NonCommercial-NoDerivatives 4.0 International License, which permits any non-commercial use, sharing, distribution and reproduction in any medium or format, as long as you give appropriate credit to the original author(s) and the source, provide a link to the Creative Commons licence, and indicate if you modified the licensed material. You do not have permission under this licence to share adapted material derived from this article or parts of it. The images or other third party material in this article are included in the article’s Creative Commons licence, unless indicated otherwise in a credit line to the material. If material is not included in the article’s Creative Commons licence and your intended use is not permitted by statutory regulation or exceeds the permitted use, you will need to obtain permission directly from the copyright holder. To view a copy of this licence, visit
© The Author(s) 2025