Decoupled peak property learning for efficient and interpretable ECD spectra prediction
中文 / Bilingual · English version
Hao Li (r) ${}^{1,2,3,9}$ , Da Long ${}^{4,9}$ , Li Yuan ${}^{1,2,3}$ , Yu Wang ${}^{5}$ , Yonghong Tian (r) ${}^{1,2,3}$ , Xinchang Wang to ${}^{4}$ & Fanyang Mo D ${}^{3,6,7,8}$
Electronic circular dichroism (ECD) spectra contain key information about molecular chirality by discriminating the absolute configurations of chiral molecules, which is crucial in asymmetric organic synthesis and the drug industry. However, existing predictive approaches lack the consideration of ECD spectra owing to the data scarcity and the limited interpretability to achieve trustworthy prediction. Here we establish a large-scale dataset for chiral molecular ECD spectra and propose ECDFormer for accurate and interpretable ECD spectrum prediction. ECDFormer decomposes ECD spectra into peak entities, uses the QFormer architecture to learn peak properties and renders peaks into spectra. Compared with spectrum sequence prediction methods, our decoupled peak prediction approach substantially enhances both accuracy and efficiency, improving the peak symbol accuracy from 37.3% to 72.7% and decreasing the time cost from an average of 4.6 central processing unit hours to 1.5 s. Moreover, ECDFormer demonstrated its ability to capture molecular orbital information directly from spectral data using the explainable peak-decoupling approach. Furthermore, ECDFormer proved to be equally proficient at predicting various types of spectrum, including infrared and mass spectroscopies, highlighting its substantial generalization capabilities.
Received: 24 May 2024
Accepted: 4 December 2024
Published online: 3 January 2025
B. Check for updates
The electronic circular dichroism (ECD) spectrum is a crucial molecular feature owing to its ability to discern the chiral configuration of a molecule, which plays an important role in various fields, including asymmetric catalysis ${}^{1,2}$ , functional materials ${}^{3,4}$ , drug discovery ${}^{5}$ and other related areas ${}^{6,7}$ . For experimental chemists, the theoretical calculation of ECD spectra stands out as the most time-consuming and technically demanding task. As shown in Fig. 1a, the computation of ECD spectra for a chiral molecule entails multiple stages, including molecular structural extraction, conformational search, structural optimization, time-dependent density functional theory (DFT) calculation and Boltzmann weighting. This requires experimental chemists to possess a proficient understanding of specialized tools, such as molecular dynamics and DFT calculations. Moreover, the computational demands and time requirements associated with this process are substantial, thereby highlighting its rate-determining step in the assignment of chiral absolute configurations. It raises an open question: Can we speed up the theoretical calculation of ECD spectra?
‘School of Electronic and Computer Engineering, Peking University Shenzhen Graduate School, Shenzhen, China. ${}^{2}$ Peng Cheng Laboratory, Shenzher China. ‘Al for Science (AI4S)-Preferred Program, Peking University Shenzhen Graduate School, Shenzhen, China. 4’State Key Laboratory of Physical Chemistry of Solid Surfaces, School of Electronic Science and Engineering, Innovation Laboratory for Science and Technologies of Energy Materials of Fujian Province and College of Chemistry and Chemical Engineering, Xiamen University, Xiamen, China. ${}^{5}$ School of Computer Science, Peking University, Beijing, China. ${}^{6}$ School of Materials Science and Engineering, Peking University, Beijing, China. ${}^{7}$ School of Advanced Materials, Peking University Shenzhen Graduate School, Shenzhen, China. ${}^{8}$ Guangdong Provincial Key Laboratory of Nano-Micro Materials Research, Peking University Shenzhen Graduate School, Shenzhen, China. ${}^{9}$ These authors contributed equally: Hao Li, Da Long. &; ;
Fig. 1 | Overview of ECDFormer. a, Quantum chemical calculation and the spectrum prediction pipeline of ECDFormer. The quantum chemical calculation for ECD spectra includes three processes: (1) conformational search; (2) molecular structure optimization (OPT) and time-dependent (TD)-DFT calculations; and (3) Boltzmann weighting, costing an average of 4.6 central processing unit hours per spectrum. We propose the large-scale ECD dataset CMCDS and establish the ECDFormer framework with four processes: (1) molecular graph encoding, (2) peak property learning, (3) peak prediction and (4) rendering, costing 1.5 s per spectrum. b, The architecture of the molecular graph encoding. We consider the integration of atom-bond and bond-angle
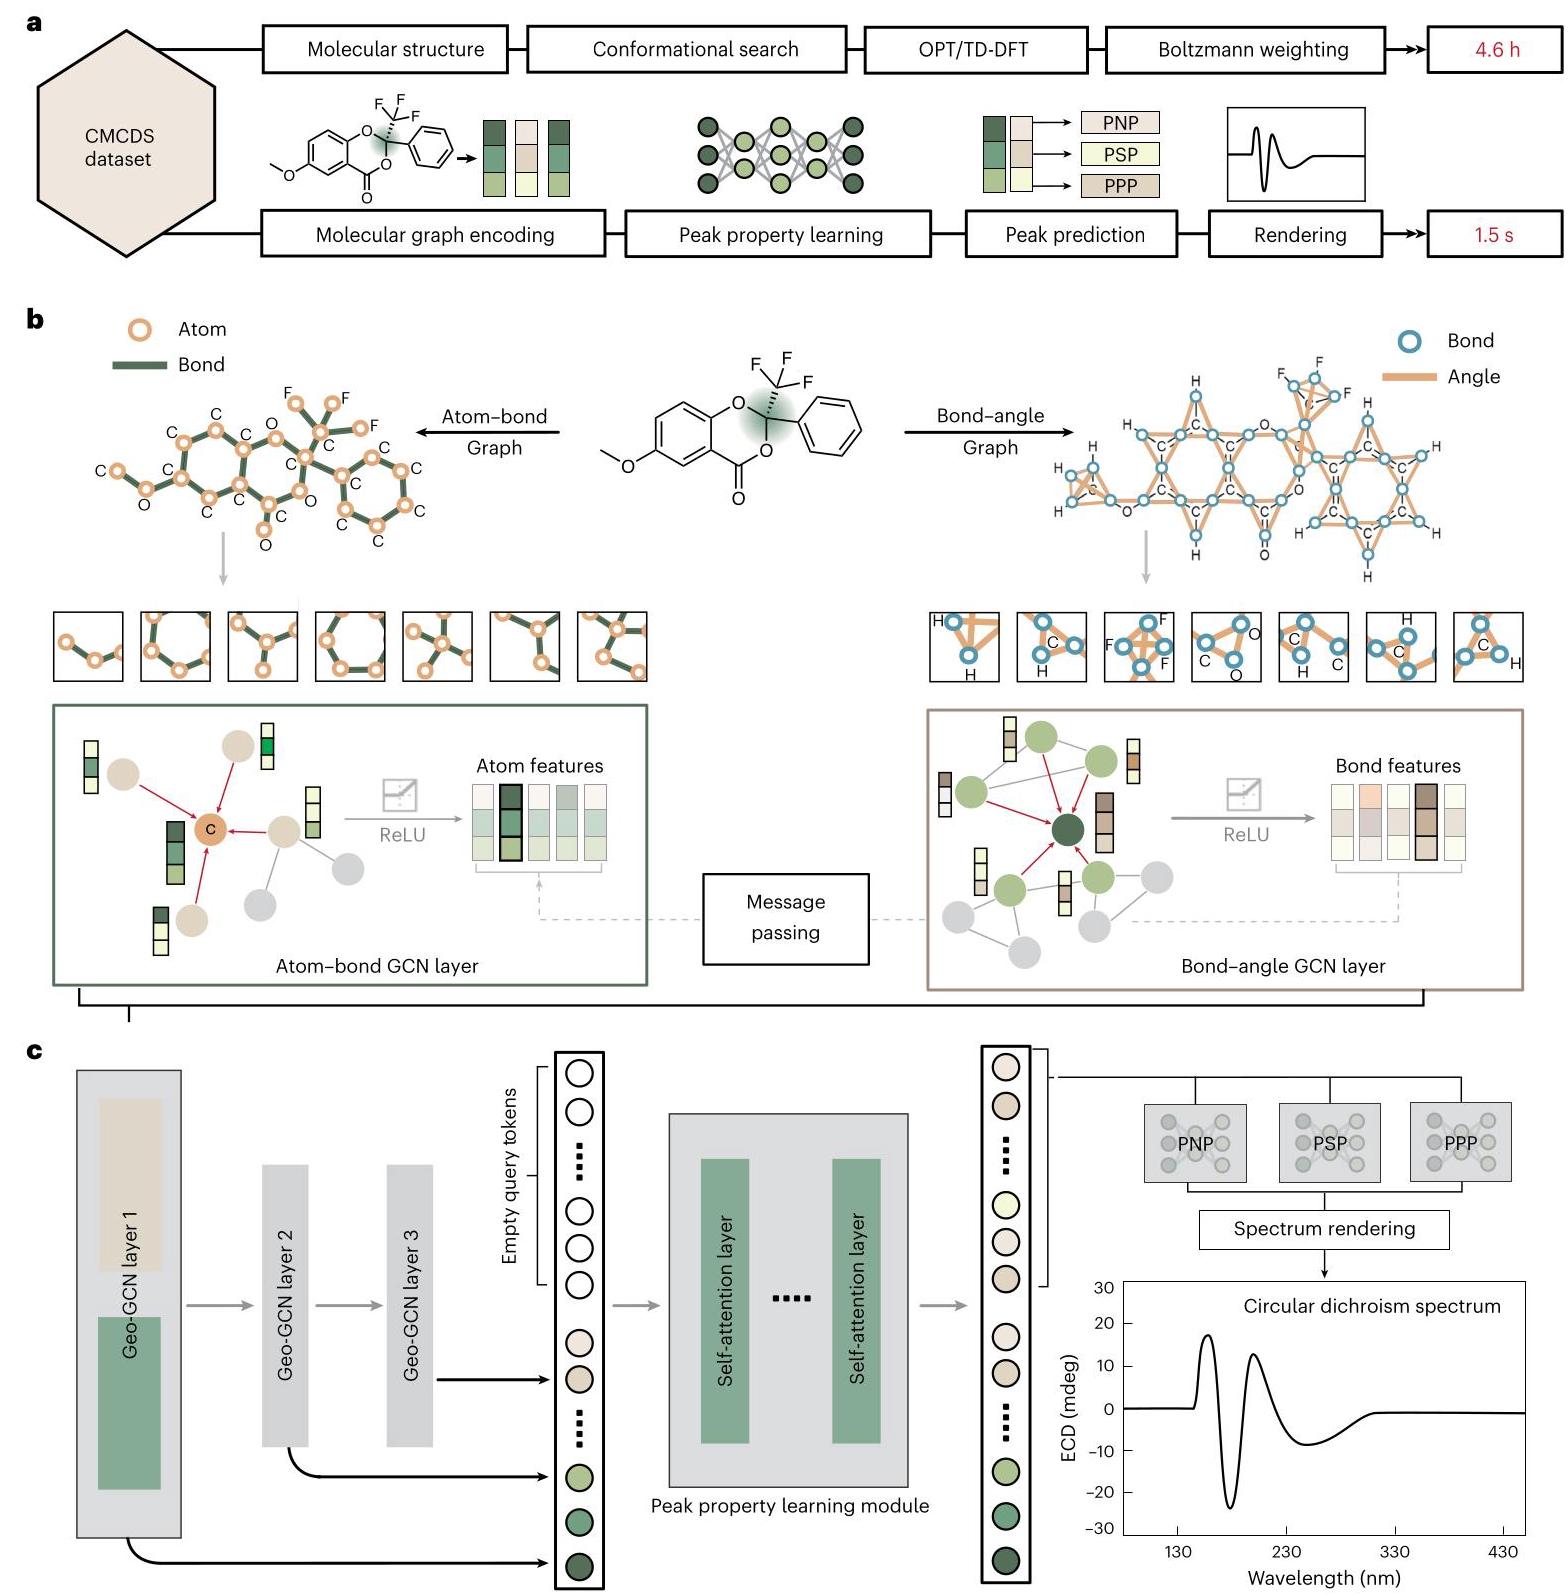
embeddings with various molecular geometrical aspects. c, The architecture of the ECDFormer framework. Inspired by the chemical chiral assignation procedure, we model the peak in the spectrum as the query token in ECDFormer. The peak property learning module fuses the peak query tokens and the molecule feature tokens, while the peak number prediction (PNP), peak symbol prediction (PSP) and peak position prediction (PPP) modules predict the number, symbol and position features for each peak. The spectrum rendering module reconstructs the spectrum shape from peak properties. The green and khakimodules in GeoGCN-Layer1 represent the atom-bond graph convolution network (GCN) layer and the bond-angle GCN layer.
Deep learning is a cost-effective approach for precise spectrum prediction, including the infrared (IR) spectra ${}^{8}$ , ultraviolet-visible ${\text{ spectra }}^{9}$ , electronic-excitation spectra ${}^{10}$ and mass spectra ${}^{{11} - {13}}$ . Specifically, neural network for infrared (NNIR) ${}^{8}$ and deep tensor neural network (DTNN) ${}^{10}$ predict spectra by fusing atomic features and chemical bond properties through dual or triple stream representations. With the evolution of molecular representation learning, MoMS-Net ${}^{11}$ , Massformer ${}^{12}$ and SCARF ${}^{13}$ encode molecules into motif graphs for spectral prediction. However, due to the dataset deficiency for chiral molecular ECD spectra, developing a model capable of rapid and accurate prediction for ECD spectra has been difficult. Moreover, existing spectral prediction models use a holistic sequence prediction approach for spectral reconstruction, neglecting exploration of the association between molecular moieties and spectral structures, thus resulting in a lack of interpretability. Therefore, we aim to establish an efficient and interpretable ECD spectrum prediction framework to fill the void in the automated spectrum prediction community.
First, addressing the dataset deficiency for ECD spectral prediction is imperative because large and high-quality datasets are essential for the effectiveness of machine learning methods. We first need to have a library of chiral molecules. To address this, we have constructed a library of 25,000+ chiral molecules (chiral molecules retention time dataset, CMRT) in our previous work, which introduced a machine learning framework to enhance the efficiency of chromatographic enantioseparation in experimental chemistry ${}^{14}$ . Based on the CMRT dataset, a chiral molecular circular dichroism spectrum dataset (CMCDS) was generated by selecting chiral molecules from CMRT and calculating their ECD spectra.
With the CMCDS dataset, we further construct ECDFormer, a QFormer-based model to speed up the prediction of the ECD spectra for chiral molecules. Inspired by the chemical assignation scenario that focuses on peak properties in the ECD spectra, our ECDFormer creatively decouples the peaks from the spectra and establishes a peak property learning and prediction module to render the ECD spectra from peak properties rather than predict the ECD spectra directly. Specifically, for the input molecule, our ECDFormer applies its atom, bond, angle features and chiral molecule descriptors as the description information into the geometry-enhanced graph neural network (GNN) structure to learn the molecular representation. For the peak property learning module, we apply the QFormer encoder ${}^{15}$ to learn the peak property features from molecular representations. Then, we respectively predict the peak number, position (wavelength) and symbol (the sign of the Cotton effect ${}^{16}$ ) from property features and render them into the ECD spectra as the prediction of theoretical ECD spectra.
The quantitative experimental results demonstrate the accuracy and efficiency of our ECDFormer compared with other baselines. ECD-Former substantially enhances the predictive capacity for peak properties and reduces the spectrum prediction time cost from an average of 4.6 central processing unit hours to 1.5 s per molecule. Furthermore, the decoupled peak learning and prediction module ensures the outstanding interpretability of ECDFormer. By highlighting the integrated gradient contributions of different atom groups to the ECD peaks, we observe that the chromophore structures of molecules play a crucial role in peak prediction, which is consistent with the chemical interpretation of ECD spectra. Moreover, our ECDFormer framework presents a strong generalization capability: (1) generalization on natural products (ECDFormer successfully predicts the ECD spectra for natural products with pharmaceutical effects that have currently been found) and (2) generalization on other spectrum forms (ECDFormer is able to accurately predict IR and mass spectra by decoupling and forecasting the peak values in the spectral graphs). Our model not only advances research in chiral chemistry but also has potential applications in asymmetric synthesis and facilitates high-throughput screening of chiral drug molecules in the pharmaceutical development field.
Results
CMCDS, a large ECD spectrum dataset from asymmetric catalysis
The CMCDS dataset is realized mainly by large-scale theoretical calculations, consisting of ECD spectra and simplified molecular input line entry system (SMILES) sequences of 22190 chiral molecules, and the ECD spectral data of all the molecules were calculated by Gaussian16 B. 01 packages ${}^{17}$ . Our chiral molecules were mainly crawled from the literature of asymmetric catalysis, and we transformed the SMILES files of the molecules into MDL molfiles (MOL files) with the help of the RDKit package to obtain the three-dimensional atomic coordinates of the molecules. The above MOL files were converted into Gaussian job files in batches through Python. Then, the molecule structure was optimized at the B3LYP/6-31G level ${}^{18}$ . Furthermore, we conducted the ECD calculation at the CAM-B3LYP/6-31G(d) level ${}^{19}$ , setting the number of states (nstates) to 20. We fixed the half-peak width at 0.3 and applied Gaussian broadening, utilizing the energies and wavelengths derived from these 20 excited states. More details for dataset construction are proposed in Supplementary Section 1.
Construction of the ECDFormer model
Figure 1b shows the computational workflow of our ECDFormer model. The workflow takes the atom-bond-angle features and molecular descriptors as the features of the target molecule. ECDFormer contains four modules for ECD prediction: (1) the molecular feature extraction module to obtain the chiral molecular representation based on a geometric-enhanced graph neural network; (2) the peak property learning module to extract the peak property features from chiral molecular representation using a transformer encoder structure; (3) the peak property prediction module to predict the peak properties, including number, position and symbol, from the learned peak property features; and (4) the ECD rendering module to reconstruct the ECD spectra from predicted peak properties.
Molecular ECD spectra are characterized by the presence of positive and negative peaks as a result of the Cotton effect. Compared with other spectra including molecular IR spectra ${}^{9}$ and protein ECD spectra ${}^{20}$ , molecular ECD spectra reveal substantial morphological variations. This distinct feature makes traditional sequence prediction models (long short-term memory (LSTM) and gated recurrent unit (GRU)) less effective for ECD prediction by directly predicting the whole spectra. Chemists often concentrate on the symbols of peaks (indicating the direction of the Cotton effect) and their positions (related to the wavelengths of the peaks) in ECD spectra for determining chirality in molecules. To streamline the ECD prediction process, we focus on predicting essential ECD information such as the number of peaks, their positions and symbols. Accordingly, the peak-focused loss function to support this approach is ${\mathcal{L}}_{\text{ ecd }} = \alpha {\mathcal{L}}_{\text{ ce }}^{\text{ num }} + \beta {\mathcal{L}}_{\text{ ce }}^{\text{ pos }} + \lambda {\mathcal{L}}_{\text{ ce }}^{\text{ sym }}$ , where ${\mathcal{L}}_{\text{ ce }}$ for peak number, position and symbol is cross-entropy loss ${}^{21} \cdot \alpha ,\beta$ and $\lambda$ represent the loss weight (1.1,2.0 and 1.0, respectively), which are selected from multiple ablation experiments. Due to the emphasis of ECD spectra prediction on the positive and negative peaks, we slightly increased the loss weight for peak symbols to enforce the model prediction. We apply ReLU as our activation function, which is stable and effective under multiple ablations.
Peak-specific evaluation metrics for ECD prediction
The ECD spectra of chemical molecules exhibit two distinct characteristics: (1) a high degree of shape diversity and (2) a strong reliance on peak attributes for chiral molecule identification. These characteristics are substantially different from the ECD spectra of proteins, rendering it inappropriate to adopt the sequence root mean square error (Sequence-RMSE) evaluation metric used in protein ECD spectrum prediction tasks ${}^{{22} - {24}}$ . To better evaluate the quality of the ECD spectrum for the chiral molecular assignation task, we establish three sets of evaluation metrics based on peak attributes of ECD spectra: (1) Number-RMSE (the root mean square error (RMSE) of peak number between ground-truth and prediction ECD spectra); (2) Position-RMSE (the RMSE of each peak’s position between ground-truth and prediction ECD spectra); and (3) Symbol-Acc (the matching accuracy of peaks’ symbols between ground-truth and prediction ECD spectra). These metrics provide a reasonable and comprehensive assessment of ECD spectrum prediction quality from different perspectives.
Table 1 | Performance for ECD prediction task
| # | Method | Initialization | Evaluation metrics | |||
| Rand | Pretrain | Position-RMSE (nm) $\downarrow$ | Number-RMSE ↓ | Symbol-Acc (%) ↑ | ||
| Machine learning methods | ||||||
| 1 | Logistic regressor | ✓ | - | 7.81 | 7.22 | 47.8 |
| 2 | SGD regressor | ✓ | - | 6.44 | 6.36 | 47.1 |
| 3 | Aggressive regressor | ✓ | - | 5.97 | 4.39 | 48.5 |
| Deep learning methods | ||||||
| 4 | MassFormer12 | ✓ | - | 8.62 | 2.87 | 51.9 |
| 5 | GeoGNN+GRU28 | ✓ | - | 6.47 | 1.72 | 39.5 |
| 6 | GeoGNN+LSTM ${}^{27}$ | ✓ | - | 5.91 | 1.76 | 43.7 |
| 7 | GeoGNN+LSTM ${}^{27}$ | - | ✓ | 4.68 | 1.45 | 46.4 |
| 8 | GeoGNN+transformer ${}^{29}$ | ✓ | - | 4.69 | 1.36 | 49.2 |
| 9 | GeoGNN+transformer ${}^{29}$ | - | ✓ | 5.82 | 1.64 | 37.3 |
| 10 | ECDFormer (ours) | ✓ | - | 2.29 | 1.24 | 72.7 |
We propose the experimental results on our ECDFormer framework and the corresponding baselines including machine learning models and deep learning models. Focusing on peak property prediction, our ECDFormer model surpasses baselines under all evaluation metrics. The check marks and en dashes respectively represent that the model belongs or does not belong to the initialization type.
The performance of ECDFomer on peak-specific evaluation metrics
To comprehensively evaluate the performance of our ECDFormer, we implemented two categories of models as our baselines, the machine learning models and deep learning models. Table 1 demonstrates that our model outperforms existing approaches. The specific experimental analysis is provided below.
Comparison with machine learning baselines. Machine learning models are commonly used as analytical tools in the fields of chemistry and materials science ${}^{{25},{26}}$ . We select three common models, including stochastic gradient descent (SGD) regressor, positive aggressive regressor and logistic regressor, as the baselines. Comparing rows 1-3 and row 10 in Table 1, machine learning baselines perform unsatisfactorily, which is attributed mainly to the models’ inability to decouple spectral sequences from complex molecular structural features. This emphasizes the necessity of using deep learning models to tackle the task of predicting ECD spectra for chiral molecules.
Comparison with deep learning baselines. In the context of abundant data, deep learning models have shown excellent performance in complex task settings. With the CMCDS dataset, we implement sequence prediction deep learning models as our baselines, including MassFormer ${}^{12}$ (multilayer perceptron (MLP)-based model), ${\mathrm{{LSTM}}}^{27},{\mathrm{{GRU}}}^{28}$ , and Transformer Decoder ${}^{29}$ . Comparing rows 5-8 with row 10 in Table 1, our ECDFormer, predicting the peak property of ECD spectra, substantially outperforms other baselines. The results demonstrate the effectiveness of our peak property prediction module in ECDFormer. Comparing rows 6 and 8 with rows 7 and 9, the pretrained models have little influence on the ECD prediction task, due to the lack of chiral molecular information during the pretraining stage.
The analysis of peak-specific evaluation metrics
To better analyze the models’ performance, including our ECDFormer and other baselines, under three peak-specific evaluation metrics, we draw the analysis graphs for each evaluation metric in Fig. 2.
Peak number analysis. In Fig. 2a, we analyze ECDFormer’s predictive capability regarding the peak number and demonstrate its excellent performance in predicting peak number for complex spectra (peak number >5) compared with baseline models. The $X$ axis represents the ground-truth values of the peak number, while the $Y$ axis represents the predicted values of the peak number. Therefore, the closer the data points are to the $y = x$ line, the better the predictive performance. The density of the data points is indicated by the size of the red circles, where a larger red circle represents a higher concentration of data points. Figure 2a shows that, in ECDFormer, the largest red circles all appear on the $y = x$ line, even when predicting hard samples (peak number >5). The RMSE of peak number is 1.24, indicating the good performance of peak number prediction for our ECDFormer. We also visualize the molecule cases with different peak numbers, elucidating the relationship between the peak number and spectrum complexity. The receiver operating characteristic (ROC) curve for ECDFormer further demonstrates the good performance on hard samples.
Peak position analysis. In Fig. 2b, we analyze the model’s peak position predictive capability. Specifically, we visualize the violin graphs of the position differences between predicted peaks and ground-truth peaks. To further visualize the performance in easy-to-hard cases, we split the test dataset on the basis of the peak number ${N}_{v}$ of a molecule. Compared with baselines, for all cases from easy to hard, most predictions in ECDFormer have 0 difference with ground truth, demonstrating the effectiveness.
Peak symbol analysis. In Fig. 2c, similar to the peak position analysis, we further analyze the model’s peak symbol predictive capability. we visualize the violin graphs of the symbol differences between predicted peaks and ground-truth peaks. For easy cases $\left( {{N}_{p} = 2}\right)$ , our ECDFormer has similar performance to the transformer and the GRU baseline. For hard cases $\left( {{N}_{p} = 3,4\text{ and 5 }}\right)$ , compared with baselines, most predictions in ECDFormer have the same symbols as ground truth while the baselines exhibit substantial error, demonstrating the effectiveness of our ECDFormer.
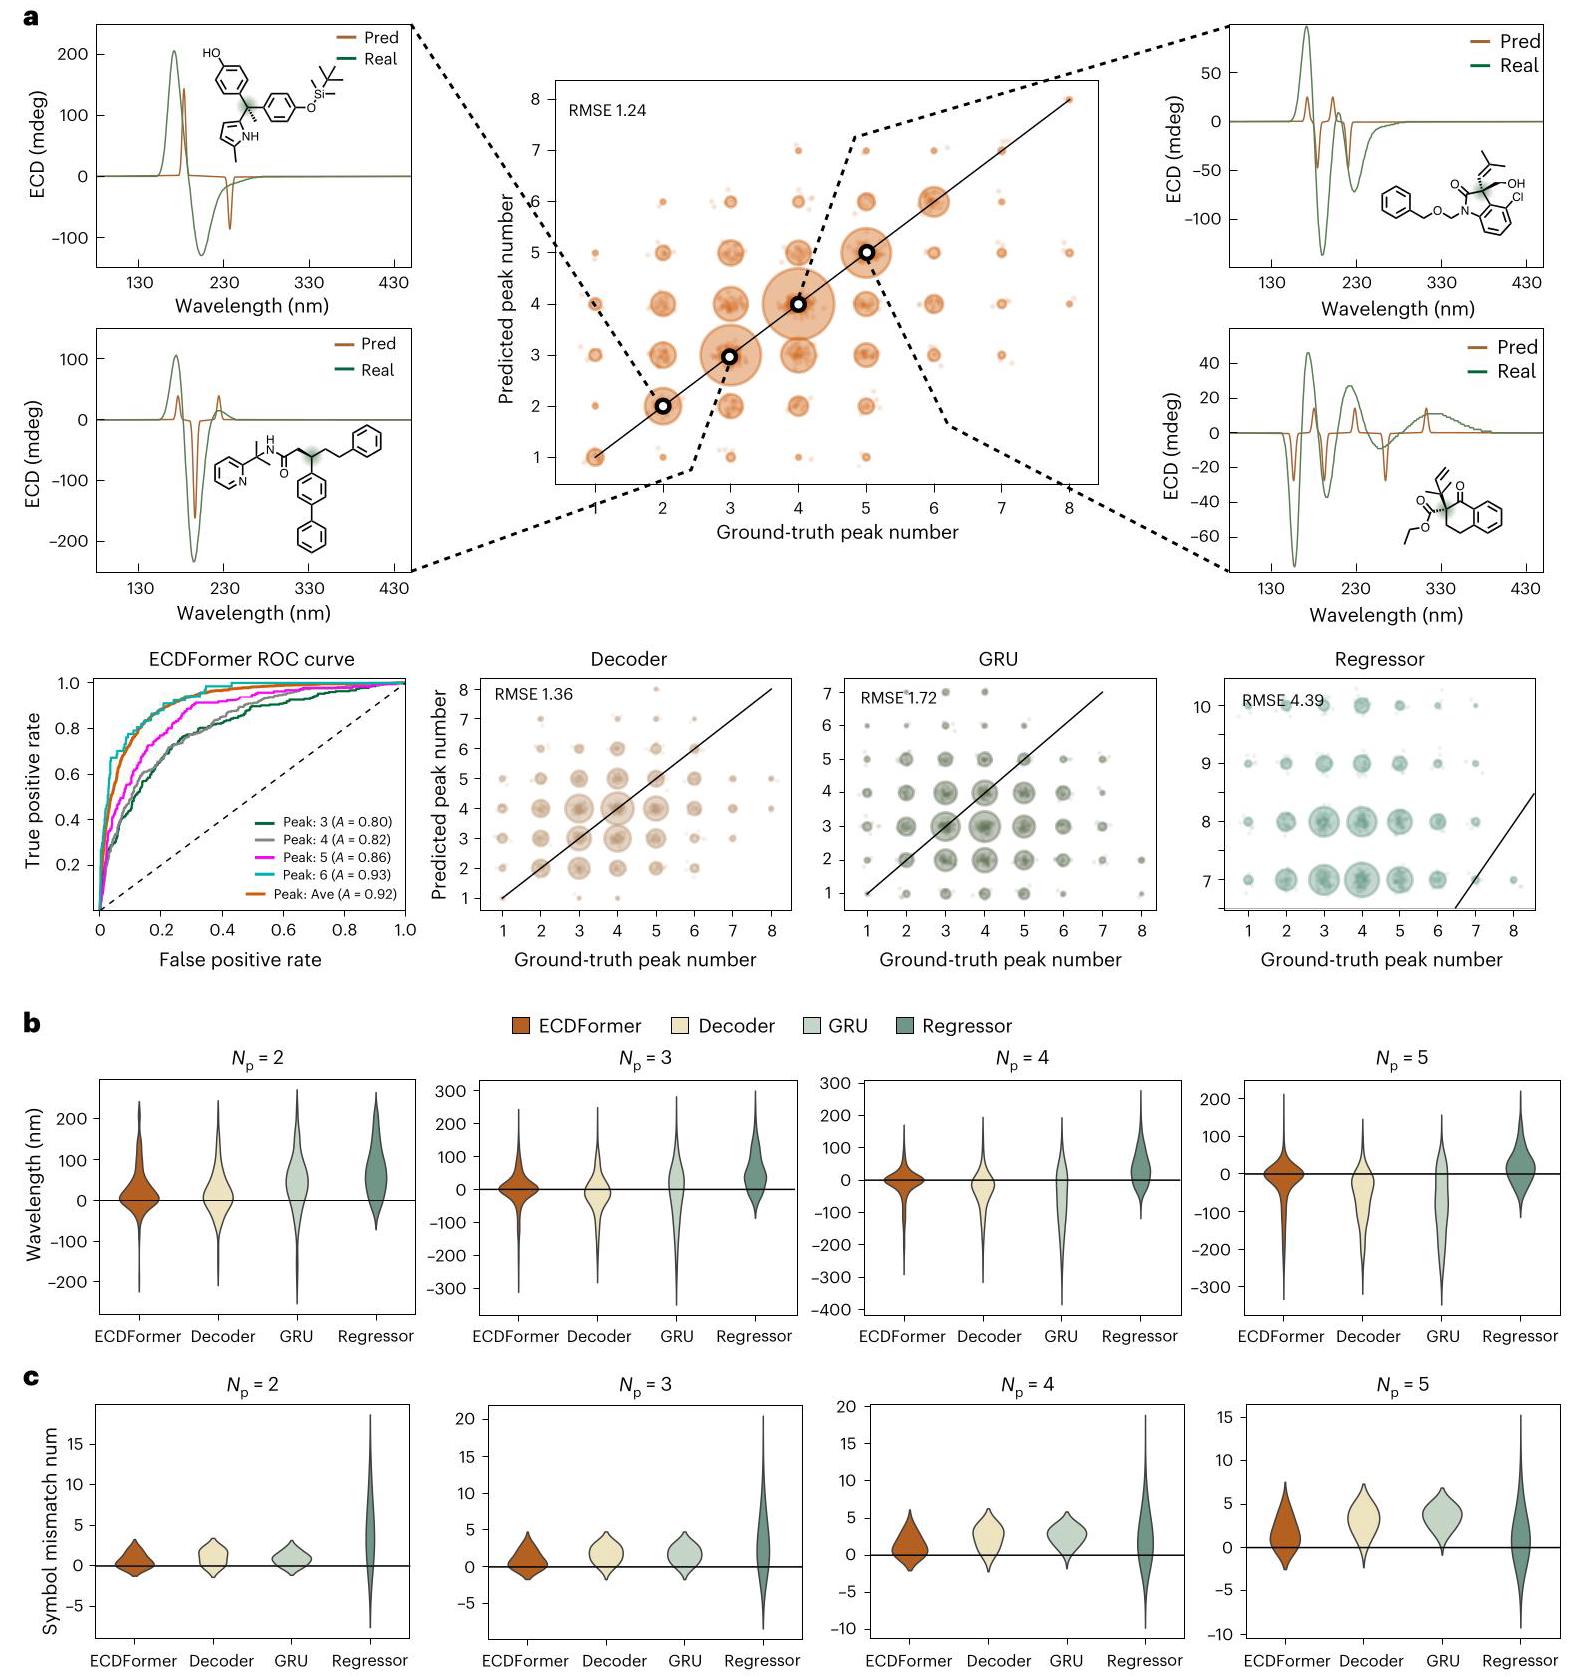
Fig. 2 | Experimental analysis for ECD spectrum prediction. a, The data distribution plot for the peak number of ECD ground-truth spectrum and predicted (Pred) spectrum. Four spectrum cases are proposed for the visualization of the spectrum with different peak numbers. The ROC curve for peak prediction shows the effectiveness of ECDFormer on hard samples (peak 6). Ave, average; A, accuracy. The green shades in the molecules represent the chiral center. b, Violin plots of the discrepancies in peak positions between ground-truth spectrum and predicted spectrum from ECDFormer and baselines. The peak number, ${N}_{\mathrm{p}}$ , indicates the spectral complexity. ECDFormer’s position discrepancy distribution is closer to zero than the baselines. c, Violin plots of the discrepancies in peak symbols between the ground-truth spectrum and the predicted spectrum from ECDFormer and baselines. ECDFormer’s symbolic discrepancy distribution is closer to zero than the baselines. num, number.
The generalization analysis for ECDFormer
The generalization analysis for ECDFormer consists of two parts: (1) the generalization ability for ECD spectrum prediction on existing
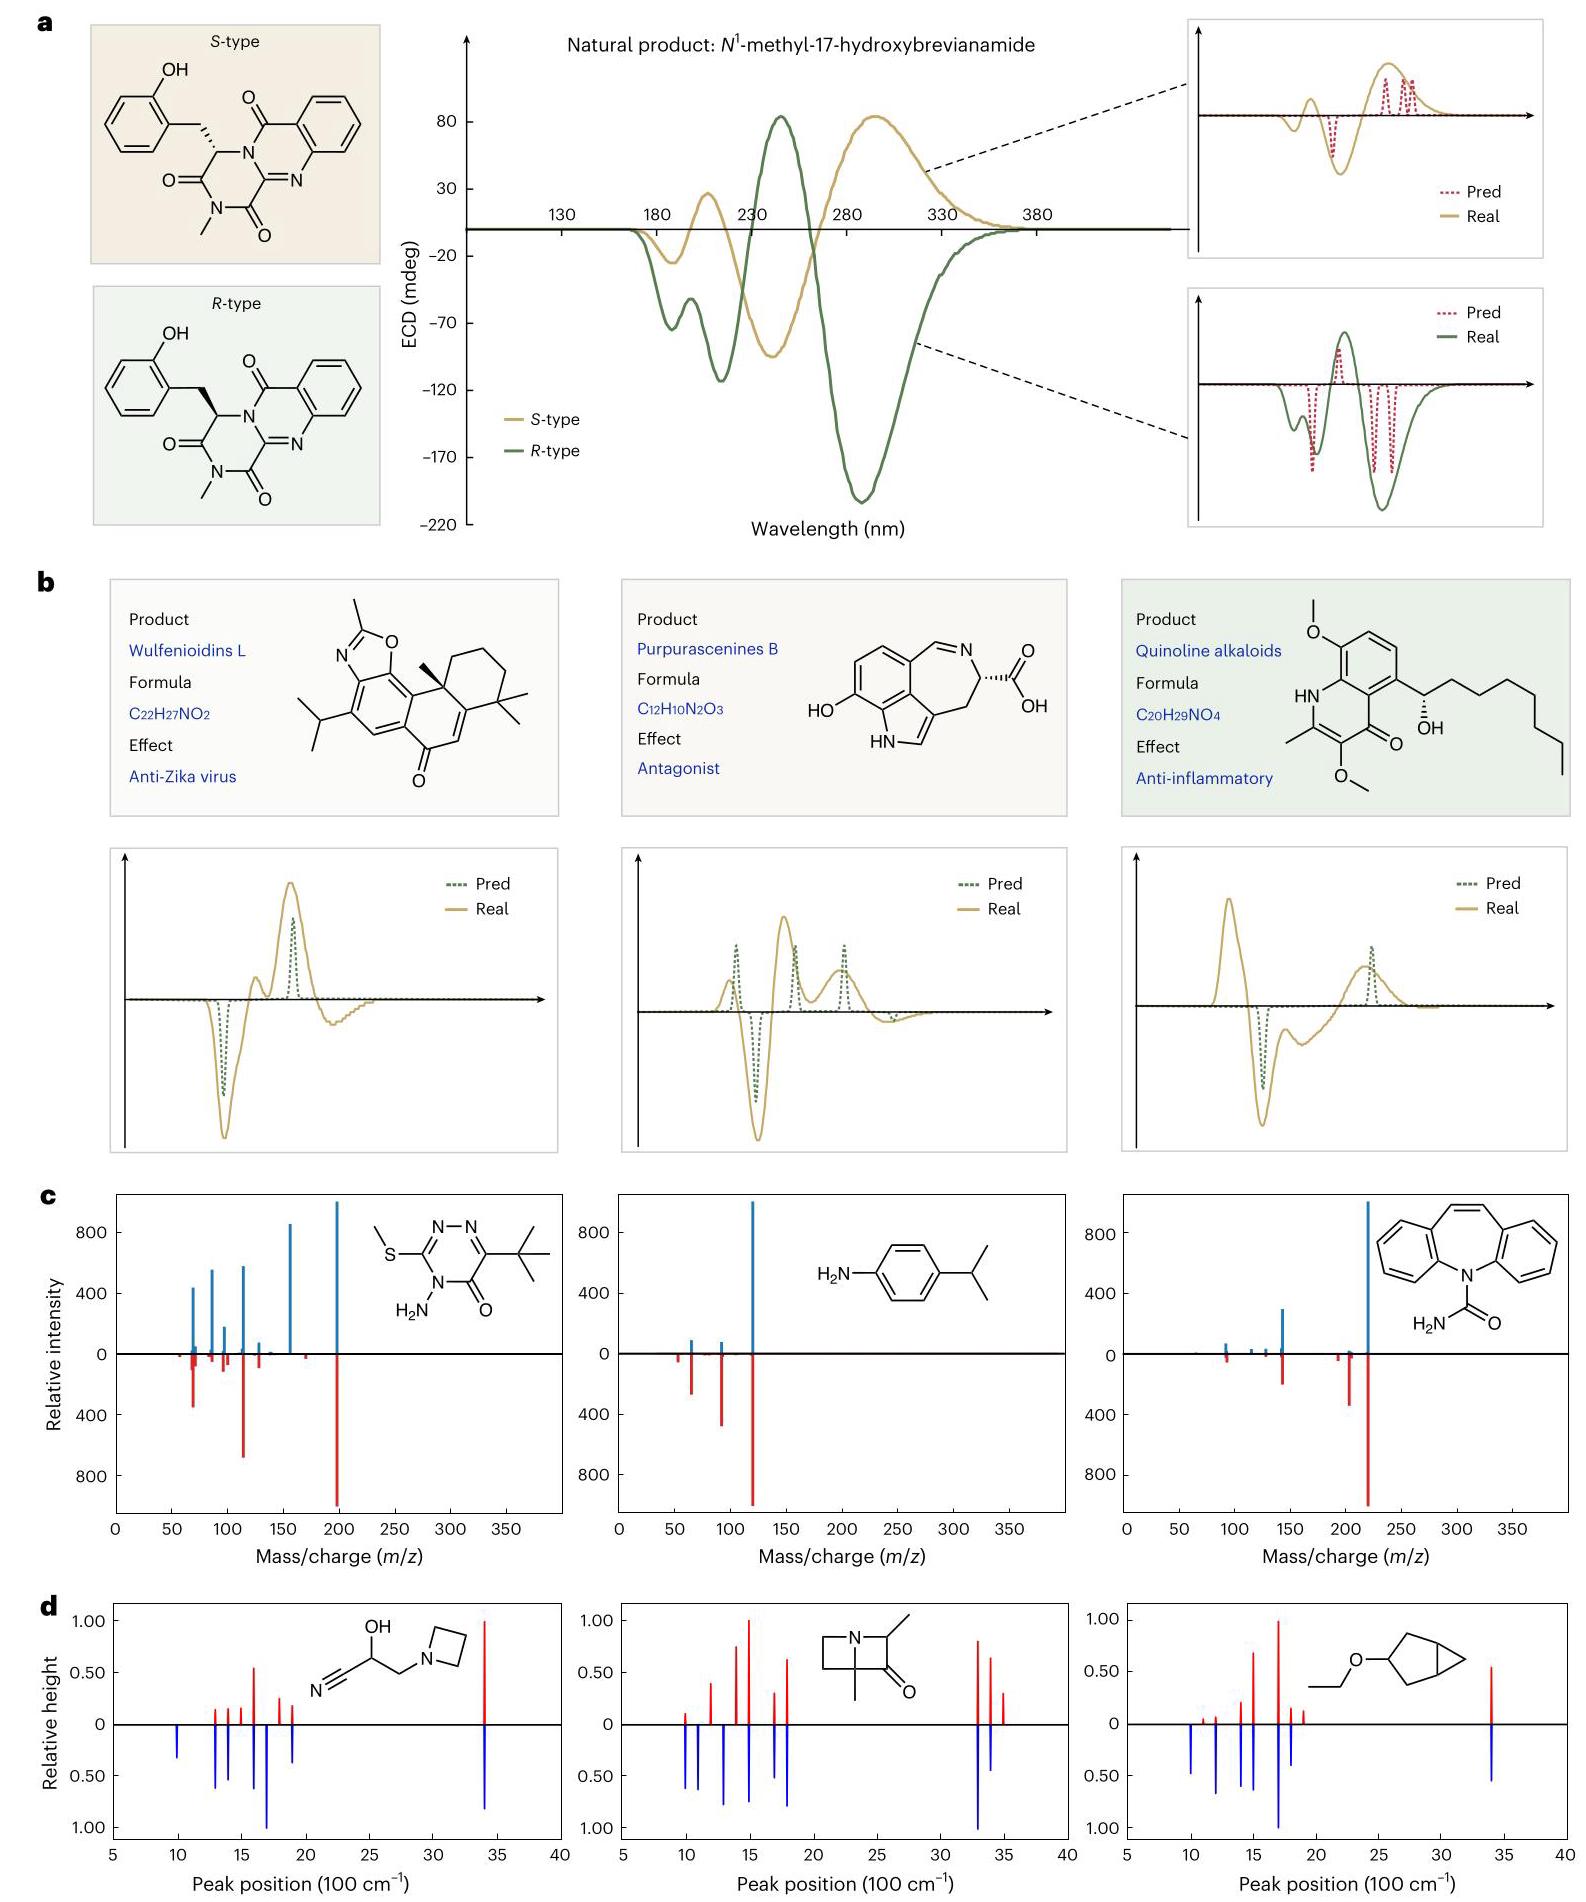
Fig. 3 | Generalization analysis for ECDFormer. a, b, We select natural products with pharmaceutical effects from recent journals ${}^{{30} - {33}}$ . ECDFormer has zero-shot ECD prediction capability for these unseen natural products and their chiral structures, and it performs well even on a pair of enantiomers as depicted in a. c, The ECDFormer framework has excellent generalization ability on the tandem mass spectra prediction task. We present three predicted (red) and real (blue) mass spectra. d, The ECDFormer framework has good generalization ability on the IR spectra prediction task.
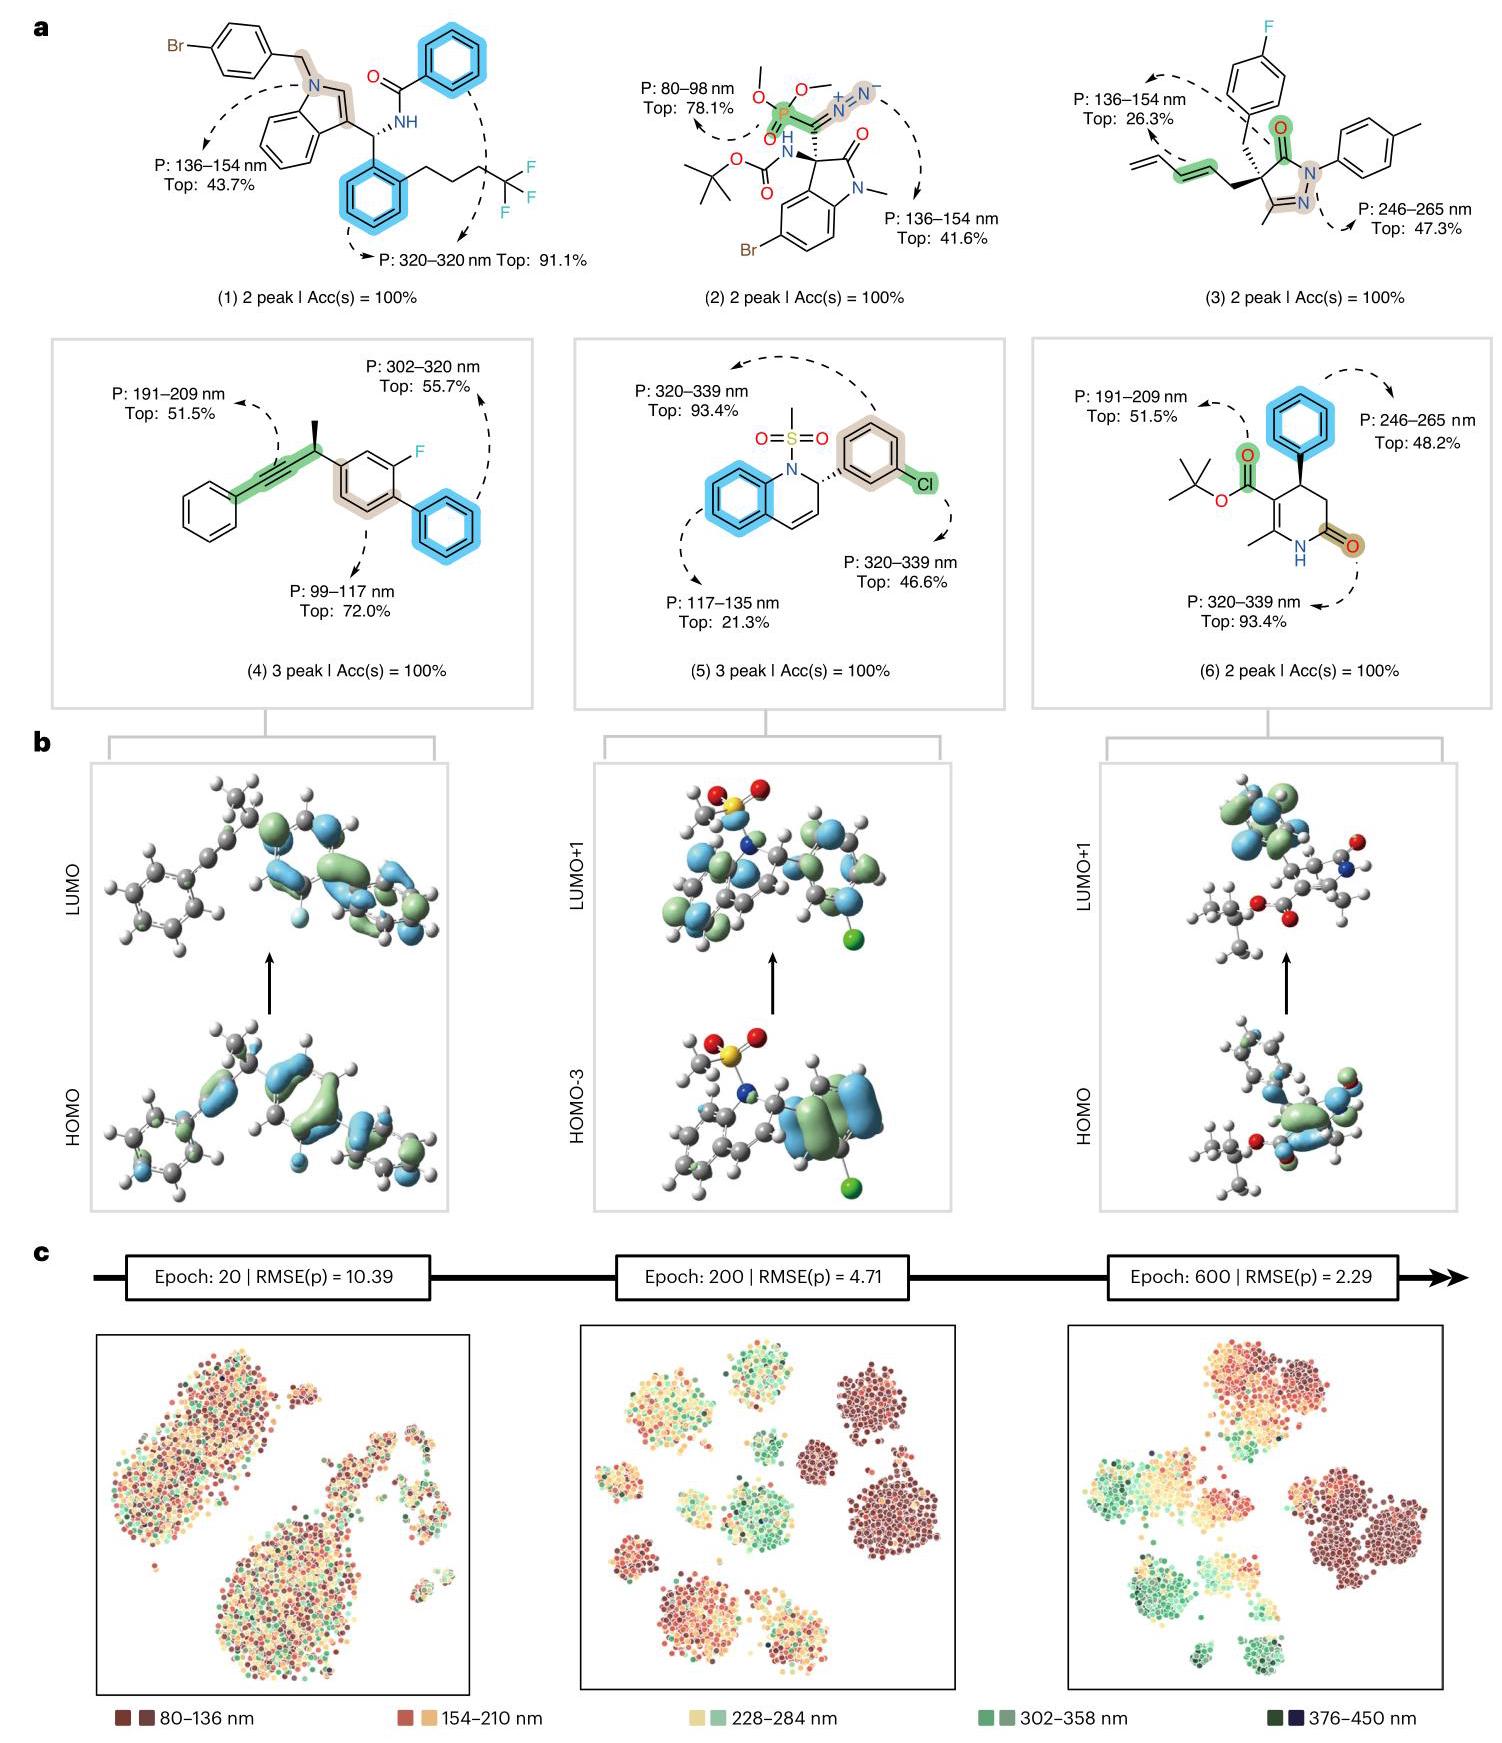
calculations. In the context of molecular orbitals, the two distinct colors associated with the highest occupied molecular orbital (HOMO) and the lowest unoccupied molecular orbital (LUMO) correspond to different phases of the wavefunction. Specifically, green denotes a positive phase of the wavefunction, whereas blue signifies a negative phase. HOMO-3 refers to the molecular orbital that is three energy levels below the HOMO, while LUMO+1 denotes the molecular orbital that is one energy level above the LUMO. c, As the number of iterations increases, the RMSE error for the prediction of peak number gradually decreases, while the clustering of peaks in spatially proximate positions becomes increasingly evident.
Fig. 4 | Interpretability of ECDFormer. a, The integral gradient method is used to label the region in the entire molecule that contributes most to generating the spectrum. ‘P’ represents the position where this peak occurs, ‘Top’ represents the contribution ratio of the highlighted interval corresponding to the top-2 contributions of the entire molecule and ‘Acc(s)’ represents the accuracy of the peak’s symbol (positive/negative). Molecular fragments are highlighted in different colors (blue, green and tan) to distinguish their association with ECD spectral peaks at different wavelengths. b, Upon comparison, the molecule regions marked by integral gradient are observed to closely align with molecular orbital regions contributing to ECD peaks as determined by quantum chemical pharmaceutical molecules and (2) the generalization ability for mass and IR spectrum prediction.
Predictions on existing pharmaceutical molecules. Figure 3a, b shows the ECD predictions for existing pharmaceutical molecules. We first visualize the ECD predictions for $R$ and $S$ types of hydroxybrevianamide ${}^{30}$ , a natural product in Aspergillus sp. fungus. Figure 3a shows that ECDFormer can successfully predict the ECD spectra for $R$ -type and $S$ -type molecule pairs. We also visualize the ECD predictions for other pharmaceutical molecules, including Wulfenioidins ${\mathrm{L}}^{31}$ (anti-Zika virus effect), Purpurascenines ${\mathrm{B}}^{32}$ (antagonist effect) and alkaloids ${}^{33}$ (anti-inflammatory effect). Our ECDFormer predictions also match the ECD theoretical spectra of these complex natural products with pharmaceutical effects.
Predictions for mass spectra. Tandem mass spectrum is an important spectral metric for gauging molecular attributes. MassBank of North America (MONA) ${}^{34}$ is a large-scale mass spectrum dataset with one million mass spectra. We apply MONA for both training and evaluation. By decoupling the peaks in mass spectra, we can utilize the peak prediction module of ECDFormer to accomplish the task of mass spectra prediction. Figure 3c illustrates a visual example of ECDFormer’s approach to mass spectra prediction under the ${\left\lbrack M + H\right\rbrack }^{ + }$ adduct. It is important to note that, due to the adducts, the largest peak in the tandem mass spectra does not necessarily correspond to the overall molecular mass. In Fig. 3c, blue represents the real spectra and red represents the predicted spectra. Our model exhibits commendable generalization to the task of mass spectra prediction, further elucidating the flexible generalizability of our ECDFormer framework.
Prediction for IR spectra. We follow the IR spectrum dataset in Deta- ${\text{ Net }}^{9}$ , which contains 130,000 molecules and their IR spectra. Due to time constraints, we used only 10,000 molecules for the training and evaluation datasets. However, with the small dataset, ECDformer achieved strong performance without modifying the model structure. Figure 3d shows examples of predicted IR spectra, further illustrating the model’s generalization capability in the spectral domain. Detailed analyses are shown in Supplementary Section 4.
The interpretable analysis for ECDFormer
For the interpretability aspect, in comparison with other spectral generation methods, our ECDFormer framework exhibits commendable interpretability due to its attribute prediction for spectral peak disentanglement. Specifically, Fig. 4 demonstrates the interpretability of ECDFormer. To elucidate the process of how ECDFormer generates spectra, we used the integrated gradients method to delineate regions within the entire molecule that contribute most substantially to spectrum generation. Figure 4a demonstrates the contribution of different molecules to peaks at various positions in the spectrum through integrated gradients. We observe that chromophores within the molecules generally contribute substantially to the peaks, which is consistent with the chemical principles of ECD spectroscopy.
Figure 4b further validates the correctness of the highlighted chromophores in Fig. 4a through quantum chemical calculations. Specifically, the three-dimensional structure of a molecule dictates the shape of its ECD spectrum. For theoretical computations, we selected three molecules depicted in Fig. 4a, each characterized by vital chromophores such as benzene rings, carbon-carbon double bonds, carbon-carbon triple bonds and carbon-oxygen double bonds. In the computational results, by examining the characteristic peaks of the ECD spectra for these molecules, we discovered a correlation with specific electronic transitions within the molecules. These transitions involve particular molecular orbitals deemed crucial in quantized computations. Upon comparison, the regions marked using the integral gradient method were observed to closely align with molecular orbital regions contributing to ECD peaks as determined by quantum chemical calculations. Hence, we postulate that ECDFormer can learn the chiral features of molecules, thereby enabling the accurate generation of molecular ECD spectra.
Discussion
This study proposes a research framework for integrating deep learning techniques into the field of chemistry to improve the efficiency of researchers in acquiring the ECD spectra of chiral molecules. The proposed ECDFormer focuses on several core issues including data collection, three-dimensional characterization of chiral molecules and understanding of chirality. We also explore the ECDFormer framework’s potential to infer molecular structures from predicted spectra in Supplementary Table 4. For the ECD spectrum, although the resolution is low, it still provides some structural information at the molecular level, which is based on the already-established atomic-level structure. Figure 4 demonstrates that ECDFormer partially correlates predicted CD peaks with molecular orbital regions. For the IR spectrum that provides structural information at the atom level, ECDFormer accurately identifies common functional groups from predicted IR peak positions. However, ECDFormer still cannot reconstruct the overall structure of the molecule from IR and ECD spectra, and this challenge remains unresolved.
Furthermore, there are areas for improvement in this study that could be addressed in future research. Initially, in compiling the extensive ECD spectral data, we bypassed the conformational search for each molecule to minimize time and cost. This may potentially affect the precision of the ECD spectra of flexible molecules. In addition, our CMCDS dataset focused solely on molecules with a monochiral center, intentionally excluding those with polychiral centers. Despite the effective zero-shot generalization of our ECDFormer model to molecules with polychiral centers (details available in Supplementary Section 3), we aspire to refine the polychiral molecule component in subsequent dataset expansions to enable the model to learn a more comprehensive representation of chiral structures. Despite these constraints, we remain optimistic about the ECDFormer model’s potential in accurately determining the absolute configuration of chiral molecules. The model offers a rapid way to acquire ECD spectra directly from the SMILES notation of the molecules.
Methods
Problem definition and preliminary for ECD prediction
We first briefly introduce the problem definition of the ECD prediction task for the convenience of description and discussion.
ECD prediction task. Generally, each chiral molecule has its ECD. For molecule ${M}_{1}$ , we represent the ECD of ${M}_{1}$ as ${\left\{ {S}_{1 : i}\right\} }_{i = 1}^{{N}_{\mathrm{w}}}$ , where ${S}_{1 : i}$ is the input light wavelength from 80 to ${450}\mathrm{\;{nm}}$ , and ${N}_{\mathrm{w}}$ is the ECD range from -200 mdeg to 200 mdeg. For ${M}_{1}$ ’s enantiomer ${\widetilde{M}}_{1}$ , we represent its ECD as ${\left\{ -{S}_{1 : i}\right\} }_{i = 1}^{{N}_{\mathrm{w}}}$ . When applying deep learning models for ECD prediction, it seems reasonable to establish a site-level sequence prediction model to predict every ${S}_{1 : i}$ of the ECD. However, in practice analysis, molecular representation lacks the knowledge to reconstruct the site-level ECD sequence. Thus, we simplify the ECD prediction task from the chemical perspective, focusing on the peak features in the ECD sequence. Specifically, we represent molecule ${M}_{1}$ ’s ECD sequence as ${\left\{ {\mathcal{R}}_{i;j}\right\} }_{i = 1}^{{N}_{\mathrm{p}}}$ , where ${\mathcal{R}}_{i;j}$ is the $j$ th peak in ECD sequence and ${N}_{\mathrm{p}}$ is the peak number. The ECD prediction task aims to predict the peak number ${N}_{\mathrm{p}}$ , the peak position and the height for ${\mathcal{P}}_{1 : j}$ . Under the new task setting, deep learning models achieve better performance on ECD prediction and chiral molecule distinguishment.
Graph neural network and transformer. Graph neural network ${}^{35}$ is an outstanding model for graph representation learning. For molecules, the atoms and chemical bonds are easy to interpret as a graph. Thus, GNN has become the regular model to extract molecular representation ${}^{{14},{36} - {39}}$ . For an input molecular graph, GNN takes the weighted average of node features and their neighbor features, resulting in new representations for nodes. GNN iterates this process through multiple layers of fully connected layers to progressively propagate and aggregate information from the nodes, leading to richer molecule representations.
The transformer ${}^{40}$ is a seminal deep-learning model for the sequence processing task. It utilizes stacked attention ${}^{{29},{41},{42}}$ modules to fuse sequence features from different positions, thereby achieving improved sequence prediction performance. The transformer consists of two parts: the encoder and the decoder. The encoder uses bidirectional attention modules to better integrate input features, while the decoder uses unidirectional attention modules for sequence prediction. In this work, we have redefined the ECD prediction task as peak information prediction, and therefore, we apply the transformer encoder structure for its enhanced feature fusion capability.
The framework of the proposed ECDFormer
The overview of our ECDFormer is illustrated in Fig. 1b, c. Our ECD-Former contains four major modules: (1) feature extraction module with modified geometric-enhanced ${\mathrm{{GNN}}}^{{43} - {45}}$ ,(2) peak property learning module with QFormer ${}^{{46},{47}}$ encoder,(3) peak property prediction module and (4) ECD rendering module. The workflow of our ECDFormer is described below.
The feature extraction module utilizes GeoGNN containing two graph convolutional networks to extract the molecule’s geometric and descriptor information from the molecule’s atom-bond graph and bond-angle graph. Then, the molecule representation features are fed into the peak property learning module together with empty query tokens. With the transformer encoder structure, the peak property learning module extracts the peak-related features from the molecule features to the empty query tokens. In the peak property prediction module, the resulting peak-related features are simultaneously fed into three specific task heads: the peak-number head, the peak-position head and the peak-height head to predict the peak properties. Finally, the ECD rendering module reconstructs the ECD spectra from the peak properties using mathematical simulation methods. Our framework obeys physical conservation conditions including the translation, rotation and permutation symmetry. The detailed proof is proposed in Supplementary Section 6. We further introduce more details about the feature extraction module, peak property learning module, peak property prediction module and ECD rendering module in the following subsections.
Molecular feature extraction module
As shown in Fig. 1b, for the molecular feature extraction module, we apply the geometric-enhanced GNN structure to encode molecular geometric features by modeling the atom-bond-angle corresponding relations. Compared with the traditional GNNs that consider only the atom-bond relationship, GeoGNN ${}^{{43},{44}}$ has a stronger ability in molecular representation modeling.
Specifically, for an input molecule $M$ , we denote its atom set as $\mathcal{V}$ , its bond set as $\varepsilon$ and its bond-angle set as $\mathcal{A}$ . Then, we introduce $M$ ’s atom-bond graph $G$ and bond-angle graph $H$ . The atom-bond graph is defined as $G = \left( {\mathcal{V},\mathcal{E}}\right)$ , where atom $u \in \mathcal{V}$ is regarded as the node of $G$ and bond $\left( {u, v}\right) \in \mathcal{E}$ as the edge of $G$ . Similarly, the bond-angle graph is defined as $H = \left( {\mathcal{E},\mathcal{A}}\right)$ , where bond $\left( {u, v}\right) \in \mathcal{E}$ is regarded as the node of $H$ and bond angle $\left( {u, v, w}\right) \in \mathcal{A}$ as the edge of $H$ . Both the atom-bond graph and the bond-angle graph are fed into the GeoGNN for further feature extraction.
Then, our feature extraction module learns the representation of atoms and bonds iteratively. For the $k$ th iteration, we use ${\mathbf{h}}_{u}$ and ${\mathbf{h}}_{uv}$ as the representation of atom $u$ and bond $\left( {u, v}\right)$ . To achieve information aggregation between the atom-bond graph $G$ and the bond-angle graph $H$ , the representation vectors of the bonds are taken as the information link between $G$ and $H$ . Specifically, the iteration of our feature extraction module contains two stages.
In the first stage, the bonds’ representation vectors are learned by aggregating messages from the neighboring bonds and corresponding bond angles in the bond-angle graph $H$ . Given bond $\left( {u, v}\right)$ , in $k$ th iteration, its representation ${\mathbf{h}}_{uv}^{\left( k\right) }$ is formalized by
$$ {\mathbf{a}}_{uv}^{\left( k\right) } = {\mathcal{F}}_{\text{ bond-angle }}^{\left( k\right) }\left( \left\{ \left( {{\mathbf{h}}_{uv}^{\left( k - 1\right) },{\mathbf{h}}_{uw}^{\left( k - 1\right) },{\mathbf{x}}_{wuv}}\right) \right. \right. \tag{1} $$$$ \left. \left. {\left. { : w \in \mathcal{N}\left( u\right) }\right) \cup \left\{ {\left( {{\mathbf{h}}_{uv}^{\left( k - 1\right) },{\mathbf{h}}_{vw}^{\left( k - 1\right) },{\mathbf{x}}_{uvw}}\right) : w \in \mathcal{N}\left( v\right) }\right) }\right\} \right) , $$$$ {\mathbf{h}}_{uv}^{\left( k\right) } = {\mathcal{W}}_{s} \times {\mathbf{h}}_{uv}^{\left( k - 1\right) } + {\mathbf{a}}_{uv}^{\left( k\right) }, \tag{2} $$where $\mathcal{N}\left( u\right)$ and $\mathcal{N}\left( v\right)$ are the neighbor atoms of $u$ and $v.\{ \left( {u, w}\right)$ : $w \in \mathcal{N}\left( u\right) \} \cup \{ \left( {v, w}\right) : w \in \mathcal{N}\left( v\right) \}$ are the neighbor bonds of bond $\left( {u, v}\right)$ . ${\mathcal{F}}_{\text{ bond-angle }}$ is an MLP with two linear layers, acting as the message aggregation function. ${\mathbf{a}}_{uv}$ is bond $\left( {u, v}\right)$ ’s aggregated feature from neighbor bonds. Then, the bond $\left( {u, v}\right)$ ’s representation vector is updated according to ${\mathbf{a}}_{uv}$ in equation (2).
In the second stage, with the updated bond representation in $H$ , we further learn the atoms’ representation by aggregating messages from the neighboring atoms and the corresponding bond representations from $H$ . Given an atom $u$ , its representation ${\mathbf{h}}_{u}^{\left( k\right) }$ in the $k$ th iteration is formalized as
$$ {\mathbf{a}}_{u}^{\left( k\right) } = {\mathcal{F}}_{\text{ atom-bond }}^{\left( k\right) }\left( \left\{ {\left( {{\mathbf{h}}_{u}^{\left( k - 1\right) },{\mathbf{h}}_{v}^{\left( k - 1\right) },{\mathbf{h}}_{uv}^{\left( k - 1\right) }}\right) : v \in \mathcal{N}\left( u\right) }\right\} \right) , \tag{3} $$$$ {\mathbf{h}}_{u}^{\left( k\right) } = {\mathcal{W}}_{s} \times {\mathbf{h}}_{u}^{\left( k - 1\right) } + {\mathbf{a}}_{u}^{\left( k\right) }, \tag{4} $$where $\mathcal{N}\left( u\right)$ represents the neighbor atoms of atom $u.{\mathcal{F}}_{\text{ atom-bond }}$ is an MLP with two linear layers, acting as the message aggregation function. ${\mathbf{a}}_{u}$ is the atom $u$ ’s aggregated feature from neighbor atoms. The representation of $u$ is updated according to ${\mathbf{a}}_{u}$ in equation (4).
After all iterations, we calculate the molecular global representation ${\mathbf{h}}_{G}$ by summarizing and pooling over the atoms’ representation $\left\{ {\mathbf{h}}_{u}\right\} ,\forall u \in \mathcal{V}$ . We further take the input molecule $M$ ’s global representation ${\mathbf{h}}_{G}$ and atom representations $\left\{ {\mathbf{h}}_{u}\right\}$ as the input of further modules.
Peak property learning module
Our peak property learning module aims to fuse the atom representation features and extract the key features with peak property information. We apply the transformer encoder as the fusion model due to its powerful feature fusion capability enabled by its cross-attention structure. Specifically, for molecule $M$ , we first random initialize a set of tokens ${\left\{ {\mathbf{Q}}_{i}\right\} }_{i = 1}^{n}$ as the peak tokens for $M$ . Then, we combine the peak tokens $\left\{ {\mathbf{Q}}_{i}\right\}$ with $M$ ’s global feature ${\mathbf{h}}_{G}$ and $M$ ’s atom features $\left\{ {\mathbf{h}}_{u}\right\}$ as the input tokens for transformer encoder, which is formalized as
$$ \left\lbrack {{\mathbf{Q}}_{j},{\mathbf{h}}_{G, j},{\mathbf{h}}_{u, j}}\right\rbrack = {\operatorname{Layer}}_{j}\left( {{\mathbf{Q}}_{j - 1},{\mathbf{h}}_{G, j - 1},{\mathbf{h}}_{u, j - 1}}\right) \tag{5} $$where Layer, represents the jth transformer encoder layer. After the cross-attention in $N$ transformer encoder layers, the ${\mathbf{Q}}_{N}$ denote the final representations for peak tokens. We get the peak number ${N}_{\mathrm{p}}$ from the molecular ground-truth ECD spectra ${\left\{ {\mathcal{P}}_{1 : j}\right\} }_{j = 1}^{{N}_{p}}$ . Thus, we extract the first ${N}_{\mathrm{p}}$ peak token features from ${\left\{ {\mathbf{Q}}_{i}\right\} }_{i = 1}^{n}$ as the peak property information of molecule $M$ .
Peak property prediction module
Our peak property prediction module aims to reconstruct the peak property, including the peak number, peak symbol and peak position, from the output features of the peak property learning module. For the peak number prediction, we apply the two-layer MLP to predict the peak number from the molecule global feature ${\mathbf{h}}_{G}$ , which is formalized as
$$ {\mathcal{P}}_{\text{ num }} = \operatorname{Linear}\left( {\operatorname{ReLU}\left( {\operatorname{Linear}\left( {\mathbf{h}}_{G}\right) }\right) }\right) , \tag{6} $$where ${\mathcal{P}}_{\text{ num }}$ represents the peak number for the ECD spectra of molecule $M$ . For peak height ${\mathcal{P}}_{\text{ height }}$ and peak position ${\mathcal{P}}_{\text{ pos }}$ . we also apply two separate two-layer MLPs to predict ${\mathcal{P}}_{\text{ symbol }}$ and ${\mathcal{P}}_{\text{ pos }}$ from the corresponding peak token ${\mathbf{Q}}_{i}$ from ${\left\{ {\mathbf{Q}}_{i}\right\} }_{i = 1}^{n}$
$$ {\mathcal{P}}_{\text{ pos }} = \operatorname{Linear}\left( {\operatorname{ReLU}\left( {\operatorname{Linear}\left( {\mathbf{Q}}_{i}\right) }\right) }\right) , \tag{7} $$$$ {\mathcal{P}}_{\text{ symbol }} = \operatorname{Linear}\left( {\operatorname{ReLU}\left( {\operatorname{Linear}\left( {\mathbf{Q}}_{i}\right) }\right) }\right) . \tag{8} $$Here, we predict all three peak properties that are vital for ECD spectra prediction.
ECD spectrum rendering module
The final module, the ECD spectrum rendering module, aims to render the predicted ECD spectra from the abstract peak properties. We use the Gaussian noise distribution model to fit the spectral curve. Specifically, given the position ${l}_{\mathrm{p}}$ and the corresponding height ${l}_{\mathrm{h}}$ of a peak, we set a Gaussian noise distribution with mean value: $\mu = {l}_{\mathrm{p}}$ and a standard deviation of $\sigma = {l}_{\mathrm{h}}$ . We then extract the distribution range of $\left\lbrack {\mu - {6\sigma },\mu + {6\sigma }}\right\rbrack$ as the fitting curve for the peak. We render the predicted ECD spectra for molecule $M$ by combining the fitting curves of all predicted peaks.
Experimental settings and training hyperparameters
In the molecular feature extraction module, we set the number of GINConv in GeoGNN to be 5 and the graph pooling strategy to be summation. The embedding dimension of molecular features is 128 , and the batch size for ECDFormer is 256. We apply the AdamW ${}^{48}$ optimizer implemented in Pytorch. The learning rate is $1{\mathrm{e}}^{-3}$ . For better convergence, we apply the StepLR schedular with a decreasing rate of 0.25 to adaptively adjust the learning rate. During training, the CMCDS dataset is randomly divided into 90, 5 and 5 respectively for train, valid and test splits. ECDFormer is trained with 1,000 epochs, selecting the best valid checkpoint for the testing procedure. For other deep-learning baselines, we apply a learning rate of $5{\mathrm{e}}^{-4}$ and epoch of 800, while other parameters are the same as ECDFormer.
Data availability
The first large-scale ECD spectra dataset for chiral molecules, the CMCDS dataset, is available via figshare at https://doi.org/10.6084/ m9.figshare.27763119.v1 (ref. 49). Source data are provided with this paper.
Code availability
All code used in data analysis and preparation of the manuscript, alongside a description of necessary steps for reproducing results, is available via GitHub at https://github.com/HowardLi1984/ECDFormer (ref. 50) and Zenodo at https://doi.org/10.5281/zenodo.14172585 (ref. 51).
References
Noyori, R. Asymmetric catalysis: science and opportunities (Nobel lecture). Angew. Chem. Int. Ed. Engl. 41, 2008-2022 (2002).
Mukherjee, S. The 2021 Nobel Prize in Chemistry: asymmetric catalysis with small organic molecules. Curr. Sci. 121, 1148 (2021).
Amabilino, D. B. & Veciana, J. Supramolecular chiral functional materials. Supramol. Chiral 265, 253-302 (2006).
Shen, B., Kim, Y. & Lee, M. Supramolecular chiral 2D materials and emerging functions. Adv. Mater. 32, 1905669 (2020).
Teng, Y. et al. Advances and applications of chiral resolution in pharmaceutical field. Chirality 34, 1094-1119 (2022).
Lininger, A. et al. Chirality in light-matter interaction. Adv. Mater. 35, 2107325 (2023).
Evers, F. et al. Theory of chirality induced spin selectivity: progress and challenges. Adv. Mater. 34, 2106629 (2022).
Ye, S. et al. A machine learning protocol for predicting protein infrared spectra. J. Am. Chem. Soc. 142, 19071-19077 (2020).
Zou, Z. et al. A deep learning model for predicting selected organic molecular spectra. Nat. Comput. Sci. 3, 957-964 (2023).
Ghosh, K. et al. Deep learning spectroscopy: neural networks for molecular excitation spectra. Adv. Mater. 6, 1801367 (2019).
Park, J., Jo, J. & Yoon, S. Mass spectra prediction with structural motif-based graph neural networks. Sci. Rep. 14, 1400 (2024).
Young, A., Røst, H. & Wang, B. Tandem mass spectrum prediction for small molecules using graph transformers. Nat. Mach. Intell. 6, 404-416 (2024).
Goldman, S., Bradshaw, J., Xin, J. & Coley, C. Prefix-tree decoding for predicting mass spectra from molecules. Adv. Neural Inform. Process. Syst. 36, 48548-48572 (2023).
Xu, H., Lin, J., Zhang, D. & Mo, F. Retention time prediction for chromatographic enantioseparation by quantile geometry-enhanced graph neural network. Nat. Commun. 14, 3095 (2023).
Li, J., Li, D., Savarese, S. & Hoi, S. Blip-2: bootstrapping language-image pre-training with frozen image encoders and large language models. ICML 19730-19742 (2023).
Zhang, H., Qi, A. & Li, R. Traceability and development of optical activity and chiroptical spectroscopy. Daxue Huaxue 37, 2105009 (2021).
Frisch, M. J., Trucks, G. W. & Schlegel, H. B. Gaussian ~ 16 Revision A.03 (Gaussian, 2016).
Stephens, P. J., Devlin, F. J., Chabalowski, C. F. & Frisch, M. J. Ab initio calculation of vibrational absorption and circular dichroism spectra using density functional force fields. J. Phys. Chem. 98, 11623-11627 (1994).
Yanai, T., Tew, D. P. & Handy, N. C. A new hybrid exchange-correlation functional using the Coulomb-attenuating method (CAM-B3LYP). Chem. Phys. Lett. 393, 51-57 (2004).
Rogers, D. M. et al. Electronic circular dichroism spectroscopy of proteins. Chem. 5, 2751-2774 (2019).
Mao, A., Mohri, M. & Zhong, Y. Cross-entropy loss functions: theoretical analysis and applications. Int. Conf. Mach. Learn. 23803-23828 (2023).
Nagy, G., Igaev, M., Jones, N. C., Hoffmann, S. V. & Grubmuller, H. SESCA: predicting circular dichroism spectra from protein molecular structures. J. Chem. Theory Comput. 15, 5087-5102 (2019).
Micsonai, A., Bulyáki, É. & Kardos, J. BeStSel: from secondary structure analysis to protein fold prediction by circular dichroism spectroscopy. Methods Mol. Biol. https://doi.org/10.1007/978-1- 0716-0892-0_11 (2021).
Zhao, L. et al. Accurate machine learning prediction of protein circular dichroism spectra with embedded density descriptors. JACS Au. 1, 2377-2384 (2021).
Artrith, N. et al. Best practices in machine learning for chemistry. Nat. Chem. 13, 505-508 (2021).
Wei, J. et al. Machine learning in materials science. InfoMat. 1, 338-358 (2019).
Shi, X. et al. Convolutional LSTM network: a machine learning approach for precipitation nowcasting. Adv. Neural Inform. Process. Syst. 28, 802-810 (2015).
Chung, J., Gulcehre, C., Cho, K. & Bengio, Y. Empirical evaluation of gated recurrent neural networks on sequence modeling. Ada. Neural Inform. Process. Syst. 26, 756-764 (2014).
Article
Vaswani, A. Attention is all you need. Adv. Neural Inform. Process. Syst. 30, 6000-6010 (2017).
Xu, W. F. et al. 17-Hydroxybrevianamide N and its N1-methyl derivative, quinazolinones from a soft-coral-derived Aspergillus sp. fungus: 13S enantiomers as the true natural products. J. Nat. Prod. 84, 1353-1358 (2021).
Tu, W. C. et al. Wulfenioidins D-N, structurally diverse diterpenoids with anti-Zika virus activity isolated from Orthosiphon wulfenioides. J. Nat. Prod. 86, 2348-2359 (2023).
Lam, Y. T. et al. Purpurascenines A-C, azepino-indole alkaloids from cortinarius purpurascens: isolation, biosynthesis, and activity studies on the 5-HT ${}_{2\mathrm{\;A}}$ receptor. J. Nat. Prod. 86,1373-1384 (2023).
Liu, F. et al. Anti-inflammatory quinoline alkaloids from the roots of Waltheria indica. J. Nat. Prod. 86, 276-289 (2023).
Wallace, W. E., Ji, W., Tchekhovskoi, D. V., Phinney, K. W. & Stein, S. E. Mass spectral library quality assurance by inter-library comparison. J. Am. Soc. Mass Spectrom. 28, 733-738 (2017).
Zhang, S., Tong, H., Xu, J. & Maciejewski, R. Graph convolutional networks: a comprehensive review. Comput. Soc. Netw. 6, 1-23 (2019).
Mahmood, O., Mansimov, E., Bonneau, R. & Cho, K. Masked graph modeling for molecule generation. Nat. Commun. 12, 3156 (2021).
Zhong, W., Yang, Z. & Chen, C. Y. C. Retrosynthesis prediction using an end-to-end graph generative architecture for molecular graph editing. Nat. Commun. 14, 3009 (2023).
Wang, Y. et al. Retrosynthesis prediction with an interpretable deep-learning framework based on molecular assembly tasks. Nat. Commun. 14, 6155 (2023).
Chen, Z. et al. Multi-granularity score-based generative framework enables efficient inverse design of complex organics. Preprint at https://arxiv.org/abs/2409.07912 (2024).
Han, K. et al. A survey on vision transformer. IEEE Trans. Pattern Anal. 45, 87-110 (2022).
Li, H., Jia, C., Jin, P., Cheng, Z., Li, K., Sui, J. & Yuan, L. Freestyleret: retrieving images from style-diversified queries. Eur. Conf. Comput. Vis. 81, 258-274 (2024).
Li, H. et al. Weakly-supervised 3D spatial reasoning for text-based visual question answering. IEEE Trans. Image Process. 32, 3367-3382 (2023).
Fang, X. et al. Geometry-enhanced molecular representation learning for property prediction. Nat. Mach. Intell. 4, 127-134 (2022).
Peng, Y. et al. Enhanced graph isomorphism network for molecular admet properties prediction. IEEE Access. 8, 168344-168360 (2020).
Li, H., Li, X., Karimi, B., Chen, J. & Sun, M. Joint learning of object graph and relation graph for visual question answering. Int. Conf. Multimedia Expo. 1-6 (2022).
Zhu, X., Su, W., Lu, L., Li, B., Wang, X. & Dai, J. Deformable DETR: deformable transformers for end-to-end object detection. In International Conference on Learning Representations 2021 https://openreview.net/pdf?id=gZ9hCDWe6ke (ICLR, 2021).
Luong, K. D. & Singh, A. Application of transformers in cheminformatics. J. Chem. Inf. Model. 64, 4392-4409 (2024).
Kingma, D. P. & Ba, J. Adam: a method for stochastic optimization. Preprint at https://arxiv.org/abs/1412.6980 (2014).
Li, H. et al. Public data files for CMCDS dataset. figshare https://doi.org/10.6084/m9.figshare.27763119.v1 (2024).
Li, H. et al. Public code for ECDFormer. GitHub https://github.com/HowardLi1984/ECDFormer (2024).
Li, H. et al. Public code for ECDFormer v1.0.0 Zenodo. Zenodo https://doi.org/10.5281/zenodo.14172585 (2024).
Acknowledgements
We acknowledge the financial support from the Natural Science Foundation of China (nos. 62202014, 62332002, 62425101, 62425101, 62088102, 22272133, 21971217, 22150013, 22071004 and 21933001), Shenzhen Basic Research Program (no. JCYJ20220813151736001) and the Fundamental Research Funds for the Central Universities (nos. 20720240053 and 20720240070). F.M. thanks Peking University Shenzhen Graduate School and Shenzhen Government for the start-up funding support. We thank the High-Performance Computing Platform of Peking University for machine learning model training. We also extend our gratitude to all the reviewers for their insightful and constructive feedback, which has greatly contributed to the enhancement of our work.
Author contributions
H.L., D.L., X.W. and F.M. conceived the basic idea and designed the research study. D.L. and F.M. generated the ECD spectra dataset using DFT calculation. H.L. developed the method. L.Y. and F.M. further modified the method. D.L. and X.W. conceived the evaluation metric in the experiment. H.L. and D.L. evaluated the performance of the CMCDS dataset and natural product molecules. H.L. and D.L. wrote the manuscript. L.Y., Y.T., X.W. and F.M. revised the manuscript. Y.W. revised the figures of the manuscript. L.Y. and Y.T. provided the deep learning computing platform.
Competing interests
The authors declare no competing interests.
Additional information
Supplementary information The online version contains supplementary material available at https://doi.org/10.1038/s43588-024-00757-7.
Correspondence and requests for materials should be addressed to Li Yuan, Xinchang Wang or Fanyang Mo.
Peer review information Nature Computational Science thanks the anonymous reviewer(s) for their contribution to the peer review of this work. Primary Handling Editor: Katilin McCardle, in collaboration with the Nature Computational Science team. Peer reviewer reports are available.
Reprints and permissions information is available at www.nature.com/reprints.
Publisher’s note Springer Nature remains neutral with regard to jurisdictional claims in published maps and institutional affiliations.
Springer Nature or its licensor (e.g. a society or other partner) holds exclusive rights to this article under a publishing agreement with the author(s) or other rightsholder(s); author self-archiving of the accepted manuscript version of this article is solely governed by the terms of such publishing agreement and applicable law.
© The Author(s), under exclusive licence to Springer Nature America, Inc. 2025