Infrared Spectra Prediction for Functional Group Region Utilizing a Machine Learning Approach with Structural Neighboring Mechanism
中文 / Bilingual · English version
Chengchun Liu, Ruqiang Zou, and Fanyang Mo*
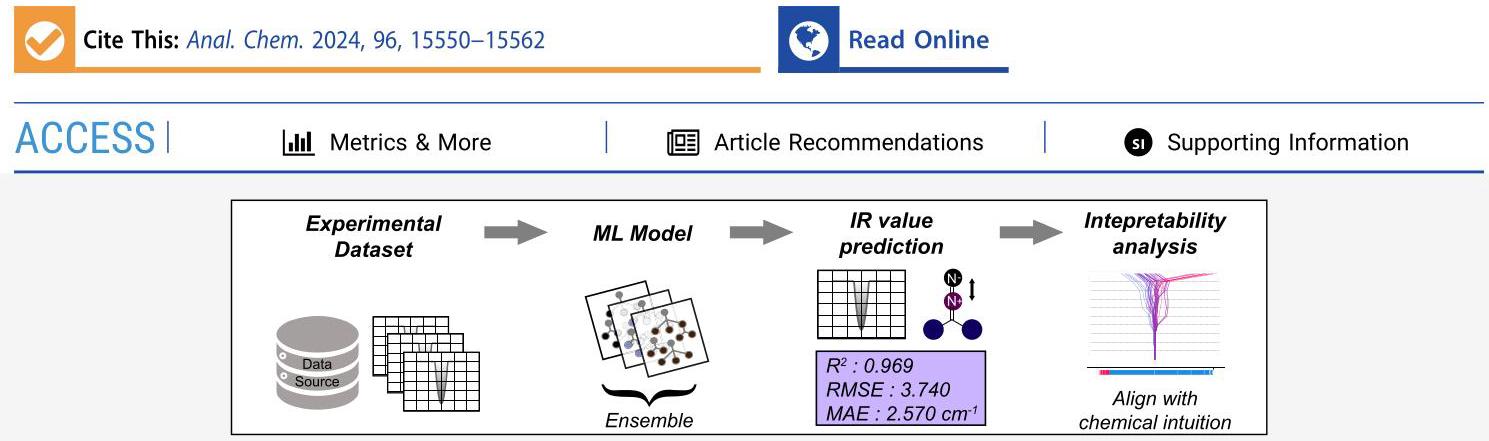
ABSTRACT: Infrared (IR) spectroscopy is a pivotal technique in chemical research for elucidating molecular structures and dynamics through vibrational and rotational transitions. However, the intricate molecular fingerprints characterized by unique vibrational and rotational patterns present substantial analytical challenges. Here, we present a machine learning approach employing a structural neighboring mechanism tailored to enhance the prediction and interpretation of infrared spectra. Our model distinguishes itself by honing in on chemical information proximal to functional groups, thereby significantly bolstering the accuracy, robustness, and interpretability of spectral predictions. This method not only demystifies the correlations between infrared spectral features and molecular structures but also offers a scalable and efficient paradigm for dissecting complex molecular interactions.
I INTRODUCTION
Infrared (IR) spectroscopy offers an expansive array of chemical insights, functioning akin to a molecular fingerprint, and provides substantial support for the elucidation of molecular properties. ${}^{1}$ Despite the foundational insights afforded by theoretical frameworks and empirical knowledge, the intricate process of structure identification requires the examination of tabular data and comparison with existing databases. ${}^{2,3}$ A notable advantage of machine learning (ML) algorithms is their ability to identify complex correlations hidden within large data sets, thus enabling the construction of models capable of predicting outcomes previously unknown ${}^{4}$ (Figure 1).
The fusion of machine learning techniques with IR spectroscopy for the elucidation of structure-property relationships within molecules represents a critical area of research. Wang et al. introduced a neural network model capable of predicting IR spectra using Morgan fingerprints as input, utilizing earth mover’s distance (EMD) for metric and loss function purposes. ${}^{5}$ However, despite the computational efficiency of bit-vectors produced by Morgan fingerprints, their direct interpretation by human researchers is challenging, highlighting a gap in intuitive interpretability and the extraction of specific chemical information or structural insights.
Molecular feature engineering is identified as a crucial approach for integrating existing chemical knowledge into descriptors, thereby enhancing the descriptive capability and facilitating pattern recognition within the data set. ${}^{6 - 8}$ Recent work by Marquetand et al. has considerably enhanced the accuracy and efficiency of molecular IR spectra predictions by merging ab initio molecular dynamics (AIMD) with neural network models. This integration shows promise for a wide range of molecules, particularly in simulating peptide dynamics, illustrating the potential of these techniques across diverse molecular systems. ${}^{9}$ Schütte et al. highlighted the potential of neural networks to accelerate IR spectrum predictions. SchNetPack 2.0, based on PyTorch, offers tools for molecular dynamics simulations, including infrared and Raman spectra calculations. It computes essential spectra such as the power spectrum, IR spectrum, and Raman spectrum by Fourier transforming the time autocorrelation functions of momentum, dipole moment, and polarizability data, respectively. Accessible through the md.data.spectra module, SchNetPack 2.0 enhances spectral prediction efficiency and accuracy, advancing neural networks’ role in computational spectroscopy. ${}^{10}$ FieldSchNet leverages learned radial interaction functions to improve atomic representation in simulations. ${}^{11}$ Concurrently, the field-induced recursively embedded atom neural network (FIREANN) exemplifies advancements in estimating IR spectra by calculating molecular potential energies and dipole moments. FIREANN introduces a field-dependent feature in the atomic environment description, allowing simultaneous prediction of energy variations and response properties under external fields. ${}^{12}$ Jiang et al. have developed a novel machine learning protocol for the rapid prediction of amide I IR spectra of proteins, achieving a high degree of alignment with experimental data and surpassing traditional quantum mechanical calculation methods. ${}^{13}$ Additionally, Jiang et al. have introduced a machine learning approach that accurately predicts IR and Raman vibrational spectra from molecular structures, significantly reducing computational costs compared to conventional methods. ${}^{14}$

Received: April 16, 2024
Revised: September 3, 2024
Accepted: September 8, 2024
Published: September 19, 2024
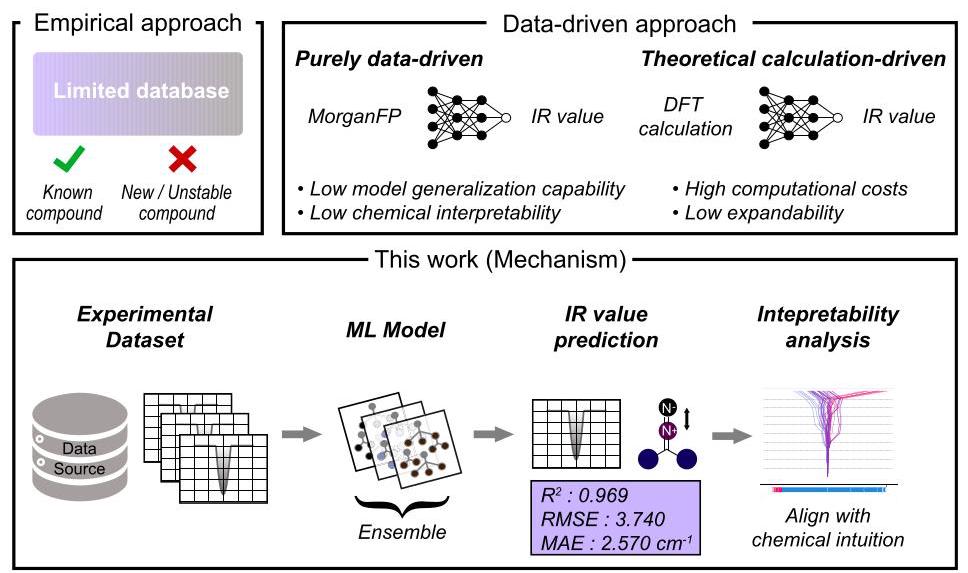
Figure 1. An overview of the study’s integrated approach to IR value prediction, contrasting empirical, purely data-driven, and theoretical methods.
Nevertheless, the scalability of models based on theoretically calculated molecular descriptors remains limited by their extensive computational requirements, ${}^{15}$ underscoring the need for the development of cost-effective, highly predictive, and transferable methodologies. Empirical evidence indicates that the IR absorption values of functional groups are predominantly influenced by adjacent atoms and bonds. ${}^{16}$ Here, we introduce a knowledge-embedding approach, termed the structural neighboring mechanism (SNM), applied to the functional group region of IR spectra. This method discerns key structural fragments that highlight chemical information proximate to the functional groups, quantified as types and numbers, forming the basis for structural neighboring mechanism-based descriptors (SNMD). The SNMD-equipped ML model demonstrates exceptional proficiency in predicting the IR characteristic absorption peaks of functional groups, closely aligning with experimental observations. Crucially, the model’s interpretability is aligned with chemical intuition, enabling predictions about IR signals of functional groups and elucidating the impact of molecular fine structure on these signals.
METHOD SECTION
Featurization of Molecular Structure by Structural Neighboring Mechanism. SMILES Parsing and Hydrogen
Addition. The SMILES string $S$ is parsed to generate the molecular structure $M$ , followed by hydrogen addition:
$$ M = \text{ Chem. MolFromSmiles }\left( S\right) \tag{1} $$$$ M = \text{ Chem. AddHs }\left( M\right) \tag{2} $$Functional Group Identification.
- Carbonyl Group: The target carbon ${C}_{\text{ target }}$ is identified by locating a carbon atom double-bonded to oxygen ${O}_{\text{ target }}$ :
- Diazo Group: The target nitrogen ${N}^{ + }$ is identified by locating a nitrogen with a formal positive charge:
Neighboring Atom Identification. Neighboring atoms of ${C}_{\text{ target }}$ are identified, excluding ${O}_{\text{ target }}$ or ${N}^{ + }$ , and sorted by atomic number and predefined priority order:
$$ {N}_{{C}_{\text{ target }}} = \left\{ {N \in \text{ neighbors }\left( {C}_{\text{ target }}\right) \mid N \neq {O}_{\text{ target }}\text{ or }{N}^{ + }}\right\} \tag{7} $$$$ {N}_{\text{ sorted }} = \operatorname{sort}\left( {{N}_{{C}_{\text{ target }}},}\right. \text{ key } = \text{ atomic\_number, reverse } $$$$ = \text{ True) } \tag{8} $$$$ {N}_{\text{ priority\_sorted }} = \operatorname{sort}\left( {{N}_{\text{ sorted }},\text{ key } = \min \left( \text{ priority\_order }\right) }\right) $$(9)
$$ {R}_{1},{R}_{2} = {N}_{\text{ priority\_sorted }}\left\lbrack 0\right\rbrack ,{N}_{\text{ priority\_sorted }}\left\lbrack 1\right\rbrack \tag{10} $$Feature Extraction. Morgan Fingerprint. The Morgan fingerprint is computed to represent molecular features:
$$ {FP} = \text{ AllChem.GetMorganFingerprintAsBitVect }(M\text{ , } $$$$ \text{ radius } = 2\text{ , nBits } = {2048}\text{ ) } \tag{11} $$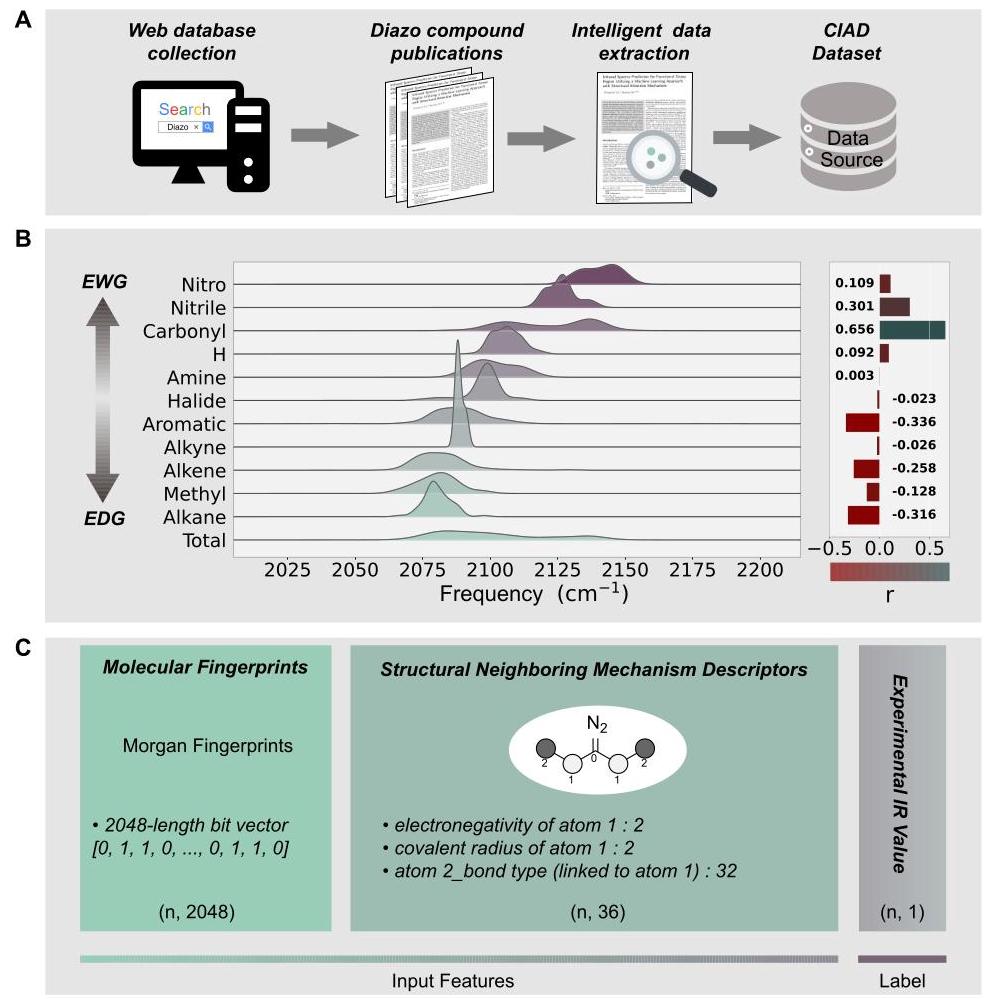
Figure 2. Data acquisition and analysis of diazo compounds. (A) Data retrieval flow from web search to CIAD data set formation using intelligent extraction. (B) CIAD data set spectral data display. (C) Machine learning input features: Morgan fingerprints and structural neighboring mechanism descriptors, with IR values as the target.
Feature Engineering. A feature dictionary is constructed and updated based on ${R}_{1}$ ’s and ${R}_{2}$ ’s connections. Additional features include electronegativity $\left( E\right)$ , covalent radius $\left( {R}_{c}\right)$ , and atomic numbers $\left( Z\right)$ :
$$ \text{ counts }\left\lbrack {f,\{ A{\} }_{{B}_{\text{ suffix }}}^{\prime }}\right\rbrack + = 1 \tag{12} $$$$ {Z}_{{R}_{1}} = \text{ atomic\_number\_dict }\left\lbrack {R}_{1}\right\rbrack \tag{13} $$$$ {Z}_{{R}_{2}} = \text{ atomic\_number\_dict }\left\lbrack {R}_{2}\right\rbrack \tag{14} $$$$ {E}_{{R}_{1}} = \text{ electronegativity\_dict }\left\lbrack {Z}_{{R}_{1}}\right\rbrack \tag{15} $$$$ {E}_{{R}_{2}} = \text{ electronegativity\_dict }\left\lbrack {Z}_{{R}_{2}}\right\rbrack \tag{16} $$$$ {R}_{{c}_{{R}_{1}}} = \text{ covalent\_radius\_dict }\left\lbrack {Z}_{{R}_{1}}\right\rbrack \tag{17} $$$$ {R}_{{c}_{{R}_{2}}} = \text{ covalent\_radius\_dict }\left\lbrack {Z}_{{R}_{2}}\right\rbrack \tag{18} $$This method systematically captures and quantifies molecular structural characteristics, facilitating subsequent analysis and machine learning applications.
Computational Chemistry Experiments. The second subsection details our computational chemistry experiments, which employ Density Functional Theory (DFT) and Gaussian simulations. The key elements of this section are
Optimization and frequency calculations performed using Gaussian software (Gaussian 16) to determine the most stable conformers and their corresponding energy states of diazo compounds.
The application of a vibrational frequency scaling factor of 0.951 , as determined from data in the CCCBDB, to adjust calculated frequencies for better agreement with experimental data.
RESULTS AND DISCUSSION
Data Set Construction and Feature Engineering. This research compiled a data set of 1,827 diazo compounds. The compounds were characterized by their molecular structures using Simplified Molecular Input Line Entry System (SMILES) notations and their infrared absorption spectra obtained from experimental measurements (Figure 2A). The methodology was based on experimental observation, avoiding the use of theoretical models in favor of direct empirical evidence. This data set was extracted from 297 scholarly articles using a regular expression-based method for intelligent text retrieval. The methodology is outlined in Figure S1, with a comprehensive overview of the CIAD data set provided in Figure S2.
To ensure comprehensive data set representation, we included diazo groups with various chemical substituents. Electron-withdrawing groups (EWGs) significantly elevate the infrared frequency associated with the diazo groups, while electron-donating groups (EDGs) lower it. These shifts are quantitatively analyzed using Pearson correlation coefficients (r). Figure 2B illustrates the distribution of infrared absorption frequencies for diazo groups with different substituents. The right panel displays the Pearson correlation coefficients, highlighting the strength and direction of the relationship between the substituents’ electronic nature and the infrared frequency shifts. Positive $r$ values indicate that EWGs increase the frequency, while negative $r$ values show that EDGs decrease it. The electronic nature of substituent groups influences their electron-donating or electron-withdrawing capabilities relative to the diazo group. EWGs, such as nitro and nitrile, increase vibrational frequencies by withdrawing electrons. In contrast, EDGs, such as alkyl groups, decrease vibrational frequencies by donating electrons. The data set covers the absorption frequency of diazo groups in the infrared spectrum, ranging from 2000 to ${2200}{\mathrm{\;{cm}}}^{-1}$ . The analysis employed two types of descriptors: the Structural Neighboring Mechanism-based Descriptor (SNMD) and the 2048-bit Morgan Fingerprint (MorganFP), which is derived from the SMILES sequences of the molecules (Figure 2C). Here, the tensor shapes are indicated as $\left( {\mathrm{n},\mathrm{x}}\right)$ , where $\mathrm{n}$ denotes the total number of training data points. The label shape $\left( {\mathrm{n},1}\right)$ signifies that the model predicts the IR frequencies. The SNMD is divided into two components. The first component assesses the electronegativity and covalent radius of the atom directly bonded to the diazo group. The second component considers the atoms and various bond types bonded to this first atom, including nonmetallic and metalloid elements such as I, Br, Cl, S, P, Si, F, O, C, N, B, and H, and single, double, triple, and aromatic bonds. After eliminating combinations that were deemed implausible under valence bond theory, we identified a total of 36 viable combinations, which were numerically encoded for analysis. The statistical analysis of the SNMD is provided in Table S1. The final data set consisted of 2,084 descriptors, which were normalized before being used in model development.
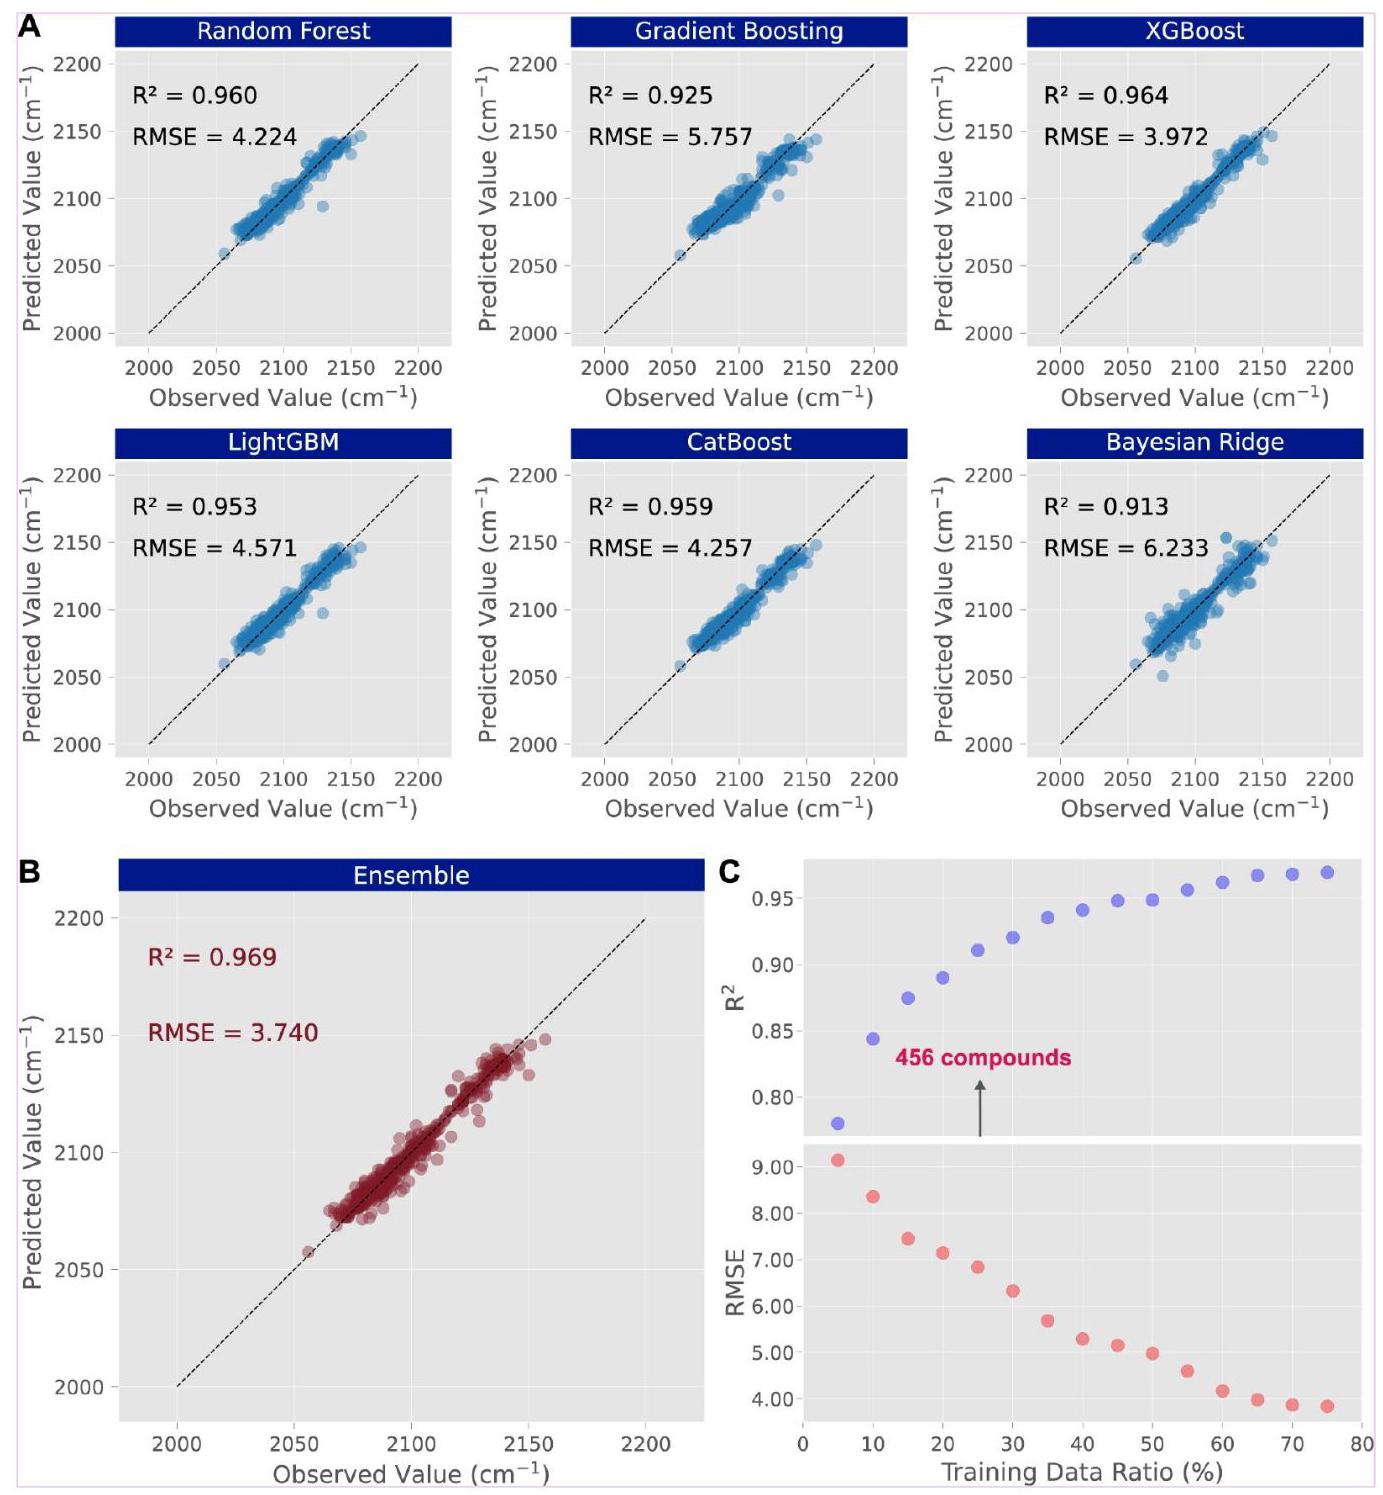
Figure 3. Quantitative assessment of predictive model performance. (A) A comparison of different machine learning algorithms. (B) Ensemble model that combines the strengths of different machine learning algorithms. (C) A learning curve that quantitatively details the evolution of the model’s coefficient of determination $\left( {R}^{2}\right)$ and root-mean-square error (RMSE) metrics, which depend on incremental expansion of the training. data set size.
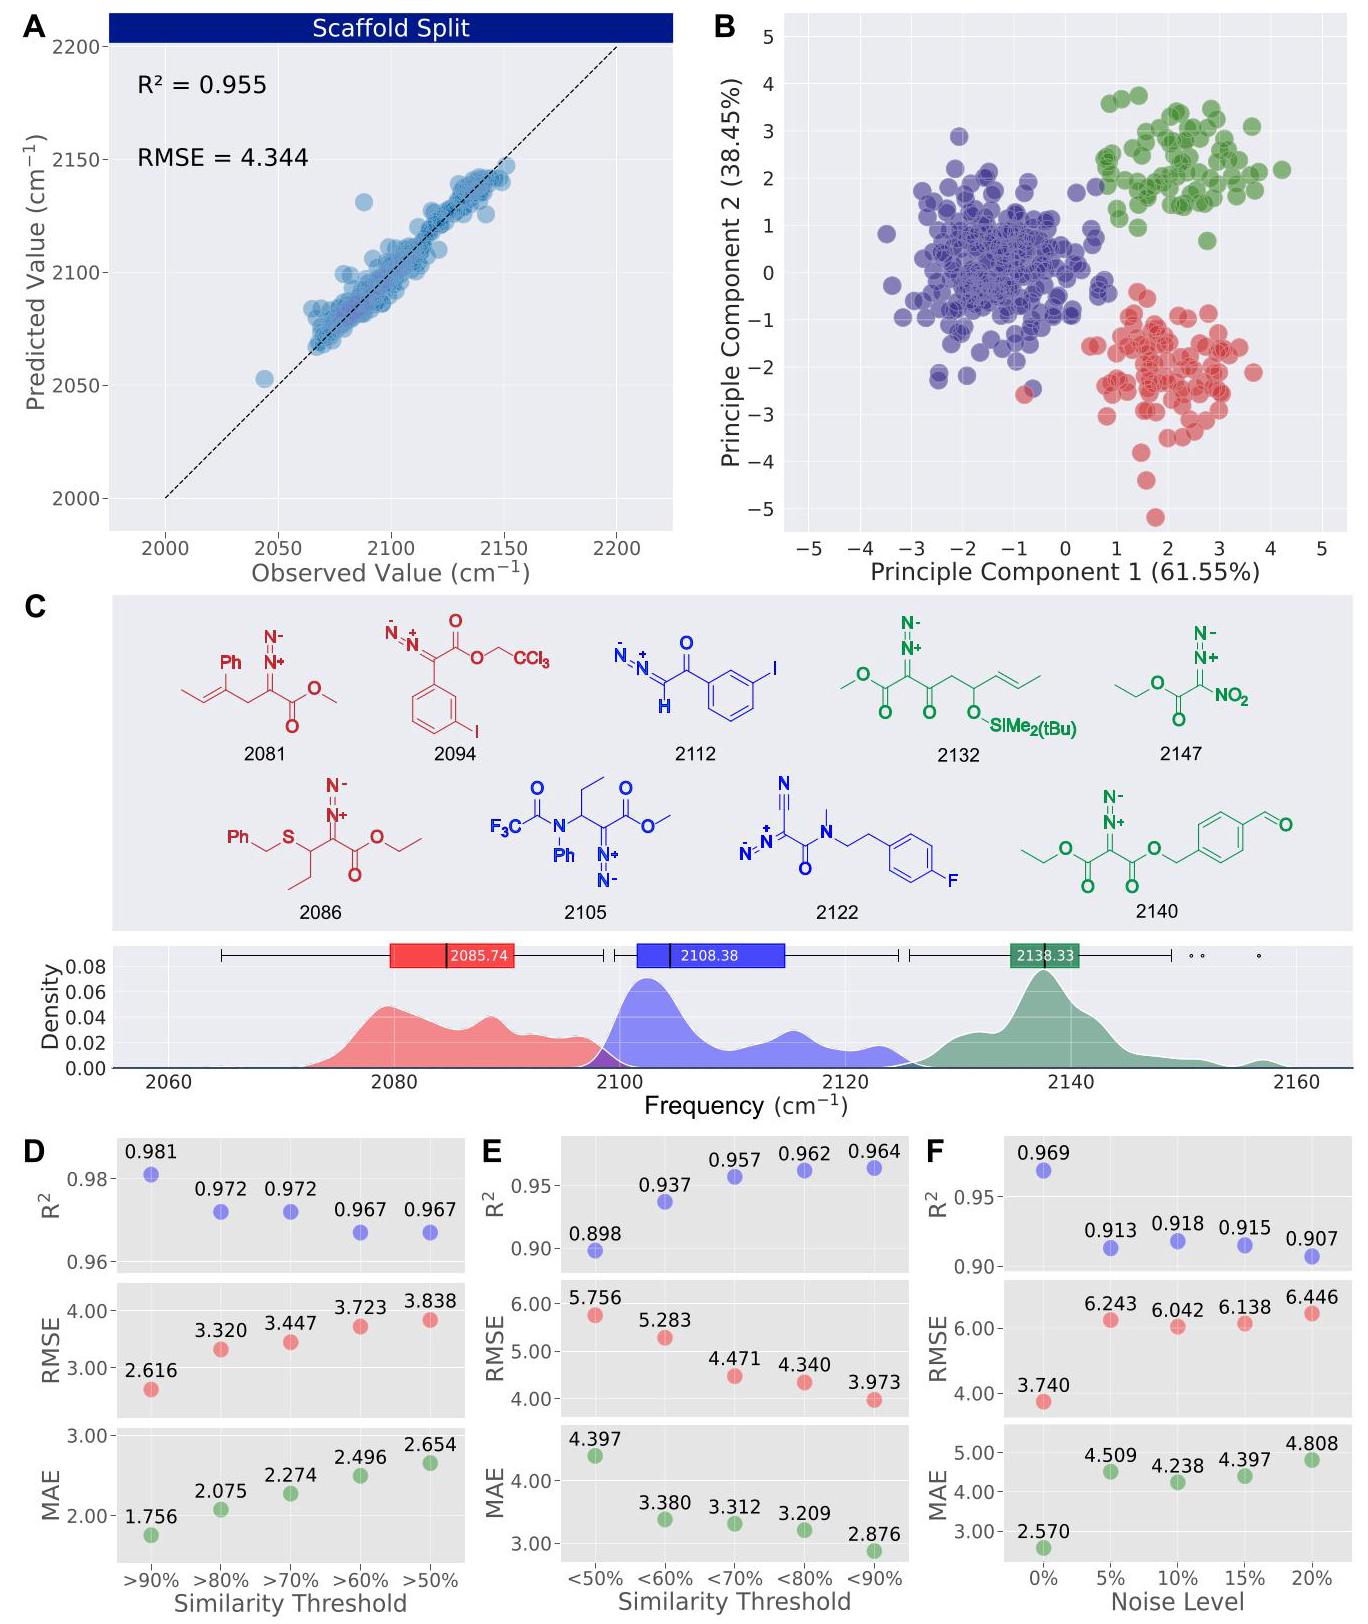
Figure 4. Assessing model robustness and generalization via structural clustering and IR spectroscopy. (A) Performance with scaffold-based data splitting. (B) DBSCAN clustering with $\epsilon = {0.001}$ and minPts $= {50}$ ; clusters visualized by PCA (green, blue, red). (C) Density distribution of IR absorption values categorized into high (green), medium (blue), and low (red) frequency regions, accompanied by random molecular examples for each frequency range. (D) Model performance across high similarity thresholds (>50% to >90%). (E) Model performance across lower similarity thresholds (<90% to <50%). (F) Sensitivity to artificial noise levels (0% to 20%).
Model Construction and Performance Evaluation. In this study, the Characteristic Infrared Absorption Frequency of the Diazo group (CLAD) data set was partitioned into a training set comprising 75% of the data and a test set comprising the remaining 25%, utilizing a random allocation method. The predictive performance of the models was rigorously evaluated through cross-validation, followed by evaluation on the test set. This study presents a comprehensive assessment of several leading machine learning algorithms, including Random Forest (RF), LightGBM (LGB), XGBoost (XGB), Bayesian Ridge Regression (BRR), Gradient Boosting (GB), and CatBoost (CB). Two key performance metrics, the coefficient of determination $\left( {R}^{2}\right)$ and the root-mean-square error (RMSE), are employed to assess the accuracy and efficiency of the derived models. These metrics provide a comprehensive evaluation of the models’ predictive accuracy and their capacity to generalize to unseen data. The quantitative mathematical formulas are as follows:
$$ {R}^{2} = 1 - \frac{\mathop{\sum }\limits_{{i = 1}}^{n}{\left( {y}_{i} - {\widehat{y}}_{i}\right) }^{2}}{\mathop{\sum }\limits_{{i = 1}}^{n}{\left( {y}_{i} - \bar{y}\right) }^{2}} \tag{19} $$$$ \text{ RMSE } = \sqrt{\frac{1}{n}\mathop{\sum }\limits_{{i = 1}}^{n}{\left( {y}_{i} - {\widehat{y}}_{i}\right) }^{2}} \tag{20} $$where ${y}_{i}$ represents the observed values, ${\widehat{y}}_{i}$ denotes the predicted values, $\bar{y}$ is the mean of the observed values, and $n$ is the number of observations. The study found that decision tree-based algorithms, specifically RF, LGB, XGB, and CB, had superior predictive abilities with ${R}^{2}$ scores exceeding 0.95 (Figure 3A). Exclusively depending on Morgan fingerprints (MorganFP), derived from 2-dimensional structural data, led to a notable decline in predictive performance, as elaborated in Figure S3. These observations underscore the efficacy of the structure neighboring mechanism (SNM) in feature extraction, particularly in encapsulating essential chemical descriptors crucial for elucidating the spectral absorption characteristics of molecular moieties.
To enhance the predictive accuracy of our model, we employed ensemble learning methods, leading to the creation of a robust ensemble model. This model integrates the strengths of various machine learning algorithms through a superposition approach in ensemble learning. Specifically, we used multiple regression models-Random Forest (RF), Gradient Boosting (GB), CatBoost (CB), LightGBM (LGB), and XGBoost (XGB)-as the base models, and Bayesian Ridge regression as the meta-model. This approach mitigates overfitting through regularization, enhancing overall prediction accuracy and robustness. Figure S4 and Table S2 present an ablation study examining the influence of each base model on the ensemble model. The ensemble model achieved a high test ${R}^{2}$ score of 0.969 and an RMSE of 3.740 (Figure 3B). This marked performance improvement over individual models underscores the complex and nonlinear nature of the descriptors employed to predict peaks in the signature groups of the infrared spectrum.
Further exploration into the interplay between model predictive capacity and input data involved using varying quantities of compounds for training while maintaining a constant test set. The learning curve of the ensemble model indicated a correlation between increased training data volume and improved performance (Figure 3C). Notably, with a data volume of 25% (456 diazo compounds), the ${R}^{2}$ score attained 0.90. This suggests a significant physical correlation between the compounds’ structures and properties and their infrared absorption characteristics. The proposed ensemble model, leveraging a structure neighboring mechanism (SNM), demonstrates its capacity to learn effectively with as few as 456 compounds, thereby predicting infrared characteristic absorption values with considerable accuracy.
Model Robustness and Generalization Analysis. To assess the generalizability of our model, we employed scaffold-based data splitting using the Murcko method ${}^{17}$ implemented in RDKit. This approach involves grouping molecules with similar core structures together, while those with significant structural differences are placed in distinct groups. The method automatically identified 293 groups of molecular scaffolds, allocating 75% to the training set and 25% to the test set. Notably, the model demonstrated robust performance under these stringent conditions, maintaining an ${R}^{2}$ value above 0.955 (Figure 4A).
To assess the efficacy of our proposed descriptors in differentiating molecular types, we employed unsupervised DBSCAN ${}^{18}$ (Density-Based Spatial Clustering of Applications with Noise) clustering analysis. DBSCAN identifies clusters by looking for regions of high point density. The core principle of DBSCAN can be quantitatively described as follows:
$$ \text{ DBSCAN }\left( {\epsilon ,\text{ minPts }}\right) $$$$ = \{ p \in D \mid \text{ density }\left( p\right) $$$$ \geq \operatorname{minPts}\} \cup \left\{ {q \in D\mid \exists p\text{ s.t. }q \in {N}_{\epsilon }\left( p\right) }\right\} \tag{21} $$where $\epsilon$ (eps) is the maximum distance between two points to be considered neighbors, and minPts $\left( \mathop{\min }\limits_{\text{ samples }}\right)$ is the minimum number of points required to form a dense region.
The data are segmented into three distinct categories (Figure 4B). The examination of the infrared (IR) spectra revealed distinct absorption values corresponding to high (mean ${2138.3}{\mathrm{\;{cm}}}^{-1}$ ), medium (mean ${2108.4}{\mathrm{\;{cm}}}^{-1}$ ), and low (mean ${2085.7}{\mathrm{\;{cm}}}^{-1}$ ) frequencies (Figure 4C). These classifications exhibit clear characteristics attributable to the unique structural features of different compounds that influence their IR absorption properties. High-frequency regions are typically associated with electron-withdrawing substituents, such as nitro or carbonyl groups. Conversely, medium and low frequencies correlate with electron-donating substituents, including conjugation groups or alkyl groups. As a result, our clustering analysis successfully delineated distinct groups based on their structural features and IR absorption characteristics observed postclustering. Furthermore, the descriptor SNMDs can effectively differentiate the influence of various structures on the infrared absorption of target groups.
In the domain of predictive analytics, it is essential to verify the robustness of a model when subjected to varied operational conditions. Prior investigations, inclusive of our own scholarly contributions, have empirically demonstrated that the performance of machine learning (ML) models is primarily contingent upon the congruence between the data sets employed during their training set and those applied in their predictive applications. ${}^{19}$ This particular study concentrates on employing ML models to prognosticate the characteristic infrared absorption frequencies of diazo functional groups, taking into account the chemical configuration of neighboring groups. Remarkably, this methodology facilitates the forecasting of previously unrecorded infrared spectral data. Accordingly, we have assessed the generalization potential of this model across a spectrum of diazo compounds that display varying extents of structural homogeneity.
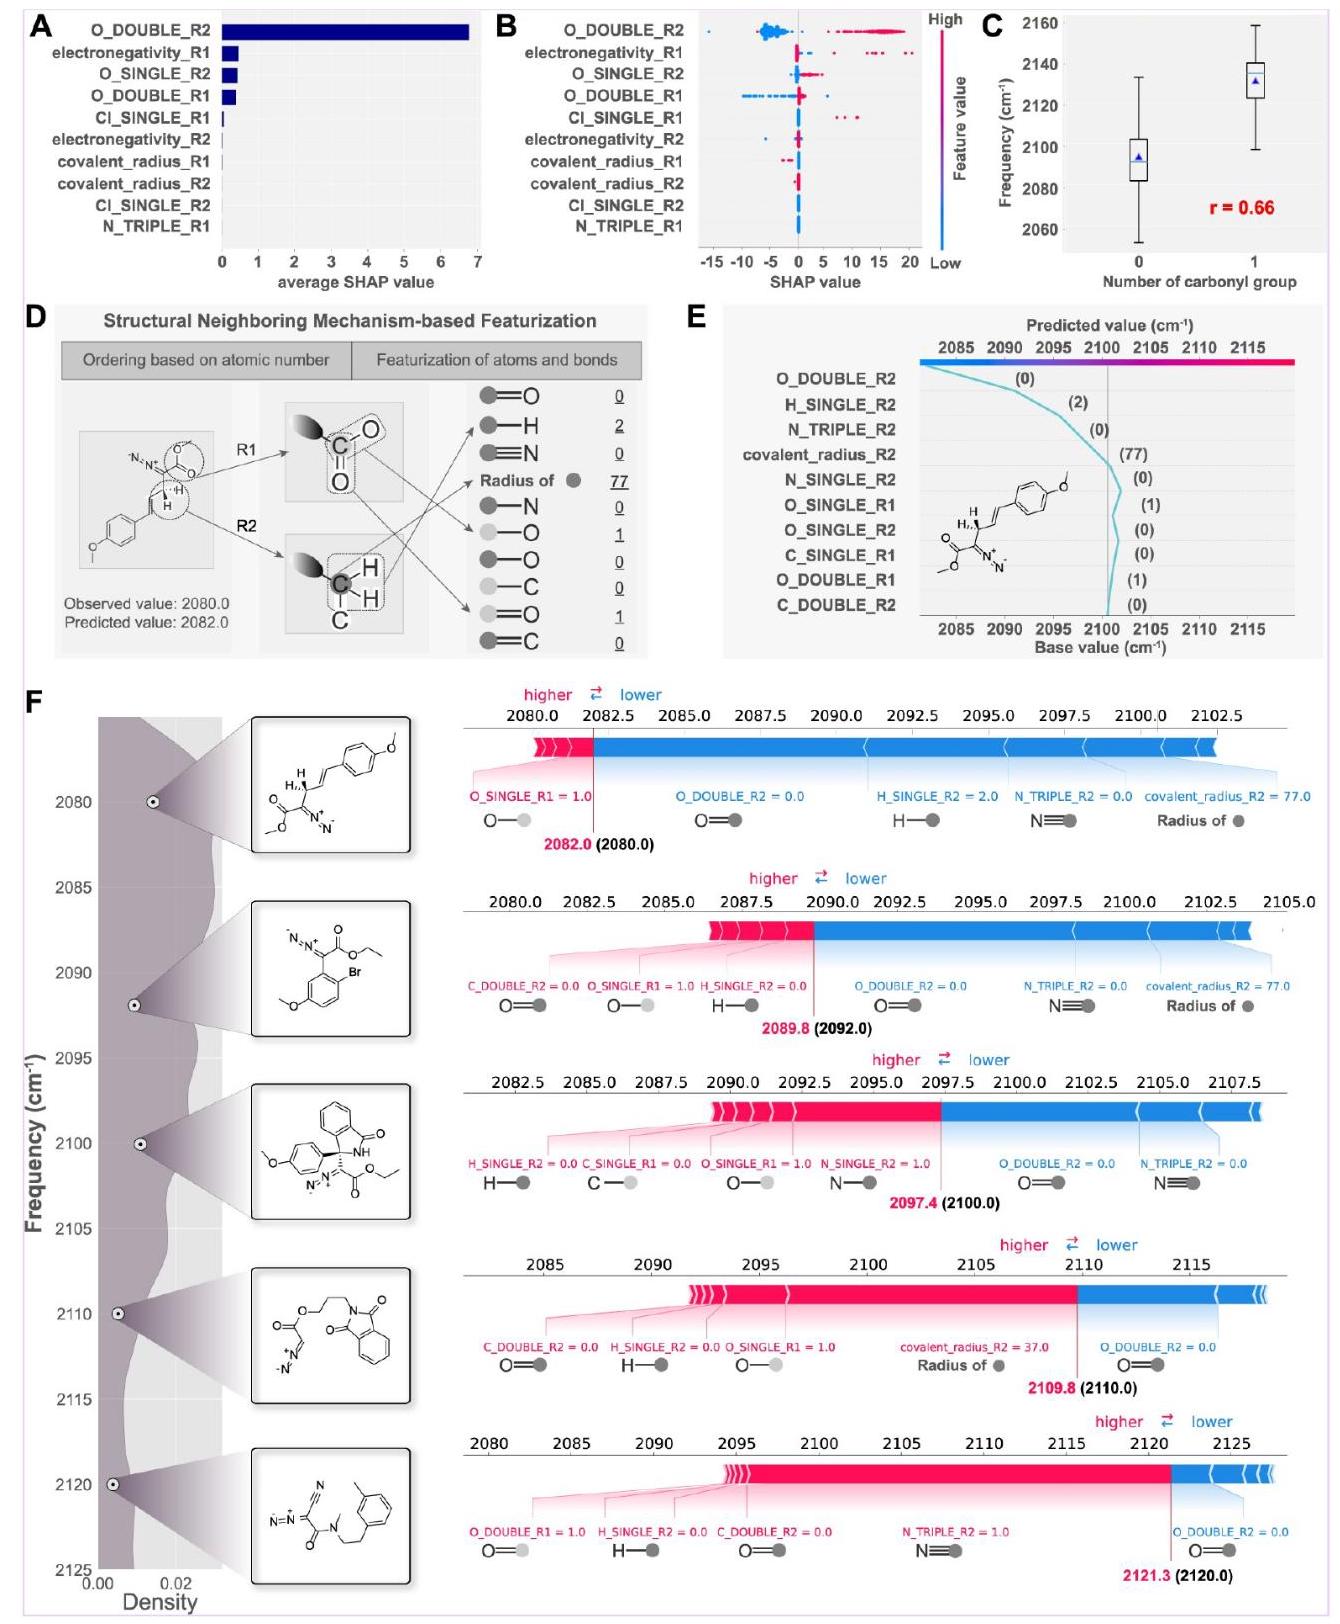
Figure 5. Comprehensive analysis of feature contributions and predictive mechanisms in infrared spectrum modeling of diazo compounds. (A) analysis of feature significance utilizing mean SHAP values. (B) distribution spectrum of characteristics as inferred from SHAP values. (C) boxplot showing the relationship between the number of carbonyl groups and infrared spectral data, indicating a strong Pearson correlation. coefficient of 0.66. (D) a comprehensive depiction of the feature extraction procedure leveraging the structural neighboring mechanism, which details the encoding of atomic and bond information for model input. (E) elaborate visualization of a decision framework, structured as a hierarchical analysis via SHAP values, sequentially unveiling the influence of individual features on projected infrared values. (F) display of molecular structures with their experimental and predicted infrared values, highlighting model efficacy with influences marked in red (higher) and blue (lower).
Our methodology incorporates the use of the Tanimoto coefficient-a measure quantifying the likeness between two-dimensional molecular frameworks, ranging from 0% to 100%. The quantitative mathematical formula of the Tanimoto coefficient is as follows:
$$ T\left( {A, B}\right) = \frac{\left| A \cap B\right| }{\left| A\right| + \left| B\right| - \left| {A \cap B}\right| } \tag{22} $$where $\left| A\right|$ and $\left| B\right|$ represent the cardinality of sets $A$ and $B$ , respectively, and $\left| {A \cap B}\right|$ represents the cardinality of their intersection.
During cross-validation, this coefficient was calculated between each diazo compound in the test set and every compound in the training set. We established a series of similarity thresholds-90%, 80%, 70%, 60%, and 50%-to define varying levels of molecular resemblance. As a result, the data were stratified into five cohorts, each encompassing test set molecules that exhibited at least the defined threshold of similarity with one or more molecules in the training set. The cohorts were composed of the following sizes: ${n}_{90} = {178} \; \left( {{48.5}\% }\right) ,{n}_{80} = {206}\left( {{56.1}\% }\right) ,{n}_{70} = {277}\left( {{75.48}\% }\right) ,{n}_{60} = {318}$ (86.7%), and ${n}_{50} = {357}$ (97.3%), as detailed in Figure S5.
Interestingly, 13.3% of the diazo compounds demonstrated no greater than 60% resemblance to any molecule in the training set. Figure 4D presents the predicted ${R}^{2}$ , RMSE, and Mean Absolute Error (MAE) values for these groups, substantiating a pronounced correlation between molecular similarity and model generalization capability. The quantitative mathematical formula for the MAE is given by
$$ \mathrm{{MAE}} = \frac{1}{n}\mathop{\sum }\limits_{{i = 1}}^{n}\left| {{y}_{i} - {\widehat{y}}_{i}}\right| \tag{23} $$where $n$ is the number of observations, ${y}_{i}$ represents the actual values, and ${\widehat{y}}_{i}$ represents the predicted values. As molecular resemblance diminishes, there is a noticeable decline in predictive accuracy. For compounds with more than 90% similarity, the model exhibited exemplary performance, achieving an ${\mathrm{R}}^{2}$ of 0.981, an RMSE of 2.616, and an MAE of ${1.756}\left( {\mathrm{\;{cm}}}^{-1}\right)$ . Conversely, for those with over ${50}\%$ similarity, the corresponding values were ${0.967}\left( {\mathrm{R}}^{2}\right) ,{3.838}$ (RMSE), and 2.654 (MAE) ${\mathrm{{cm}}}^{-1}$ , respectively. Remarkably, the ${\mathrm{R}}^{2}$ for compounds with less than 50% similarity still attained 0.898, as depicted in Figure 4E. The Supporting Information provides detailed comparisons of the ten test molecules with the lowest molecular similarity to the training set, alongside their predicted errors relative to experimental values, as detailed in Figures S6 and S7.
Moreover, the efficacy of the model is often conditional on the quality of the data, with noise being a significant determinant. Noise can originate from measurement discrepancies, data handling errors, or external environmental variations. To elucidate the predictive capabilities of our proposed ensemble model, we explored the impact of varying data volumes and noise levels. The performance was evaluated by introducing assorted degrees of random noise into the input data, spanning from 0% (no noise) to 20%, in 5% increments. For each level of noise, the model’s predictive ${\mathrm{R}}^{2}$ , RMSE, and MAE were computed, with multiple iterations conducted to ensure the reliability of results. As illustrated in Figure 4F, in a noise-free environment, the model demonstrated exceptional predictive accuracy $\left( {{\mathrm{R}}^{2} = {0.969}}\right)$ . With incrementing noise levels, a gradual decrease in ${\mathrm{R}}^{2}$ was observed. Notably, the model sustained an ${\mathrm{R}}^{2}$ above 0.91 for noise levels up to 15%, evidencing its robustness. Nonetheless, beyond a 10% noise threshold, performance deterioration became more pronounced, yet the model still maintained an ${\mathrm{R}}^{2}$ of 0.907 at 20% noise, underscoring its capability to handle inherent experimental inaccuracies in observational data sets.
Model Decision-Making Process and Interpretability Analysis. The imperative execution of model interpretability analysis serves as a cornerstone for demystifying the foundational logic governing model predictions. Such analysis is traditionally divided into two primary categories: ex-ante analysis and postevent analysis. In the pursuit of enhanced accuracy and minimal errors within the infrared spectrum model, the application of the SHapley Additive exPlanations (SHAP) methodology is paramount for ensuring comprehensibility. ${}^{20}$ As a post hoc interpretative instrument, SHAP distinctively quantifies the contribution of each feature to the model’s output, thus providing a comprehensive and nuanced understanding of the “black box” model at both macroscopic and microscopic levels. The SHAP value for a feature $i$ is calculated as follows:
$$ {\phi }_{i} = \mathop{\sum }\limits_{{S \subseteq N\smallsetminus \{ i\} }}\frac{\left| S\right| !\left( {\left| N\right| - \left| S\right| - 1}\right) !}{\left| N\right| !}\left\lbrack {v\left( {S\cup \{ i\} }\right) - v\left( S\right) }\right\rbrack $$(24)
where:
${\phi }_{i}$ is the SHAP value for feature $i$ .
$N$ is the set of all features.
$S$ is a subset of features not including feature $i$ .
$v\left( S\right)$ is the value function that maps subsets of features to the model prediction.
Feature importance analysis occupies a pivotal role at the intersection of data science theory and its practical implementations, significantly influencing the development of efficient and interpretable machine learning models. In this study, feature importance was determined based on SHAP values, with the carbonyl descriptor identified as the most significant due to its substantial average SHAP value of 6.8. This starkly contrasts with other descriptors, which all registered values below 1.0 (Figure 5A). An interesting correlation was observed between the number of carbonyl groups and their corresponding frequency; an increase in carbonyl groups (trending toward red) correlated with a higher frequency and vice versa (Figure 5B). Furthermore, the atom bonded to the diazo group exhibited significant influence, with its electronegativity being directly proportional to the frequency. This relationship is further substantiated by a Pearson correlation coefficient of 0.66 between the frequency and carbonyl groups, indicating a robust positive correlation (Figure 5C). Additionally, the tree-based ensemble learning method, specifically XGBoost, was employed for feature importance analysis. Notably, the top four features identified by XGBoost were consistent with those determined by SHAP, underscoring their critical role in model performance. Among the remaining features, seven ranked within the top ten by both methods, albeit in a different order of importance, as detailed in Figure S8. This partial consistency suggests that, while exact rankings may vary, these features collectively contribute significantly to the model’s predictive accuracy.
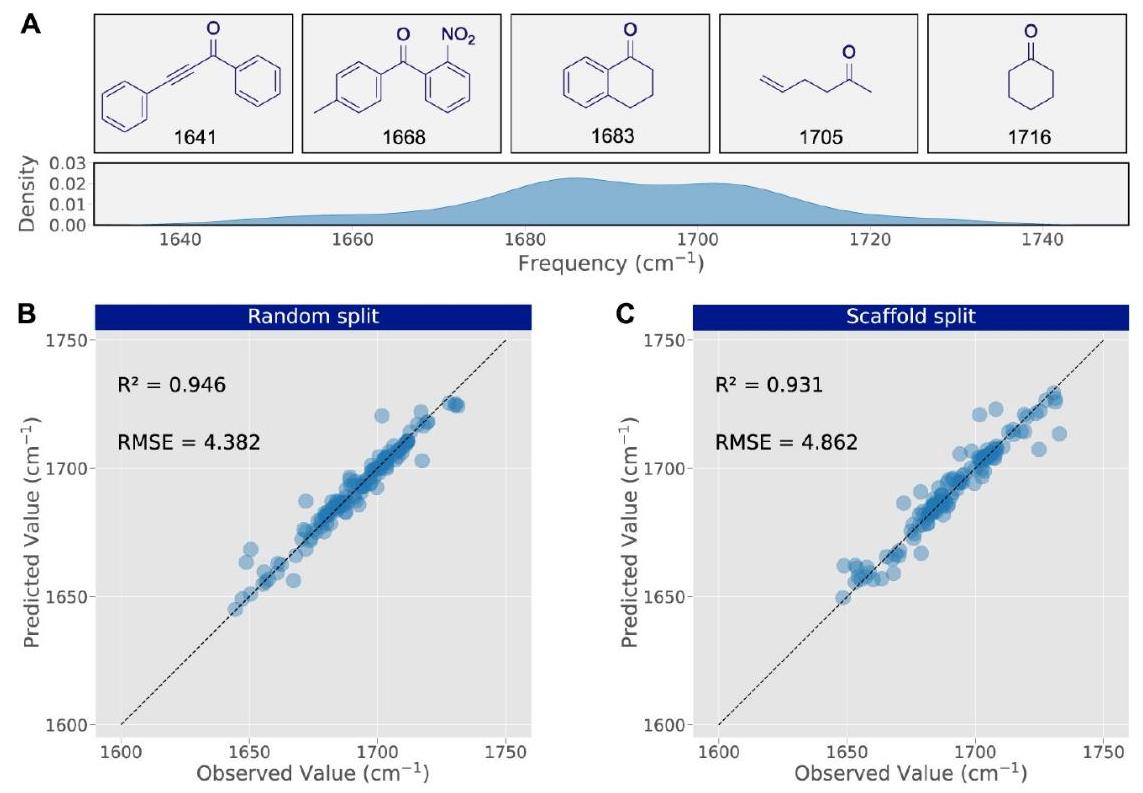
Figure 6. Predictive performance for ketone carbonyl groups. (A) Distribution of infrared absorption frequencies for ketone carbonyl groups and randomly selected molecules across each interval. (B) Performance of the model trained with a random split on the test set. (C) Performance of the model trained with a scaffold split on the test set.
Further examination of specific compounds, such as methyl (E)-2-diazo-5-(4-methoxyphenyl)pent-4-enoate, revealed nuanced feature engineering based on the structural neighboring mechanism. This involved segmentation into two chemical space domains, R1 and R2, based on atomic number size, followed by quantitative characterization according to atom types and chemical bonds (Figure 5D). In the context of model decision-making, the central gray vertical line in the decision diagram represents the model’s baseline value, with colored lines depicting predictions and illustrating the influence of each feature in shifting the output value above or below the average prediction. Eigenvalues adjacent to the prediction line provide a reference. The cumulative impact of SHAP values from the base value to the final predicted wavenumber is depicted at the graph’s apex (Figure 5E), highlighting the top 10 most impactful features.
The absence of a double-bonded oxygen fragment in the R2 domain (O_DOUBLE_R2 = 0) significantly influences model decision-making, decreasing the wavenumber from approximately 2092.1 to ${2082.0}{\mathrm{\;{cm}}}^{-1}$ . This effect is attributed to the electron-withdrawing capability of the carbon-oxygen double-bonded fragment impacting the diazo group. Conversely, the presence of a double-bonded oxygen fragment in the R1 domain (O_DOUBLE_R1 = 1) slightly elevates the wavenumber from the baseline. Moreover, the presence of two single-bond hydrogen fragments (H_SINGLE_R2 = 2) decreases the wavenumber from around 2096.6 to 2092.1 ${\mathrm{{cm}}}^{-1}$ , linked to the moderate electron-donating effect of the carbon-hydrogen single-bond fragment on the diazo group. The absence of a triple-bonded nitrogen fragment (N_TRIPLE R2 = 0) reduces the wavenumber from 2098.4 to 2096.6 ${\mathrm{{cm}}}^{-1}$ , attributed to the electron-withdrawing effect of the carbon-nitrogen triple-bonded fragment on the diazo group. Additionally, the covalent radius of the atom linked to the R2 domain and the diazo group (colvalent_radius_R2 = 77) plays a role; generally, a larger covalent radius indicates a greater electron-donating propensity, and vice versa.
Given the diverse kinds of atoms in the data set (e.g., $\mathrm{H} = {37} \; \mathrm{{pm}},\mathrm{\;B} = {82}\mathrm{{pm}}, N = {75}\mathrm{{pm}},\mathrm{O} = {73}\mathrm{{pm}},\mathrm{{Si}} = {111}\mathrm{{pm}}, p = {106}$ pm, $S = {102}\mathrm{{pm}}$ ), a covalent radius of ${77}\mathrm{{pm}}$ (representing carbon atoms) necessitates a reduction in wavenumber from around 2101.0 to ${2098.4}{\mathrm{\;{cm}}}^{-1}$ . Additionally, the presence of a single bonded oxygen in the R1 domain (O_SINGLE_R1 = 1) increases the wavenumber, whereas its absence in the R2 domain (O_SINGLE_R2 = 0) decreases it. This effect is attributed to the electron-withdrawing impact of the carbon-oxygen single bond on the diazo group. The influence of these features on model decisions is quantifiable through force plots (Figure 5F). This alignment with established chemical principles underscores the model’s reliance on chemical logic and rules. In summation, constructing models with heightened chemical interpretability is not only essential for validating their predictions but also acts as a conduit between machine learning and conventional chemistry. The integration of model insights with established chemical theories not only bolsters the reliability of computational predictions but also deepens the understanding of chemical concepts. This synergy of advanced data-driven methodologies with traditional scientific knowledge heralds a transformative era in chemical research and theoretical exploration.
Versatility and Extension of the Structural Neighboring Mechanism. To validate the broader applicability of our Structural Neighboring Mechanism, we expanded our study to encompass ketone carbonyl groups. Infrared absorption data were acquired from 532 compounds featuring ketone carbonyl groups (Figure 6A), which were then partitioned into a 75% training set and a 25% test set. Employing an ensemble learning approach, we developed a predictive model for the infrared absorption of ketone carbonyl groups. The model exhibited strong performance, achieving an ${R}^{2}$ value of 0.946 and an RMSE of 4.382 on the test set (Figure 6B). Additionally, using the scaffold split method, the model retained an ${R}^{2}$ value of 0.931 and an RMSE of 4.862 (Figure 6C). These results underscore the adaptability and potential of our method beyond diazo functional groups, indicating its broader utility in predicting infrared absorption values for diverse functional groups.
To comprehensively evaluate the performance of the Structural Neighboring Mechanism (SNM) model, which is specifically designed to predict the infrared characteristic absorption values of functional groups, we conducted a comparative analysis with two established end-to-end models: Graphormer-IR, ${}^{21}$ trained on experimental spectral data, and DetaNet, ${}^{22}$ based on DFT-calculated data, both of which provide comprehensive infrared spectrum predictions. Using the same test set data, we replicated both models and analyzed key performance metrics, including root-mean-square error (RMSE) and inference time. As depicted in Figure 7, the SNM model consistently achieves lower RMSE values when predicting the infrared characteristic absorption of the diazo group and ketone carbonyl group, demonstrating superior predictive performance in these targeted predictions. In contrast, Graphormer-IR and DetaNet, while excelling in comprehensive spectral predictions, exhibit higher RMSE values for these specific functional groups. Moreover, the SNM model maintains a more favorable inference time, emphasizing its efficiency and practicality for high-throughput spectral predictions, particularly when focused on functional group analysis.
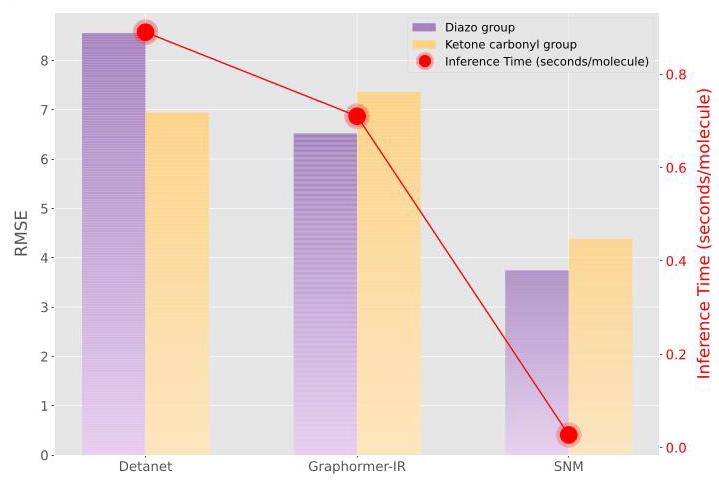
Figure 7. Comparative performance analysis of the SNM model, Graphormer-IR, and DetaNet. The bar chart displays the root-mean-square error (RMSE) for predicting the infrared characteristic absorption values of the diazo group (indigo) and ketone carbonyl group (orange) across each model. The line plot with red markers illustrates the averaged inference time (seconds/molecule), providing insight into the computational efficiency of each approach.
Applicability of Prediction Models. The CIAD data set comprises a range of stable diazo compounds. Within this extensive chemical landscape, a significant fraction of cost-effective diazo compounds exhibit instability, presenting obstacles for direct experimental evaluation and molecular property elucidation. ${}^{{23},{24}}$ To assess the model’s ability to extrapolate, we predicted the infrared spectra of the very unstable yet versatile diazo compounds diazomethane, ${}^{{25} - {27}}$ diazoethane, ${}^{{25},{28},{29}}$ and 2-diazopropane. ${}^{{30} - {32}}$
This assessment required a tripartite analysis, combining theoretical calculations, empirical measurements, and model-based predictions. The infrared spectra based on DFT calculations for the three diazo compounds are presented in Figure S9. Molecular similarity, defined by the highest molecular similarity score within the corresponding data set, ranged from 0.188 to 0.438 , indicating moderate to low structural similarity. As shown in Table 1, theoretical analysis of diazomethane yielded a spectral value of ${2090.2}{\mathrm{\;{cm}}}^{-1}$ , while a precision-guided experimental approach determined a value of 2091.0 ${\mathrm{{cm}}}^{-1}$ . The model, developed within a rigorous analytical framework, estimated the spectral value to be 2087.3 ${\mathrm{{cm}}}^{-1}$ . The proximity of the model’s estimations to values derived through empirical methodologies underscores its predictive accuracy and its capacity to mitigate the challenges associated with the direct analysis of unstable compounds. Furthermore, although the calculated DFT value is slightly closer to the experimental value, the error of our model decreases as molecular similarity improves. In addition, the experiment comparing model and DFT errors based on molecular similarity was conducted. As molecular similarity to the training set increased, the accuracy of the model’s predicted values improved, displaying a clear trend. Conversely, DFT calculations did not exhibit this trend, as detailed in Figure S10. As molecular complexity increases, the efficiency predicted by the model diverges significantly from theoretical calculations. This discrepancy ranges from 3,150 times for diazomethane to 12700 times for diazethane, and up to 26650 times for 2-diazopropane. The concordance observed between the predicted and experimental values underscores that the learning model, engineered through the incorporation of a structural neighboring mechanism, is adept at discerning the interrelations between molecular structure and properties, thereby exhibiting pronounced robustness and generalizability.
The accurate prediction of infrared (IR) absorption spectra for multifunctional groups within complex cyclic structures is crucial in the research of natural products and drug molecules. We have developed an advanced system designed to predict the IR absorption spectra of such intricate structures. This system identifies functional groups and structural fragments in compounds, integrating this chemical information into specialized prediction models for functional group IR absorption. Our system, combined with pretrained prediction models for the IR absorption frequencies of diazo groups and ketone carbonyl groups, demonstrates its efficacy. Table 2 showcases the application of these models on two external compounds, 1-phenylpropane-1,2-dione (compound 2.1) and ethyl 2-diazo-3-(3-diazo-2-oxoindolin-1-yl)-3-oxopropanoate (compound 2.2), each containing two ketone carbonyl groups and diazo groups, respectively. Molecular similarity, defined by the highest molecular similarity score within the corresponding data set, ranged from 0.6 to 0.7 , indicating moderate structural similarity. For compound 2.1, the experimental IR absorption value ${}^{34}$ at ${1673.0}{\mathrm{\;{cm}}}^{-1}$ yielded a model prediction of 1672.7 ${\mathrm{{cm}}}^{-1}$ and a DFT-calculated value of ${1663.8}{\mathrm{\;{cm}}}^{-1}$ . The relative error of the model’s prediction, based on experimental values, is significantly lower compared to the DFT calculation, with a difference exceeding 30-fold. Similarly, for an experimental value of ${1709.0}{\mathrm{\;{cm}}}^{-1}$ , our model predicted ${1706.8}{\mathrm{\;{cm}}}^{-1}$ , while the DFT calculation was ${1714.1}{\mathrm{\;{cm}}}^{-1}$ , showing a more than 2- fold reduction in relative error. For compound 2.2, with an experimental value ${}^{35}$ of ${2105.0}{\mathrm{\;{cm}}}^{-1}$ , our model predicted ${2109.8}{\mathrm{\;{cm}}}^{-1}$ compared to a DFT calculation of ${2090.3}{\mathrm{\;{cm}}}^{-1}$ , reducing the relative error by more than 3-fold. At 2140.0 ${\mathrm{{cm}}}^{-1}$ , our model predicted 2138.1 ${\mathrm{{cm}}}^{-1}$ , while the DFT calculation was ${2193.4}{\mathrm{\;{cm}}}^{-1}$ , again showing an error reduction of over 30-fold. Additionally, the DFT calculation of complex molecular structures is costly and time-consuming. In contrast, our model requires only a fraction of a second to achieve high-precision IR absorption frequency predictions close to the experimental values, improving the DFT calculation efficiency by over 500,000 times.
Table 1. Prediction of Infrared Characteristic Absorption Values of Unstable Diazo Compounds ${}^{a, b, c, d}$
| Entry | Compound ${}^{\left\lbrack \mathrm{a}\right\rbrack }$ | Mol. Wt. [g/mol] | Boiling point [K] | Experimental value $\left\lbrack {\mathrm{{cm}}}^{-1}\right\rbrack$ | Model-predicted value $\left\lbrack \mathrm{b}\right\rbrack \left\lbrack {\mathrm{{cm}}}^{-1}\right\rbrack$ | DFT-calculated value ${}^{\left\lbrack \mathrm{c}\right\rbrack }\left\lbrack {\mathrm{{cm}}}^{-1}\right\rbrack$ | Similarity ${}^{\left\lbrack \mathrm{d}\right\rbrack }$ |
| 1 |  | 42.04 | 250.0 | 2091.0 | 2087.3 | 2090.2 | 0.263 |
| (760 Torr) | (0.02 s) | (63 s) | |||||
| 2 |  | 56.07 | 259.2 | 2063.0 | 2064.0 | 2062.2 | 0.438 |
| (100 Torr) | (0.03 s) | (381 s) | |||||
| 3 |  | 70.09 | 242.0 | 2036.0 | 2044.3 | 2037.6 | 0.188 |
| (14 Torr) | (0.02 s) | (533 s) |
${}^{a}$ Out of CIAD dataset. ${}^{b}$ The ensemble model. ${}^{c}$ The vibrational scaling factor is 0.951 based on B3LYP/def2-TZVP level. ${}^{33}{}^{d}$ The highest molecular similarity to the molecules in the CIAD dataset, where the molecular similarity is calculated by the Tanimoto coefficient.
Table 2. Prediction of Infrared Characteristic Absorption Values of Multi-Functional Groups in Complex Cyclic Structures ${}^{a, b,{cd}}$
| Entry | Compound[a] | Experimental value $\left\lbrack {\mathrm{{cm}}}^{-1}\right\rbrack$ | Model-predicted value ${\left\lbrack {\mathrm{{cm}}}^{-1}\right\rbrack }^{\left\lbrack \mathrm{b}\right\rbrack }$ | DFT-calculated value ${\left\lbrack {\mathrm{{cm}}}^{-1}\right\rbrack }^{\left\lbrack \mathrm{c}\right\rbrack }$ | Similarity ${}^{\left\lbrack \mathrm{d}\right\rbrack }$ |
| 1 |  | ① 1673.0 ② 1709.0 | ① ${1672.7}\left( {{0.02}\% }\right)$ ② ${1706.8}\left( {{0.13}\% }\right)$ $\left( {{0.02}\mathrm{\;s}}\right)$ | ① ${1663.8}\left( {{0.55}\% }\right)$ ② 1714.1 (0.30%) (4181 s) | 0.652 |
| 2 |  | ① 2105.0 ② 2140.0 | ① ${2109.8}\left( {{0.23}\% }\right)$ ② ${2138.8}\left( {{0.08}\% }\right)$ $\left( {{0.03}\mathrm{\;s}}\right)$ | ① 2090.3 (0.70%) ② 2193.4 (2.50%) (16243 s) | 0.673 |
${}^{a}$ Out of dataset. ${}^{b}$ The ensemble model. ${}^{c}$ The vibrational scaling factor is 0.951 based on B3LYP/def2-TZVP level. ${}^{33}{}^{d}$ The highest molecular similarity to the molecules in the corresponding dataset, where the molecular similarity is calculated by the Tanimoto coefficient.
II CONCLUSIONS
In summary, this study demonstrates the efficacy of a machine learning approach with a structural neighboring mechanism- (SNM) for predicting the infrared spectra of diazo groups and ketone carbonyl groups. This method addresses existing limitations in spectral analysis, offering improved accuracy and efficiency. The integration of the structural neighboring mechanism is particularly notable for its enhancement of prediction capabilities, underscoring the potential of machine learning in spectroscopic applications. These findings not only contribute significantly to the field of analytical chemistry but also open avenues for future research, including the model’s adaptation for other complex molecular structures. The broader implications of this research extend to advancing organic synthesis and deepening our understanding of molecular interactions in various chemical contexts.
At present, this study has some limitations that require further refinement in the future. Expanding the model to encompass additional functional groups will necessitate the development of new models, a process that is both data-intensive and computationally demanding. For researchers with constrained resources or limited expertise, these challenges may pose significant barriers, potentially limiting the method’s broader adoption within the analytical chemistry community. Nonetheless, the framework we propose offers distinct advantages in terms of scalability and interpretability. These features not only enhance predictive accuracy but also facilitate more transparent and rapid predictions compared to traditional end-to-end models. As such, it has considerable potential to become a valuable tool in predictive chemistry. With the inclusion of more functional groups, ongoing model refinement, and the enhancement of data resources, we believe this approach could evolve into a critical resource for chemical prediction.
BASSOCIATED CONTENT
Data Availability Statement
The computational models and data sets reported in this work will be made available on GitHub. https://github.com/ ChengchunLiu/IR-DIAZO-KETONE.
(a) Supporting Information
The Supporting Information is available free of charge at https://pubs.acs.org/doi/10.1021/acs.analchem.4c01972.
Details on the construction of the data set (including data extraction and data set composition), experimental settings and training procedures, and additional experimental details (PDF)
AUTHOR INFORMATION
Corresponding Author
Fanyang Mo - School of Materials Science and Engineering, Peking University, Beijing 100871, China; AI for Science (AI4S)-Preferred Program, School of Advanced Materials, and Guangdong Provincial Key Laboratory of Nano-Micro Materials Research, Peking University Shenzhen Graduate School, Shenzhen 518055, China; © orcid.org/0000-0002- 4140-3020;
Authors
Chengchun Liu - School of Materials Science and Engineering, Peking University, Beijing 100871, China; © orcid.org/0009-0002-5550-4145
Ruqiang Zou - School of Materials Science and Engineering, Peking University, Beijing 100871, China; AI for Science (AI4S)-Preferred Program and School of Advanced Materials, Peking University Shenzhen Graduate School, Shenzhen 518055, China; (C) orcid.org/0000-0003-0456- 4615
Complete contact information is available at: https://pubs.acs.org/10.1021/acs.analchem.4c01972
Author Contributions
F.M. and C.L. conceived the project, designed the method, and analyzed the results. C.L. organized and prepared structural data. R.Z. participated in the discussion and gave important suggestions. F.M. and C.L. wrote the paper. F.M. supervised the project.
Notes
The authors declare no competing financial interest.
ACKNOWLEDGMENTS
This work was financially supported by the National Natural Science Foundation of China (Grant Nos. 22071004, 21933001 and 22150013). We thank the High-Performance
Computing Platform of Peking University for machine learning model training.
R REFERENCES
(1) Baiz, C. R.; et al. Chem. Rev. 2020, 120, 7152-7218.
(2) Coates, J. Encyclopedia of Analytical Chemistry; John Wiley & Sons, Ltd, 2006.
(3) Bellamy, L. The infra-red spectra of complex molecules; Springer Science & Business Media, 2013.
(4) Han, R.; Ketkaew, R.; Luber, S. J. Phys. Chem. A 2022, 126, 801- 812.
(5) Kovács, P.; Zhu, X.; Carrete, J.; Madsen, G. K. H.; Wang, Z. ApJ 2020, 902, 100.
(6) Margraf, J. T. Angew. Chem., Int. Ed. 2023, 62 (26), No. e202219170.
(7) Zhang, S.-Q.; Xu, L.-C.; Li, S.-W.; Oliveira, J. C. A.; Li, X.; Ackermann, L.; Hong, X. Chem.-Eur. J. 2023, 29, No. e202202834.
(8) Lin, J.; Mo, F. Artif. Intell. Chem. 2024, 2, 100035.
(9) Gastegger, M.; Behler, J.; Marquetand, P. Chem. Sci. 2017, 8, 6924-6935.
(10) Schütt, K. T.; Kessel, P.; Gastegger, M.; Nicoli, K. A.; Tkatchenko, A.; Müller, K.-R. J. Chem. Theory Comput. 2019, 15, 448-455.
(11) Gastegger, M.; Schütt, K. T.; Müller, K.-R. Chem. Sci. 2021, 12, 11473-11483.
(12) Zhang, Y.; Jiang, B. Nat. Commun. 2023, 14 (1), 6424.
(13) Ye, S.; Zhong, K.; Zhang, J.; Hu, W.; Hirst, J. D.; Zhang, G.; Mukamel, S.; Jiang, J. J. Am. Chem. Soc. 2020, 142, 19071-19077.
(14) Ren, H.; Li, H.; Zhang, Q.; Liang, L.; Guo, W.; Huang, F.; Luo, Y.; Jiang, J. Fundam. Res. 2021, 1, 488-494.
(15) Ng, L. M.; Simmons, R. Anal. Chem 1999, 71, 343-350.
(16) Smith, B. C. Infrared spectral interpretation: A systematic approach; CRC press, 2018.
(17) Bemis, G. W.; Murcko, M. A. J. Med. Chem. 1996, 39, 2887- 2893.
(18) Wang, Y.; Gu, Y.; Shun, J. Theoretically-Efficient and Practical Parallel DBSCAN. Proceedings of the 2020 ACM SIGMOD International Conference on Management of Data; ACM Digital Library: New York, NY, USA, 2020 25552571.
(19) Xu, H.; Lin, J.; Zhang, D.; Mo, F. Nat. Commun. 2023, 14 (1), 3095.
(20) Lundberg, S. M.; Erion, G.; Chen, H.; DeGrave, A.; Prutkin, J. M.; Nair, B.; Katz, R.; Himmelfarb, J.; Bansal, N.; Lee, S.-I. Nat. Mach. Intell. 2020, 2, 56-67.
(21) Stienstra, C. M. K.; Hebert, L.; Thomas, P.; Haack, A.; Guo, J.; Hopkins, W. S. J. Chem. Inf. Model. 2024, 64, 4613-4629.
(22) Zou, Z.; Zhang, Y.; Liang, L.; Wei, M.; Leng, J.; Jiang, J.; Luo, Y.; Hu, W. Nat. Comput. Sci. 2023, 3, 957-964.
(23) Akter, M.; Rupa, K.; Anbarasan, P. Chem. Rev. 2022, 122, 13108-13205.
(24) Dallinger, D.; Gutmann, B.; Kappe, C. O. Acc. Chem. Res. 2020, 53, 1330-1341.
(25) Hodgson, D. M.; Le Strat, F.; Avery, T. D.; Donohue, A. C.; Brückl, T. J. Org. Chem. 2004, 69, 8796-8803.
(26) Dallinger, D.; Pinho, V. D.; Gutmann, B.; Kappe, C. O. J. Org. Chem. 2016, 81, 5814-5823.
(27) Hatakeyama, S.; Bandow, H.; Okuda, M.; Akimoto, H. J. Phys. Chem. 1981, 85, 2249-2254.
(28) Deem, M. W.; Newsam, J. M. J. Am. Chem. Soc. 1992, 114, 7189-7198.
(29) White, E. H.; Aufdermarsh, C. A. J. J. Am. Chem. Soc. 1961, 83, 1174-1178.
(30) Staudinger, H.; Gaule, A. Ber. Dtsch. Chem. Ges. 1916, 49, 1897-1918.
(31) Pezacki, J. P.; Wood, P. D.; Gadosy, T. A.; Lusztyk, J.; Warkentin, J. J. Am. Chem. Soc. 1998, 120, 8681-8691.
(32) Pezacki, J. P.; Wagner, B. D.; Lew, C. S. Q.; Warkentin, J.; Lusztyk, J. J. Am. Chem. Soc. 1997, 119, 1789-1790.
(33) Alecu, I. M.; Zheng, J.; Zhao, Y.; Truhlar, D. G. J. Chem. Theory Comput. 2010, 6, 2872-2887.
(34) Arava, S.; Santra, S. K.; Pathe, G. K.; Kapanaiah, R.; Szpilman, A. M. Angew. Chem., Int. Ed. 2020, 59, 15171-15175.
(35) Li, H.; Bonderoff, S. A.; Cheng, B.; Padwa, A. J. Org. Chem. 2014, 79, 392-400.

CAS BIOFINDER DISCOVERY PLATFORMTM
STOP DIGGING THROUGH DATA -START MAKING DISCOVERIES
CAS BioFinder helps you find the right biological insights in seconds
Start your search