High-throughput discovery of chemical structure-polarity relationships combining automation and machine learning techniques
中文 / Bilingual · English version
Article
High-throughput discovery of chemical structure-polarity relationships combining automation and machine-learning techniques
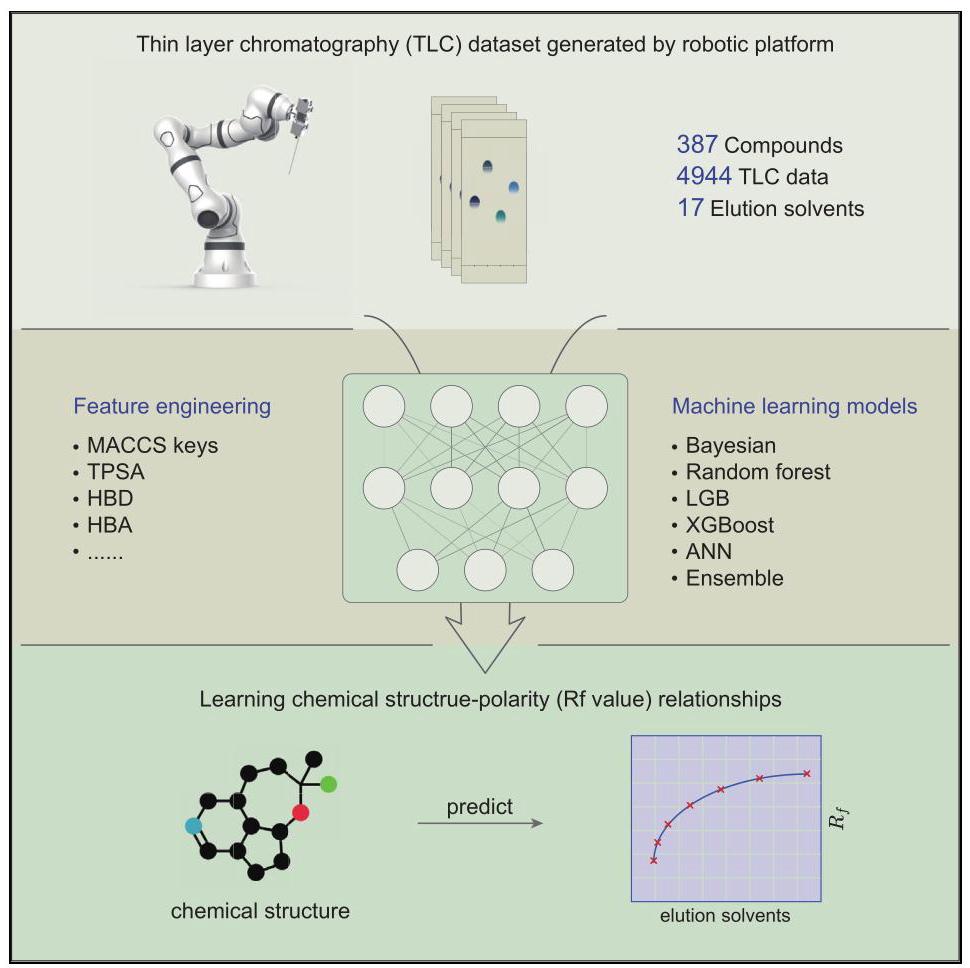
We invented a robotic experimentation platform and supporting software for standardized TLC data collection. An effective prediction model is constructed to predict ${R}_{f}$ curves, discover chemical structure-polarity relationships, and facilitate chromatographic separation. The effective prediction model, based on automated data collection, confirms that combining machine-learning methods with automation is a promising way to improve data fidelity and enhance laboratory efficiency.
Hao Xu, Jinglong Lin, Qianyi Liu, …, Yan Xu, Dongxiao Zhang, Fanyang Mo
(D.Z.)
(D.Z.)
(F.M.)
(F.M.)
Highlights
An automated platform is invented to conduct high-throughput TLC analysis
4,944 standardized ${R}_{f}$ values from 387 compounds under 17 solvent conditions
A machine-learning model facilitates ${R}_{f}$ prediction and chromatographic separation
Higher topological polar surface area (TPSA) contributes to smaller ${R}_{f}$ values
Xu et al., Chem 8, 3202-3214
December 8, 2022 © 2022 Elsevier Inc.
https://doi.org/10.1016/j.chempr.2022.08.008
Article
High-throughput discovery of chemical structure-polarity relationships combining automation and machine-learning techniques
Hao Xu, ${}^{1,2,9}$ Jinglong Lin, ${}^{1,9}$ Qianyi Liu, ${}^{1}$ Yuntian Chen, ${}^{3}$ Jianning Zhang, ${}^{1}$ Yang Yang, ${}^{4}$ Michael C. Young, ${}^{5}$ Yan Xu, ${}^{6}$ Dongxiao Zhang, ${}^{7,8, \star }$ and Fanyang Mo ${}^{1,{10}, \star }$
SUMMARY
As an essential attribute of organic compounds, polarity has a profound influence on many molecular properties. Thin-layer chromatography (TLC) represents a commonly used technique for empirical polarity estimations. Current TLC techniques need repetitive attempts to obtain suitable development conditions and have low reproducibility due to a low degree of standardization. Herein, we describe an automated system to conduct TLC analysis automatically, facilitating high-throughput collection of a large quantity of experimental data under standardized conditions. Using this dataset, machine-learning (ML) methods are employed to construct surrogate models correlating organic compound structures and their polarity reflected by retardation factor $\left( {R}_{f}\right)$ . The trained ML models are able to predict the ${R}_{f}$ value curve of organic compounds in different solvent combinations with high accuracy, thus providing general guidelines for the selection of purification conditions and expediting the generation and analysis of quality TLC data.
INTRODUCTION
Thin-layer chromatography (TLC) is a commonly used technique in modern chemistry and biology laboratories. As a key chromatography technique, the employment of a solid stationary phase and a liquid mobile phase allows for the separation of individual components of a complex mixture on the basis of their relative affinities for the two phases (Figure 1A). ${}^{1}$ TLC analysis is currently used routinely for reaction monitoring, product identification, and determination of chromatography conditions for subsequent purification. Even though highly experienced synthetic practitioners are able to use this tool, TLC techniques often present a hurdle for scientists in synthesis-adjacent fields. Furthermore, the identification of TLC conditions for new compound classes requires the judicious selection of several variables, most notably the mobile phases and their ratios, to achieve optimal separation. Traditionally, such goals are accomplished through trial-and-error in a time-consuming and labor-intensive manner.
In recent years, cutting-edge techniques in artificial intelligence (AI) have revolutionized the extrapolation of structure-property relationships in chemical sciences. ${}^{2}$ In particular, machine-learning (ML) algorithms are able to solve complex chemical problems with respect to prediction, surrogate model construction, and constitutive relationship discovery. ${}^{3 - 6}$ Although the chemical structure-retardation factor relationship in TLC has been studied using linear or random forest (RF) ML models, ${}^{7,8}$ the manually acquired TLC data are scant in both quantity and standardization, resulting in limited application and low accuracy $\left( {{R}^{2} < {0.7}}\right)$ . We envision that the development and implementation of an automated platform will significantly speed up data acquisition and generate sufficiently standardized data for further ML research.
THE BIGGER PICTURE
Optimizing chemical experiments is labor intensive, time consuming, and frequently influenced by many factors that make it difficult to collect sufficiently standardized experimental data for machine-learning models. Focusing on the essential technique of thin-layer chromatography (TLC) analysis, we present a successful combination of machine-learning (ML) methods and automation to enhance laboratory efficiency. The effective prediction model aids chromatographic separation by providing optimal elution conditions and, at the same time, deepens our understanding of the underlying chemical structure-polarity relationships. We anticipate that this work will bring forth the broader implementation of automated platforms for repetitive chemical experiments, enabling researchers to focus on thinking and innovating, which will accelerate scientific discovery and further the development of industry and technology.
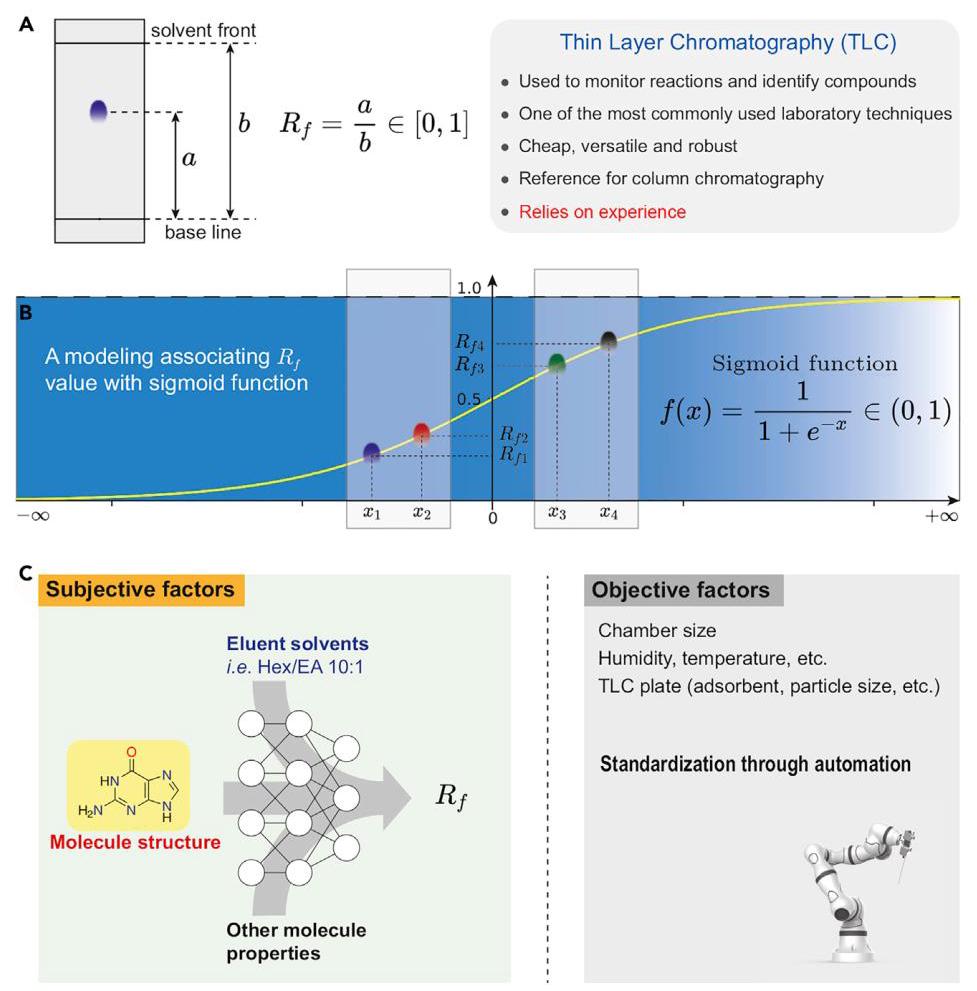
Figure 1. Context of the work
(A) Thin-layer chromatography (TLC) is a chromatography technique used to separate non-volatile mixtures. Synthetic laboratories heavily use TLC techniques to monitor reactions and identify compounds daily. Choosing suitable TLC conditions is usually time-consuming for novices or for new compounds. The retardation factor $\left( {R}_{f}\right)$ is the fraction of an analyte in the mobile phase of a chromatographic system. It is defined as the ratio of the distance traveled by the center of a spot to the distance traveled by the solvent front.
(B) A sigmoid function is a mathematical function having a characteristic “S”-shaped curve, and it has domain of all real numbers with a return value in the range 0-1 . Considering that the ${R}_{f}$ value also has the same value range, we deliberately associate it with the sigmoid function.
(C) The subjective and objective factors of compound ${R}_{f}$ value measurement. The subjective factors include the compound’s structure and other physical properties, as well as elution solvents. The information can be mapped to a vector space via feature engineering and then can be fed to ML algorithms. Other factors like chamber size, humidity, etc., can also affect the measurement. The inuence of these objective factors should be eliminated as much as possible to avoid their impact on model training.
Essentially, the task of prediction is to establish a certain mathematical model that maps between input and output. We noted that the sigmoid function, a common activation function in neural network algorithms, is tightly bound to the pair of horizontal asymptotes and highly useful in compressing or squashing outputs within a 0-1 range. The output of TLC, ${R}_{f}$ , is also a value between 0 and 1 . Thus, we
${}^{1}$ School of Materials Science and Engineering, Peking University, Beijing 100871, China
${}^{2}$ BIC-ESAT, ERE, and SKLTCS, College of Engineering, Peking University, Beijing 100871, China
${}^{3}$ Eastern Institute for Advanced Study, Yongriver Institute of Technology, Ningbo 315200, China
${}^{4}$ Department of Chemistry and Biochemistry, University of California, Santa Barbara, Santa Barbara, CA 93106, USA
${}^{5}$ Department of Chemistry & Biochemistry, School of Green Chemistry & Engineering, The University of Toledo, 2801 W. Bancroft St., Toledo, OH 43606, USA
6Chemistry Service Unit, WuXi AppTec Co., Ltd., Shanghai 200131, China
${}^{7}$ Department of Mathematics and Theories, Peng Cheng Laboratory, Shenzhen 518000, China
${}^{8}$ National Center for Applied Mathematics Shenzhen (NCAMS), Southern University of Science and Technology, Shenzhen 518000, China
9These authors contributed equally
10Lead contact
*Correspondence: (D.Z.), (F.M.)
https://doi.org/10.1016/j.chempr.2022.08.008 envisioned that the ${R}_{f}$ values could be reasonably fitted using a sigmoid function (Figure 1B). In this case, all the factors that have an influence on the ${R}_{f}$ value will be selected, and subject to a matrix operation through certain input forms to determine an $x$ , and the output, the ${R}_{f}$ value, will be the sigmoid function value of the $x$ . Additionally, in a reverse perspective, through such a transformative operation, the original range of 0-1 is extended to the entire real number domain. In other words, we can predict the ${R}_{f}$ value by regression in a larger range to improve the accuracy of the model (vide infra). Meanwhile, we also put forward a mathematical model of adsorption equilibria on the surface of silica gel and prove that the ${R}_{f}$ value is a sigmoid function of the change in Gibbs free energy for the competitive adsorption reaction, which provides a physical explanation for the utilization of sigmoid function. The detailed derivation process is provided in the supplemental information.
ML methods capture underlying patterns from a large amount of training data to make predictions. The availability of large, high-quality datasets is a prerequisite for ML methods. As illustrated in Figure 1C, the accuracy and reproducibility of the TLC analysis can be affected by many factors, including the chamber size, operation time, temperature, and the TLC plates used in the experiment, which often lead to inconsistent data and impede the development of predictive ML models. Generating a sufficient amount of highly standardized data through conventional means is tedious and time-consuming. To address this challenge, we sought to exploit automated instrumentation to accelerate and standardize the measurement of the ${R}_{f}$ values of organic compounds in TLC analysis. Furthermore, we use these data for ML model training to correlate compound structures and their ${R}_{f}$ values (Figure 1C).
RESULTS
Data acquisition
The automation of chemical experimentation has been an expanding field in the last decade. ${}^{9 - {11}}$ These automated platforms enable standardization and enhance reproducibility while reducing experimental costs. Most importantly, automation allows for the generation of large, high-quality datasets for further statistical analysis. ${}^{12}$ The research paradigm combining automation and ML techniques has already been successfully applied to chemical sciences in various scenarios ranging from reaction condition optimization to mechanism interpretation. ${}^{{13} - {18}}$
We realized that the most effective strategy would be to develop an automated robotic platform to collect the necessary TLC data. However, TLC analysis requires several experimental steps, including dissolving the analyte, spotting the analyte, developing the TLC plate, and ultimately measuring and calculating the ${R}_{f}$ value for each analyte, thus demanding sophisticated automation.
To address the challenges mentioned above, we built a custom desktop robot system for high-throughput collection of TLC data. Our robotic platform is shown in Figure 2. Two collaborative robots are the core of this system, which are able to accomplish complex actions like human arms with high precision and safety. The system also comprises two cameras, two lights, a router, and a laptop (Figures 2A and S2-S4). The smaller robot, DOBOT MG400, is responsible for drawing TLC samples on the sample tray (Figure 2B) and then spotting samples onto the TLC plates (Figure 2C). Subsequently, the bigger robot, AUBO i5, is responsible for gripping the TLC plate and then putting it into the chamber for development (Figures 2D and
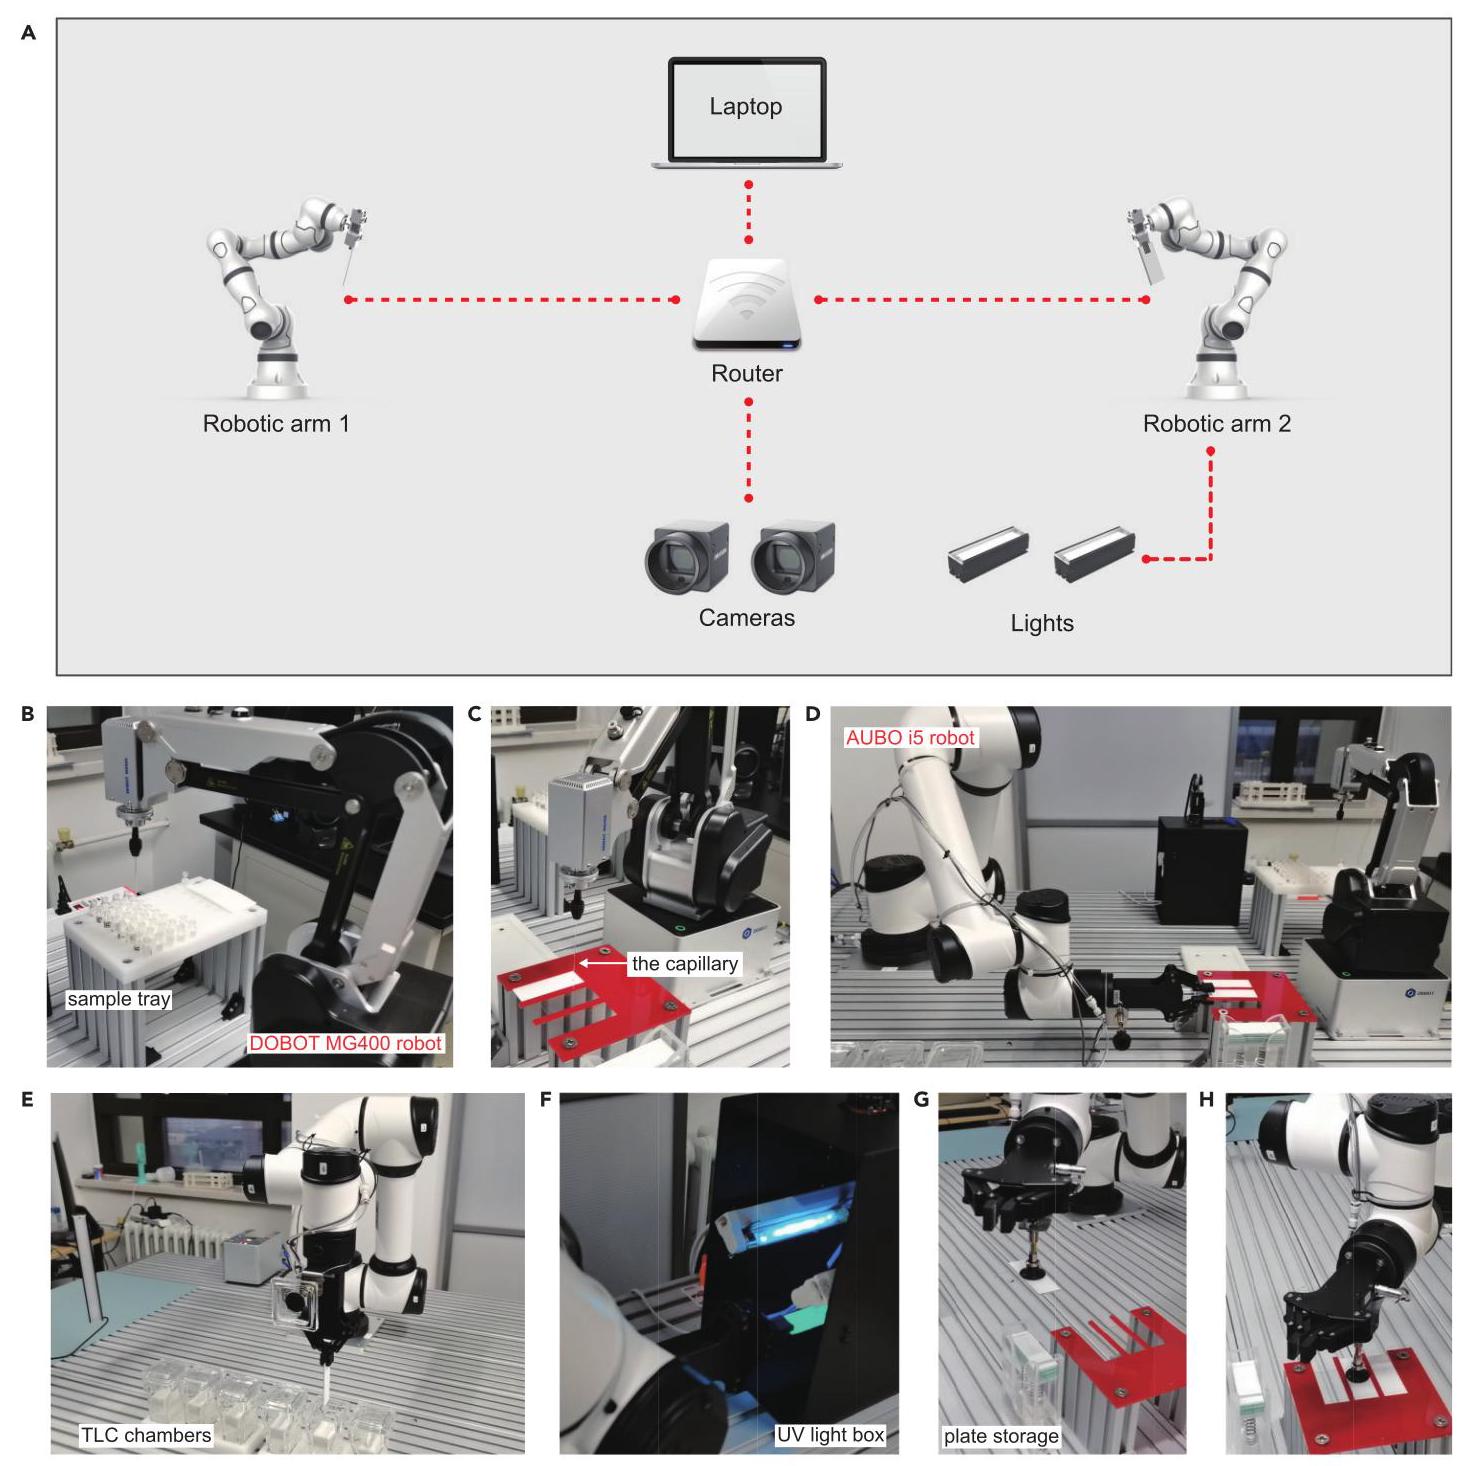
Figure 2. Automated thin-layer chromatography robots and experimental station
(A) Schematic of the automated robotic platform for TLC data collection.
(B) The DOBOT MG400 robot equipped with a capillary is drawing TLC samples on the sample tray.
(C) The DOBOT MG400 robot is spotting samples onto the TLC plates.
(D) The AUBO i5 robot is gripping a TLC plate prior to moving.
(E) The AUBO i5 robot is putting a TLC plate into TLC chamber (or retrieving a plate from the chamber).
(F) After developing, the AUBO i5 robot is taking the TLC plate to a UV light box to visualize and photograph.
(G) The AUBO i5 robot is retrieving a plate from storage.
(H) The AUBO i5 robot is placing a pristine TLC plate onto the stand.
2E). Upon completion, the TLC plate is transferred to a box for visualizing and photographing under UV light (Figure 2F). Finally, the AUBO i5 will retrieve a pristine plate from storage and place it onto the stand for regenerating the system for the next usage (Figures 2G and 2H). In order to increase throughput and efficiency, six chambers are placed on the platform with different elution solvents in each. A Python program is built to control the robots, cameras, and lights, thus managing the whole workflow. Through this robotic TLC experiment platform, high-throughput standardized measurements of the ${R}_{f}$ values are achieved.
After the data collection is completed by the automated TLC system, the ${R}_{f}$ values can be automatically calculated by an image analysis computer program, leading to highly standardized TLC runs. For UV-inactive compounds, other visualization methods can be adopted, which is detailed in the supplemental information. In a typical task, the ${R}_{f}$ values of each compound under different elution solvent ratios are plotted, which helps chemists find outliers based on intuition and experience. Through this method, a high-quality dataset of compound ${R}_{f}$ values is established, containing 4,944 standardized measurements of the ${R}_{f}$ values from 387 organic compounds (Figure 3A) under three mobile phase systems, including hexane/ethyl acetate, dichloromethane/methanol, and hexane/diethyl ether, with a total of 17 different solvent compositions. The distribution of ${R}_{f}$ values for each mobile phase combination is displayed in Figure 3B. All of these experiments were conducted once to construct the dataset. These commonly encountered compounds are collected based on their chemical class to achieve better representation. This standard dataset of ${R}_{f}$ values, generated for the first time, is very valuable since the ${R}_{f}$ values are usually sensitive to external factors in the experiments, which means that statistically meaningful data can only be obtained through automated high-throughput standardized experiments.
Machine-learning model for ${R}_{f}$ value prediction
Before constructing the ML model, we first turn to selecting suitable molecular descriptors to represent the compounds in the dataset. In terms of mechanism, the ${R}_{f}$ value reflects molecular polarity, which is a reflection of a compound’s polar bonds and their spatial distribution, and is therefore essentially a reflection of a compound’s structure. In addition, TLC is based on the principle of separation through adsorption type. For this reason, the ${R}_{f}$ value is correlated with the properties that affect the molecular adsorption between stationary phase and mobile phase, for example, hydrogen bonding and topological polar surface area (TPSA), etc. Although many molecular fingerprints have been developed, we pay more attention to the ones that relate to structure. Molecular access system (MACCS) keys are of the most commonly used structural keys employed to represent molecular structure, fragments, and substructural information. ${}^{19}$ Each compound can be converted into MACCS keys with 167 dimensions. Meanwhile, molecular properties such as molecular weight (MW), TPSA, and many others can also be conveniently extracted by using RDKit software. ${}^{20}$ Moreover, another possible factor, dipole moment (DM), is calculated using Mopac2016 (PM6-D3). ${}^{21}$ In order to express the mobile phase information, a weighted vectorization technique based on the molecular descriptors for solvents is employed. A six-dimensional vector of descriptors is utilized to represent each solvent, and the representation of the mobile phase is obtained by the weighted average of vectors of different solvents according to the proportion of each solvent. To avoid prohibitively time-consuming analysis and logging of computational data, we developed software to automate feature generation. The program requires only the input of simplified molecular input line entry system (SMILES) strings ${}^{22}$ of compounds in a Python script. The program then generates the data table that can be used for modeling. In total, 180-dimensional input metrics are extracted by the software to characterize each TLC’s set of conditions (Figures 3C-3E). One of the advantages of ML modeling is that one can define feature engineering relatively freely without recourse to a specific hypothesis. This, to a certain extent, allows the machine to discover the connection, or even knowledge hidden in data, without relying on human experience. With these data in hand, we evaluated the predictive accuracies of a series of ML methods, including
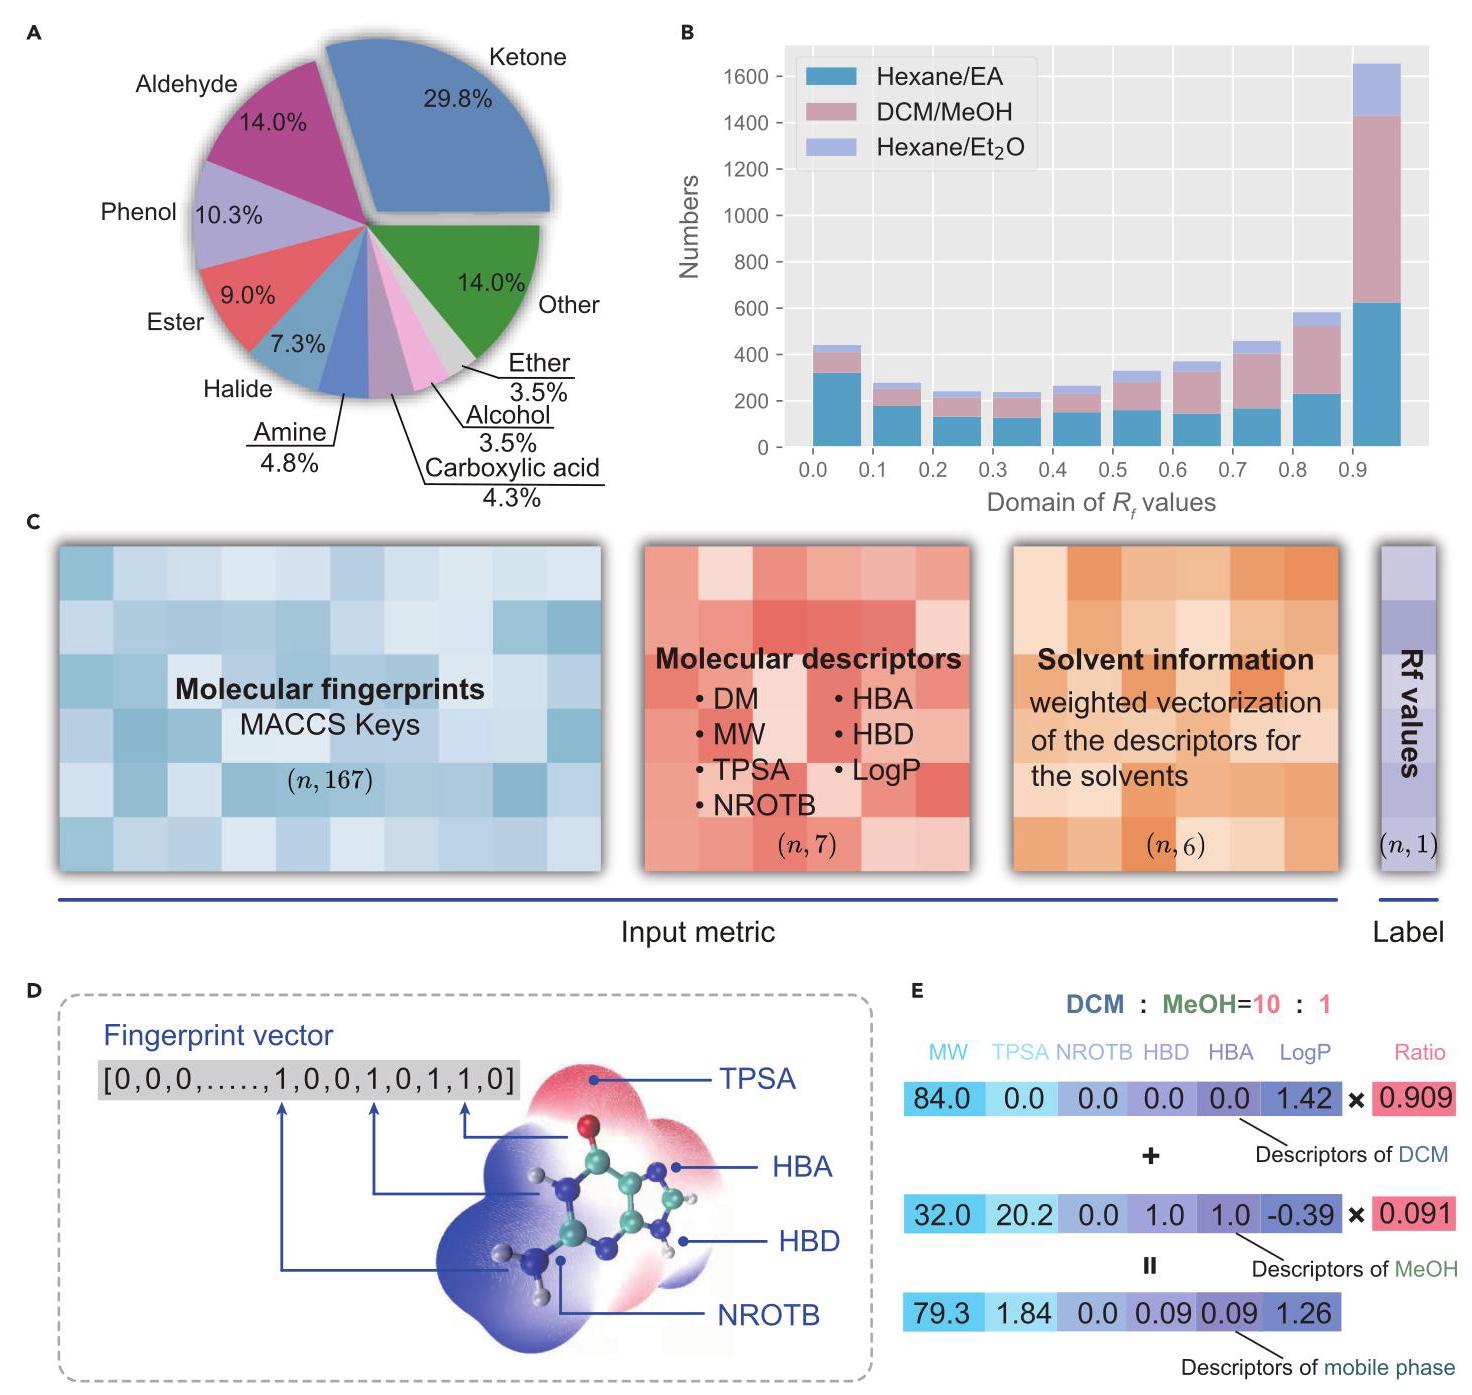
Figure 3. Description of the obtained ${R}_{f}$ value dataset and data processing
(A) The top 10 classes of the compounds in the dataset.
(B) The distribution of ${R}_{f}$ values for each mobile phase system.
(C) The input matrix includes molecular fingerprints, several molecular descriptors, and solvent information. The label is the ${R}_{f}$ value. DM, dipole moment; MW, molecular weight; TPSA, topological polar surface area; NROTBs, number of rotatable bonds; HBA, hydrogen bond acceptor; HBD, hydrogen bond donor; LogP, lipid-water partition coefficient.
(D) The molecular access system (MACCS) keys are one of the most commonly used structural keys. In these structural keys, the structure of a molecule is encoded into a binary bit string (a sequence of 0’s and 1’s), each bit of which corresponds to a “pre-defined” structural feature. This binary bit string makes up the fingerprint vector.
(E) An example for the weighted vectorization technique of the mobile phase system.
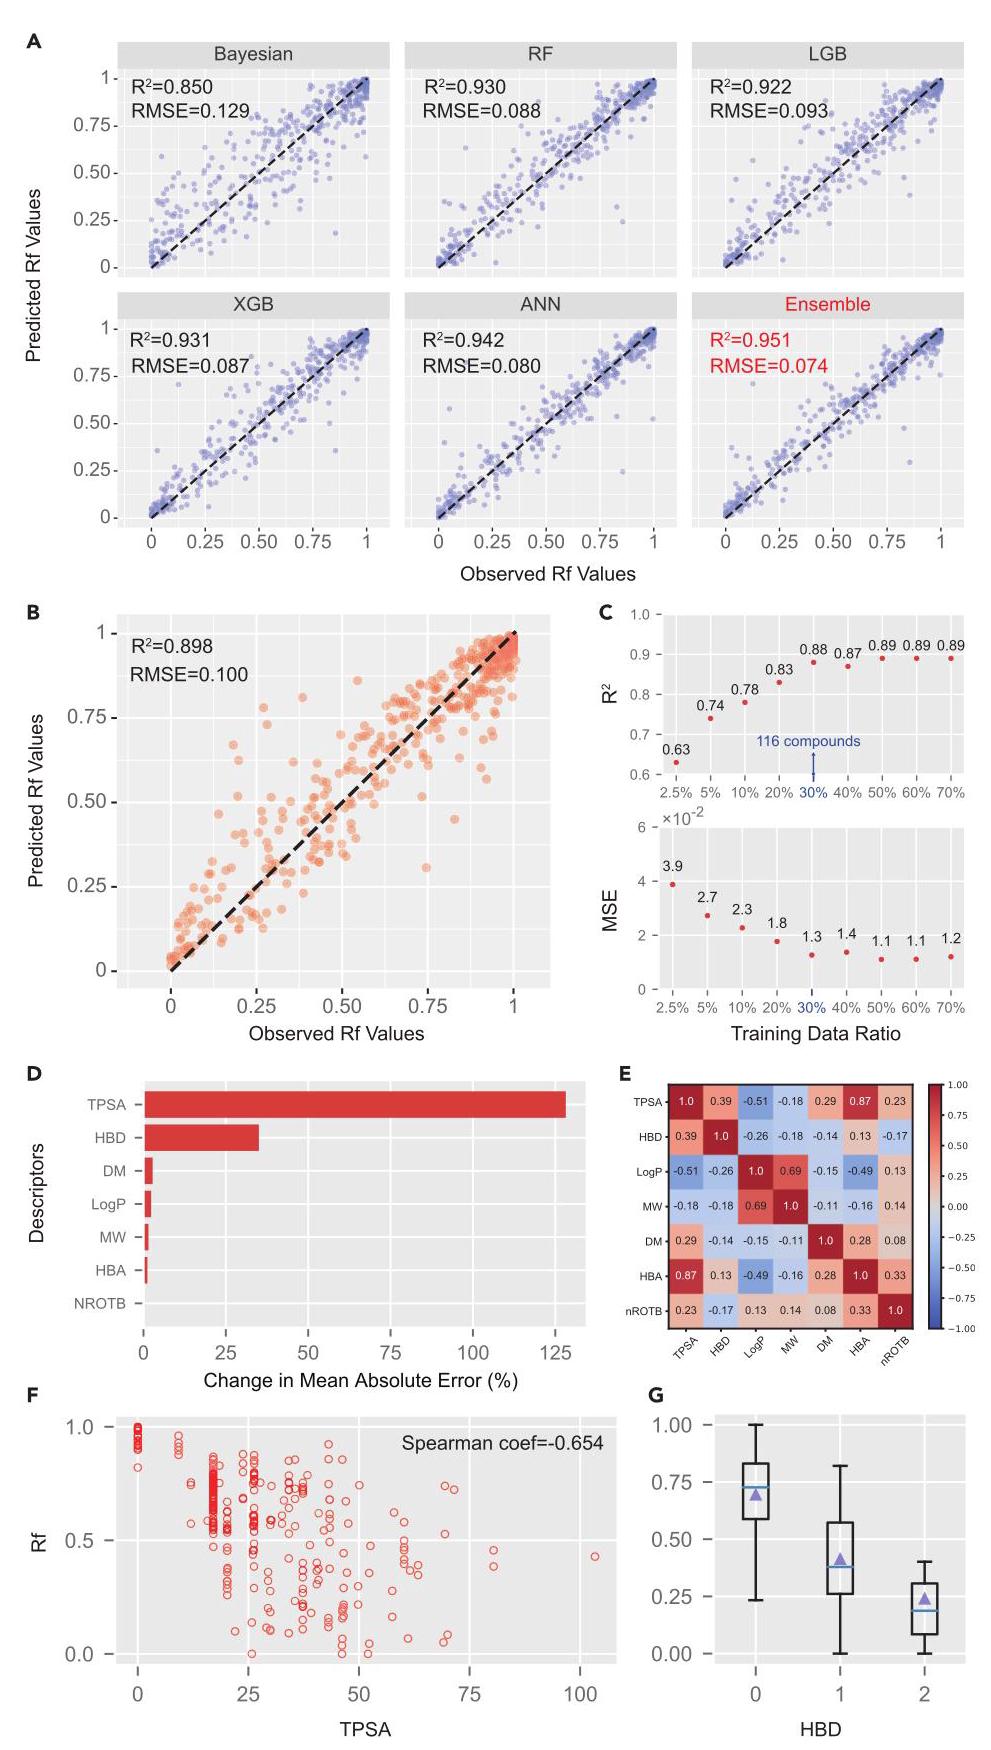
Figure 4. Prediction for ${R}_{f}$ values with machine-learning techniques and the analysis of the descriptors
(A) Observed versus predicted ${R}_{f}$ values for different ML algorithms. For all the models, an 80/10/10 random split of training, validation, and test data by TLC data is performed to measure the
Figure 4. Continued
prediction ability of each model. Only test set data are shown in plots. The dashed line is the $y = x$ line.
(B) Observed versus predicted ${R}_{f}$ values for the proposed ensemble method to predict out-of-
sample compounds. The dataset is randomly split into ${80}/{10}/{10}$ by compounds, and only test set data are shown in plots. The dashed line is the $y = x$ line.
(C) Test set performance of the ensemble prediction model with sparse data. The smaller training sets are selected randomly from the total compounds, and the test data are kept the same. A gradual decline in predictive accuracy occurred, from 70% of the total compounds down to 2.5%.
(D) The relative importance of the molecular descriptors utilized in this work.
(E) The heatmap of correlation coefficients between molecular descriptors.
(F) The scatterplot of ${R}_{f}$ values on TPSAs of all compounds when hexane/EA = 5/1.
(G) The boxplot of ${R}_{f}$ values of the compounds with different HBDs when hexane/EA $= 5/1$ .
Bayesian regression, RF, LightGBM (LGB), XGBoost (XGB), and artificial neural network (ANN). Here, the dataset is randomly divided into training, validation, and test sets according to the ratio of ${80}\% ,{10}\%$ , and ${10}\%$ by TLC data. Considering the physical constraint that the range of ${R}_{f}$ values is between 0 and 1, in the training process of the above-mentioned ML algorithms, the output will be mapped from the entire real number domain to $\left\lbrack {0,1}\right\rbrack$ through the sigmoid function. It is discovered that a deep learning-based algorithm like ANN and decision tree-based algorithms like RF, LGB, and XGB all show a satisfactory prediction ability with ${R}^{2}$ over 0.92 (Figure 4A). To avoid randomness, 10 independent experiments with different random seeds are conducted of which the results are shown in Figure S10. On the basis of these techniques, an ensemble method is proposed to form a better model and further improve the accuracy. We are delighted to find that a predictive model with the highest accuracy $\left( {{R}^{2} = {0.951}}\right)$ can be obtained by a simple weighted average of these methods. This improvement may be attributed to the ability of the ensemble algorithm to avoid overfitting and decrease the risk of obtaining a local minimum. ${}^{23}$ These satisfactory results also reflect the precision and consistency of the dataset obtained by the automatic platform since ML techniques have a stringent requirement for accurate, independent, and identically distributed data.
Next, a more difficult and practical problem is considered, which is that of predicting the ${R}_{f}$ values of out-of-sample compounds under different solvent compositions. In this task, the dataset is randomly split into a training dataset with 3,922 ${R}_{f}$ values from 308 compounds (80% of total compounds), a validation dataset with ${484}{R}_{f}$ values from 38 compounds (10% of total compounds), and an out-of-sample test dataset with 473 ${R}_{f}$ values from 38 compounds (10% of total compounds). The proposed ensemble model is trained, and the prediction performance on the test set is examined. On average, the root-mean-square error (RMSE) of the predicted ${R}_{f}$ values of the out-of-sample 38 compounds is 0.100, with an ${R}^{2}$ value of 0.898 (Figure 4B). The effective out-of-sample prediction of the proposed model suggests that the constitutive relationship between the input information and output ${R}_{f}$ value measurements is well captured by the prediction model, which means that it may be possible to predict the ${R}_{f}$ values of compounds under specified elution solvents.
In order to explore the relationship between the predictive power of the model and input data more deeply, different numbers of compounds are utilized to train the model, whereas the test set is fixed. It is surprising to discover that the prediction model is able to maintain satisfactory predictive power with a markedly smaller training dataset, since the ${R}^{2}$ of the model trained from the ${R}_{f}$ values of 116 compounds (30% of total compounds) achieves 0.878 , which is only a decrease of 0.012 when compared with the model trained from 70% of the total compounds (Figure 4C). This indicates that there is a tight physical relationship between the structure and properties of the compound and the ${R}_{f}$ value that could be learned by the proposed ensemble model through only 116 compounds, so as to predict the ${R}_{f}$ values with a certain degree of accuracy, which provides an example of “small data, big task. 24”
Statistical analysis for descriptors
After having obtained a satisfactory predictive model, we seek to explore the physical and chemical knowledge underlying the trained model. The molecular descriptors that characterize molecular properties are contained in the input information. As a consequence, the relative importance of the utilized molecular descriptors is evaluated by the percent increase in the predictive model’s mean absolute error (MAE) when values of certain descriptors in the test set are randomly reassigned according to data distribution. It is found that, among these descriptors, the TPSA shows significant importance over all others (Figure 4D). The correlation coefficients between molecular descriptors are also explored (Figure 4E). It is found that the TPSA and hydrogen bond acceptor (HBA) have a very strong positive correlation. The TPSA of a molecule is defined as the surface sum over all polar atoms, primarily oxygen and nitrogen, which is often used to evaluate the transport properties of drugs in cells, and it is proven to have an inseparable relationship with the ${R}_{f}$ values in this work. We rationalize that a larger TPSA leads to a stronger interaction between the adsorbate and the adsorbent (e.g., silica gel), leading to smaller ${R}_{f}$ values. This is proved in Figure 4F where the Spearman coefficient is -0.654 , which indicates a strong negative correlation. As for the hydrogen bond donor (HBD) and HBA, they indicate the number of hydrogen bond donors and acceptors, respectively. Our results show that the HBD is more relevant to the ${R}_{f}$ value than the HBA, and the ${R}_{f}$ values present a clear downward trend as HBDs increase, which are illustrated in Figure 4G. The explanation is that the solid phase used in this study is silica gel, which contains many bridging oxygens and hydroxyl groups on the surface acting as HBAs. Therefore, the analyte will have more binding interactions with silica gel when it contains HBDs rather than HBAs. The relationship between the ${R}_{f}$ values and descriptors was indistinct before and is revealed statistically in this work for the first time.
Application and extendibility
The predictive model has a wide range of applications that facilitates the acquisition of ${R}_{f}$ values and deepens understanding. Its primary utilization is to predict the ${R}_{f}$ curve of a given compound. Three out-of-sample compounds where the ${R}_{f}$ curves present different patterns are examined. The predicted and experimental ${R}_{f}$ curves under different mobile phase systems are illustrated in Figure 5. It is discovered that the predicted curves have achieved satisfactory accuracy for compounds of different classes in all systems, although the patterns of curves are different. On this basis, the predictive model is able to provide prior information of the ${R}_{f}$ values in different mobile phase systems before chemical experiments, which averts repeated trials for selecting an appropriate system in common practice. Furthermore, the predictive model is able to facilitate the chromatographic separation of known compounds by giving an appropriate initial solvent system from the predicted ${R}_{f}$ curves. Meanwhile, the ability of the predictive model to facilitate chromatographic separation is also examined by a large number of hypothetical experiments, and an 80.8% accuracy is obtained (Table S3).
Considering the wide variety of organic compounds, it is difficult to complete a sweep of all classes of compounds; therefore, we selected some representative classes such as ketone, aldehyde, phenol, and others to form the dataset of ${R}_{f}$ values. Although the predicted model has been proven to possess a satisfactory accuracy when predicting the ${R}_{f}$ curves of the classes involved in the dataset, its extendibility to other classes that have never appeared in the dataset is also a challenge. As a consequence, the predictive model is employed to predict the ${R}_{f}$ values of saccha-rides of which the results are displayed in Figure S11. Saccharides are polyhydroxy aldehydes and ketones, and their derivatives are not included in our dataset. It is shown that the predictive model has the ability, to a certain degree, to predict compounds of new classes with the accuracy of the prediction slightly affected. This result implies that the ML model actually discovers a strong relationship between compound structures and ${R}_{f}$ values, and it can predict the properties of compounds from new classes to a certain degree.
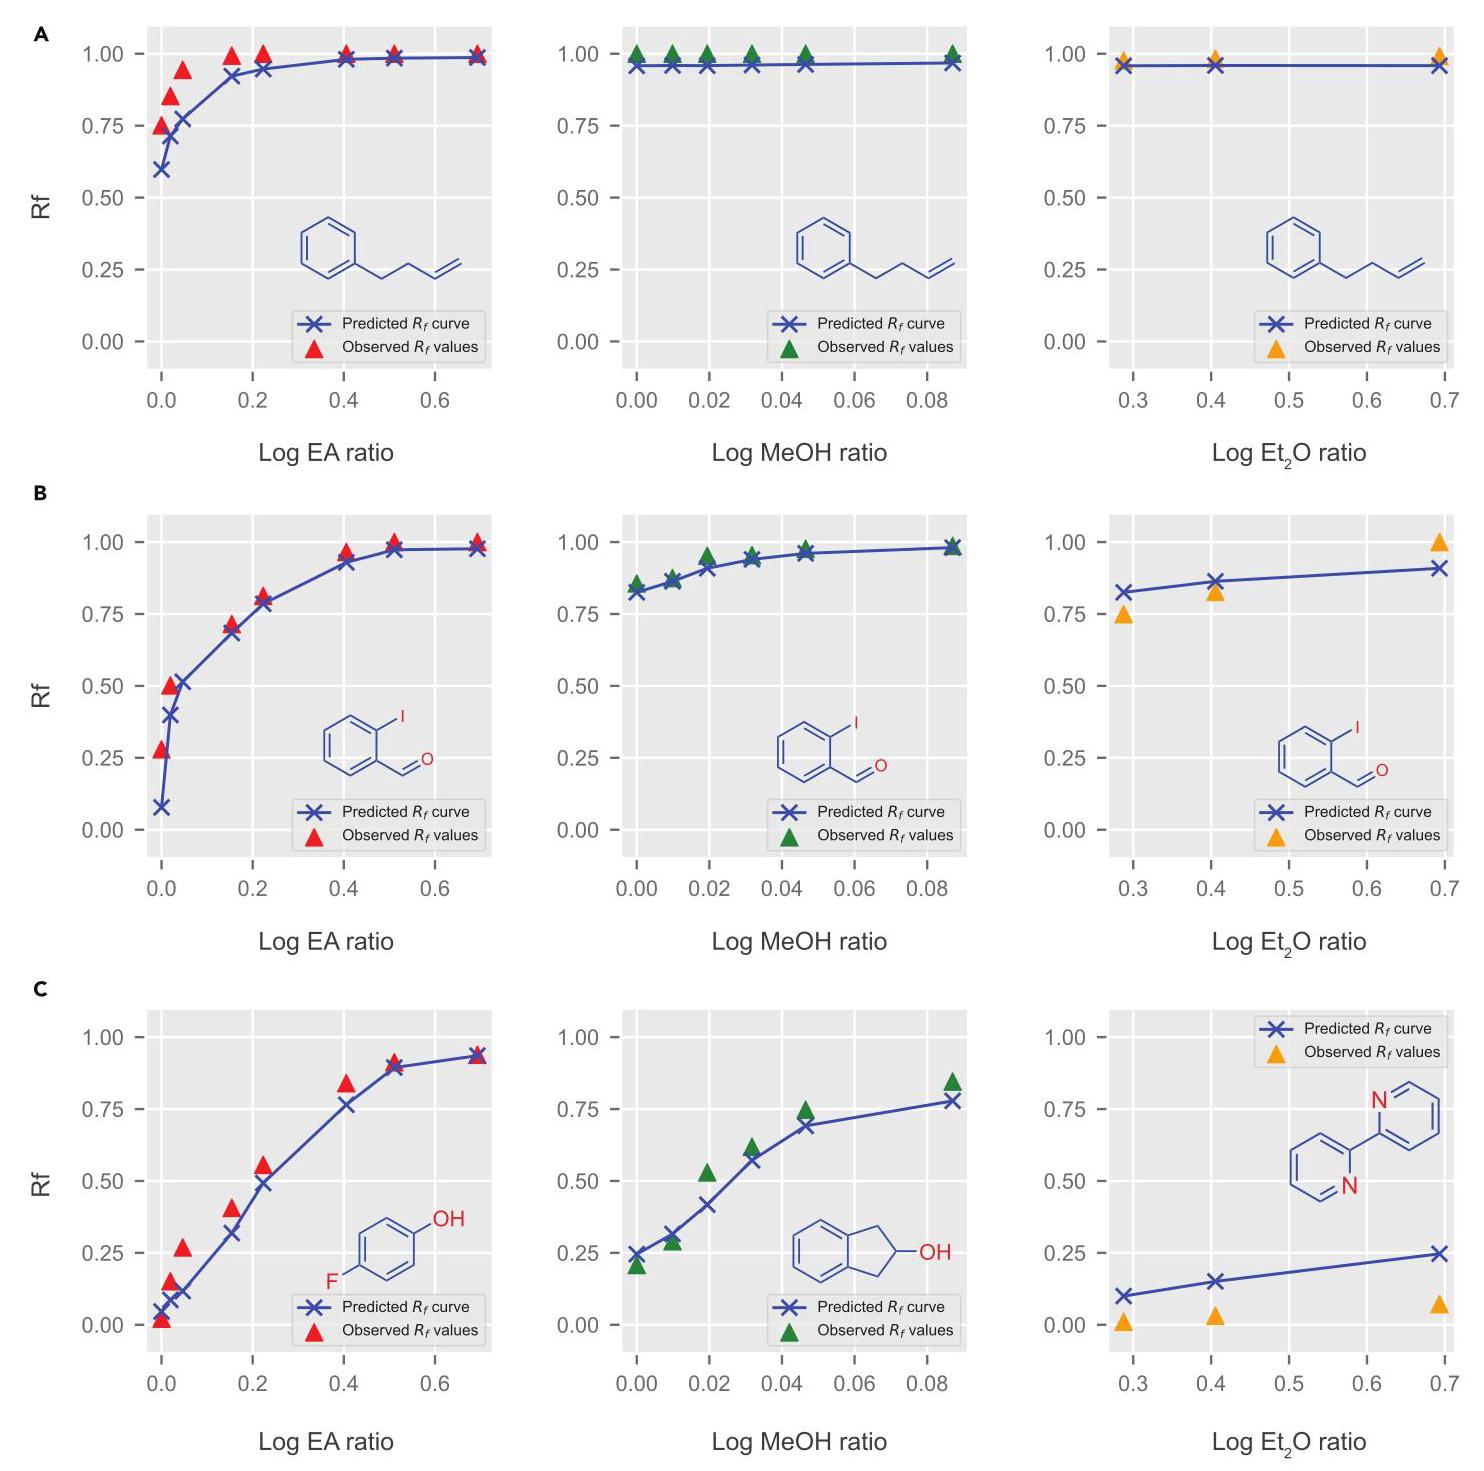
Figure 5. Predicted ${R}_{f}$ curves
(A and B) Predicted ${R}_{f}$ curves and experimental ${R}_{f}$ curves for two out-of-sample compounds under three mobile phase systems, including hexane/ethyl acetate (left), dichloromethane/methanol (middle), and hexane/diethyl ether (right).
(C) Predicted ${R}_{f}$ curves and experimental ${R}_{f}$ curves for three compounds of different classes under a certain mobile phase system. The log ratio is calculated as $\log \left( {r + 1}\right)$ , where $r$ is the ratio of eluent.
DISCUSSION
TLC experiments are performed extensively every day in synthetic laboratories around the world. Determination of suitable TLC conditions usually requires chemists with ample experience, and a large number of attempts would be inevitable. Here, we have built a robotic experimentation platform and its software for TLC data collection, which generates a large amount of standardized compound’s structure-polarity data represented by SMILES and ${R}_{f}$ values automatically. Using the dataset, we further developed ML models that can predict the compound’s ${R}_{f}$ values, and the experiments performed have proved that the proposed predictive model shows satisfactory accuracy in our dataset and a certain degree of expansibility, which has a hopeful prospect for facilitating the acquirement and application of ${R}_{f}$ values. This TLC prediction approach confirms that combining ML methods and automation is a promising way to facilitate laboratory efficiency, and we believe it will prove to be useful to the synthetic community.
There also remain some limitations in this work. Considering that TLC analysis is affected by many factors (Figure 1C), high-throughput techniques based on collaborative robots are employed in our work to obtain standardized ${R}_{f}$ value data for ML, thereby constructing a high-precision predictive model. However, the direct use of this model in other laboratories may not work in the way of predicting a precise ${R}_{f}$ value of a given compound due to different experimental conditions, e.g., the size of the chamber, TLC plates, and so on. Nevertheless, the model can compute a series of ${R}_{f}$ values under various combinations of eluents in seconds, which could be used as an initial trial point. As for separation tasks, the model can predict the probability of separation of two (or more) compounds as reflected by the predicted difference in the ${R}_{f}$ values.
EXPERIMENTAL PROCEDURES
Resource availability
Lead contact
Further information and requests for resources should be directed to and will be fulfilled by the lead contact, Fanyang Mo ().
Materials availability
This study did not generate new unique reagents.
Data and code availability
The TLC dataset have been deposited at the website https://github.com/ woshixuhao/ML-Prediction-for-Rf-values and are publicly available as of the date of publication.
All original code has been deposited at the website https://github.com/ woshixuhao/ML-Prediction-for-Rf-values and is publicly available as of the date of publication.
A video associated with this project can be found via the following links:
English version: https://www.bilibili.com/video/BV1am4y1o7yE/
Chinese version: https://www.bilibili.com/video/BV17R4y1j7jz/
SUPPLEMENTAL INFORMATION
Supplemental information can be found online at https://doi.org/10.1016/j.chempr.2022.08.008.
ACKNOWLEDGMENTS
We thank Prof. Suwei Dong at Peking University Health Science Center, Prof. Shu-feng Chen at Inner Mongolia University, and Prof. Qing Xiao at Third Military Medical University for generously providing some organic compounds. This work is supported by the National Natural Science Foundation of China (grant nos. 22071004, 21933001, and 22150013).
AUTHOR CONTRIBUTIONS
H.X. and F.M. built the robotics platform for high-throughput experimentation. J.L. performed TLC experiments. H.X. performed chemoinformatic and ML studies. Q.L. derived the theoretical formula for TLC mechanisms. J.Z. and Q.L. performed DFT calculation. All authors analyzed the data. H.X. and F.M. wrote the manuscript. F.M. conceived the idea and designed the overall research. F.M. and D.Z. supervised the whole project.
DECLARATION OF INTERESTS
F.M., H.X., and D.Z. are inventors on two patent applications (CN 202111638511.2 and 202122346010.9) submitted by Peking University that cover an organic chemistry laboratory automation system and a ML method for TLC conditions prediction, respectively.
Received: May 19, 2022
Revised: July 20, 2022
Accepted: August 12, 2022
Published: September 7, 2022
REFERENCES
Sherma, J., and Fried, B. (2003). Handbook of Thin-Layer Chromatography (CRC Press).
Muratov, E.N., Bajorath, J., Sheridan, R.P., Tetko, I.V., Filimonov, D., Poroikov, V., Oprea, T.I., Baskin, I.I., Varnek, A., Roitberg, A., et al. (2020). QSAR without borders. Chem. Soc. Rev. 49, 3525-3564. https://doi.org/10.1039/ d0cs00098a.
Yang, Q., Li, Y., Yang, J.D., Liu, Y., Zhang, L., Luo, S., and Cheng, J.P. (2020). Holistic prediction of the pKa in diverse solvents based on a machine-learning approach. Angew. Chem. Int. Ed. Engl. 59, 19282-19291. https:// doi.org/10.1002/anie.202008528.
Howarth, A., Ermanis, K., and Goodman, J.M. (2020). DP4-AI automated NMR data analysis: straight from spectrometer to structure. Chem. Sci. 11, 4351-4359. https://doi.org/10.1039/ dOsc00442a.
Reid, J.P., and Sigman, M.S. (2019). Holistic prediction of enantioselectivity in asymmetric catalysis. Nature 571, 343-348. https://doi.org/ 10.1038/s41586-019-1384-z.
Kirkpatrick, J., McMorrow, B., Turban, D.H.P., Gaunt, A.L., Spencer, J.S., Matthews, A.G.D.G., Obika, A., Thiry, L., Fortunato, M., Pfau, D., et al. (2021). Pushing the frontiers of density functionals by solving the fractional electron problem. Science 374, 1385-1389. https://doi.org/10.1126/science.abj6511.
Kursa, M.B., Komsta, Ł., and Rudnicki, W.R. (2011). The robust models of retention for thin layer chromatography. Soft Comput. 103, 169-176. https://doi.org/10.1007/978-3-642- 23169-8_19.
Komsta, Ł. (2008). A functional-based approach to the retention in thin layer chromatographic screening systems. Anal. Chim. Acta 629, 66-72. https://doi.org/10.1016/j.aca.2008.09.036.
Ley, S.V., Fitzpatrick, D.E., Ingham, R.J., and Myers, R.M. (2015). Organic synthesis: march of the machines. Angew. Chem. Int. Ed. Engl. 54, 3449-3464. https://doi.org/10.1002/anie.201410744.
Häse, F., Roch, L.M., and Aspuru-Guzik, A. (2019). Next-generation experimentation with self-driving laboratories. J. Trends Chem. 1, 282-291. https://doi.org/10.1016/j.trechm.2019.02.007.
Wilbraham, L., Mehr, S.H.M., and Cronin, L. (2021). Digitizing chemistry using the chemical processing unit: From synthesis to discovery. Acc. Chem. Res. 54, 253-262. https://doi.org/ 10.1021/acs.accounts.0c00674.
Mahjour, B., Shen, Y., and Cernak, T. (2021). Ultrahigh-throughput experimentation for Information-rich chemical synthesis. Acc. Chem. Res. 54, 2337-2346. https://doi.org/10.1021/acs.accounts.1c00119.
Ahneman, D.T., Estrada, J.G., Lin, S., Dreher, S.D., and Doyle, A.G. (2018). Predicting reaction performance in C-N cross-coupling using machine learning. Science 360, 186-190. https://doi.org/10.1126/science.aar5169.
Granda, J.M., Donina, L., Dragone, V., Long, D.L., and Cronin, L. (2018). Controlling an organic synthesis robot with machine learning to search for new reactivity. Nature 559, 377-381. https://doi.org/10.1038/s41586-018- 0307-8.
Steiner, S., Wolf, J., Glatzel, S., Andreou, A., Granda, J.M., Keenan, G., Hinkley, T., Aragon-Camarasa, G., Kitson, P.J., Angelone, D., et al. (2019). Organic synthesis in a modular robotic system driven by a chemical programming language. Science 363. https://doi.org/10.1126/science.aav2211.
Burger, B., Maffettone, P.M., Gusev, V.V., Aitchison, C.M., Bai, Y., Wang, X., Li, X., Alston, B.M., Li, B., Clowes, R., et al. (2020). A mobile robotic chemist. Nature 583, 237-241. https:// doi.org/10.1038/s41586-020-2442-2.
Newman-Stonebraker, S.H., Smith, S.R., Borowski, J.E., Peters, E., Gensch, T., Johnson, H.C., Sigman, M.S., and Doyle, A.G. (2021). Univariate classification of phosphine ligation state and reactivity in cross-coupling catalysis. Science 374, 301-308. https://doi.org/10.1126/ science.abj4213.
Shields, B.J., Stevens, J., Li, J., Parasram, M., Damani, F., Alvarado, J.I.M., Janey, J.M., Adams, R.P., and Doyle, A.G. (2021). Bayesian reaction optimization as a tool for chemical synthesis. Nature 590, 89-96. https://doi.org/ 10.1038/s41586-021-03213-y.
Durant, J.L., Leland, B.A., Henry, D.R., and Nourse, J.G. (2002). Reoptimization of MDL keys for use in drug discovery. J. Chem. Inf. Comput. Sci. 42, 1273-1280. https://doi.org/ 10.1021/ci010132r.
Landrum, G. (2017). Getting started with the RDKit in Python. http://www.rdkit.org/docs/ GettingStartedInPython.html.
Stewart, J.J.P. (2016). Stewart Computational Chemistry. http://openmopac.net/.
Weininger, D. (1988). SMILES, a chemical language and information system: 1: Introduction to methodology and encoding rules. J. Chem. Inf. Model. 28, 31-36. https:// doi.org/10.1021/ci00057a005.
Sagi, O., and Rokach, L. (2018). Ensemble learning: A survey. WIREs Data Mining Knowl. Discov. 8. https://doi.org/10.1002/widm.1249.
Qi, G.J., and Luo, J. (2022). Small data challenges in big data era: A survey of recent progress on unsupervised and semi-supervised methods. IEEE Trans. Pattern Anal. Mach. Intell. 44, 2168-2187. https://doi.org/10.1109/ TPAMI.2020.3031898.