Carbon Capture, Utilization & Storage: A General Overview
中文 / Bilingual · English version
Jun Fu · Dongxiao Zhang · Ming Lei Editors
Climate Mitigation and Adaptation in China
Policy, Technology and Market
Metallurgical Industry Press
Climate Mitigation and Adaptation in China Policy, Technology and Market
“A superb book.”
-Ngaire Woods, Oxford University, Fellow of the British Academy of Social Sciences
“Climate Mitigation and Adaptation in China is a sophisticated study of China’s efforts to decarbonize its economy, which is especially valuable for its sensitivity to global policy discussions and its awareness of the close connections between international commitments and domestic public policy choices.”
-Robert O. Keohane, Princeton University, Member of the US National Academy of Sciences
“The role of China in tackling climate change will be critical to the success in facing up to the world’s greatest challenge. This book explores how policy, technology and markets need to work together to create the conditions to move to a green economy as a model for others to follow.”
-Philip Allmendinger, University of Cambridge, Fellow of the British Academy of Social Sciences
“This is a deep, up-to-date and rigorous analysis of China’s strategic, economic, and technological pathways towards carbon neutrality… An essential reading to understand the new role of China in the global governance of climate change.”
-Alberto Quadrio-Curzio, President, the International Balzan Prize Foundation, and President Emeritus, the National Academy of Lincei, Italy
“This book provides important insights into Chinese thinking and Chinese policy toward decarbonization. It will be of interest to anyone concerned about Chinese policies toward climate change—and, more broadly, to anyone concerned about the potential for successful action to mitigate climate change globally.”
—Jeffry Frieden, Harvard University, Member of the American Academy of Arts and Sciences
“As a major and growing economy, China’s role in meeting a global climate challenge is simply crucial. Professor Fu Jun and his colleagues have done a masterful job of laying out the parameters, policies and prospects of China’s path to sustainability. It should be essential reading, domestically and internationally.”
-A. Michael Spence, Stanford University, Nobel Memorial Prize Laureate in Economic Sciences
Jun Fu $\cdot$ Dongxiao Zhang $\cdot$ Ming Lei Editors
Climate Mitigation and Adaptation in China
Policy, Technology and Market
Editors
Jun Fu Dongxiao Zhang
National School of Development College of Engineering
Peking University Peking University
Beijing, China Beijing, China
Ming Lei
Guanghua School of Management
Peking University
Beijing, China
ISBN 978-981-16-4309-5 ISBN 978-981-16-4310-1 (eBook)
https://doi.org/10.1007/978-981-16-4310-1
Jointly published with Metallurgical Industry Press, Beijing, China
The print edition is not for sale in China (Mainland). Customers from China (Mainland) please order the print book from: Metallurgical Industry Press
© Metallurgical Industry Press 2022, corrected publication 2023
This work is subject to copyright. All rights are solely and exclusively licensed by the Publisher, whether the whole or part of the material is concerned, specifically the rights of reprinting, reuse of illustrations, recitation, broadcasting, reproduction on microfilms or in any other physical way, and transmission or information storage and retrieval, electronic adaptation, computer software, or by similar or dissimilar methodology now known or hereafter developed.
The use of general descriptive names, registered names, trademarks, service marks, etc. in this publication does not imply, even in the absence of a specific statement, that such names are exempt from the relevant protective laws and regulations and therefore free for general use.
The publishers, the authors, and the editors are safe to assume that the advice and information in this book are believed to be true and accurate at the date of publication. Neither the publishers nor the authors or the editors give a warranty, express or implied, with respect to the material contained herein or for any errors or omissions that may have been made. The publishers remain neutral with regard to jurisdictional claims in published maps and institutional affiliations.
This Springer imprint is published by the registered company Springer Nature Singapore Pte Ltd. The registered company address is: 152 Beach Road, #21-01/04 Gateway East, Singapore 189721, Singapore
Preface
Climate change is a huge challenge facing humanity in the twenty-first century. The 2015 Paris Agreement represents a global consensus to keep global temperatures well below ${2}^{ \circ }\mathrm{C}$ above the pre-industrial levels and to pursue further efforts to limit the temperature increase within ${1.5}^{ \circ }\mathrm{C}$ . In 2018, the UN Intergovernmental Panel on Climate Change (IPCC) has further warned that the impact of above ${1.5}^{ \circ }\mathrm{C}$ of global warming will spell disasters to the ecosystem on Earth. As a response to the call for renewed efforts at mitigation and adaptation to climate change, in 2020, China has again pledged to the international community that it will peak ${\mathrm{{CO}}}_{2}$ (carbon dioxide) emissions prior to 2030 and try to achieve carbon neutrality by 2060-indeed a tall order to fulfill given China’s current stage of development.
Fight against climate change calls for concerted efforts by all walks of life, both domestic and international (e.g., if every individual in China were to reduce one ton of ${\mathrm{{CO}}}_{2}$ each year, it would amount to a total reduction of 1.4 billion tons of ${\mathrm{{CO}}}_{2}$ , which is roughly an equivalent of the yearly ${\mathrm{{CO}}}_{2}$ emissions by the Chinese steel or cement industry). Similarly, as reflected by the on-going research on climate change at Peking University, cross-disciplinary approach is highly desirable. Presented here is a book-length study organized through what one may call a triple helix of three schools at Peking University—the National School of Development, the College of Engineering, and the Guanghua School of Management. The scholars and experts associated with these three schools cover three domains of knowledge-policy, technology, and markets-that are essential in fight against climate change.
China is a large developing country with 1.4 billion people in the midst of industrialization and urbanization. GDP per capita in China in 1979 is about US$156; it is about US$ 10,000 in 2020; urbanization is 18% in 1979; it is close to 60% in 2020. Topping output of 220 of 500 major industrial products in the world in 2011, China became the world’s largest industrial country. As a consequence, currently China is the largest ${\mathrm{{CO}}}_{2}$ emitter in the world, and it contributes roughly a quarter of global ${\mathrm{{CO}}}_{2}$ emissions, although on per capita basis, China has remained moderate-about $7{\mathrm{{tCO}}}_{2}$ per year, as compared to ${16}{\mathrm{{tCO}}}_{2}$ for the U.S. and $5{\mathrm{{tCO}}}_{2}$ for the world average.
Take the iron/steel sector in China for instance. The sector has a total of some 500 firms with a total output of crude steel reaching 1.065 billion tons in 2020, accounting for over 57% of the world’s total. In terms of ${\mathrm{{CO}}}_{2}$ emissions, it accounts for over ${60}\%$ of total ${\mathrm{{CO}}}_{2}$ emissions from global steel production and about ${15}\%$ of total domestic industrial ${\mathrm{{CO}}}_{2}$ emissions, following the power (including heat) sector (about ${50}\%$ ) and above the cement sector (about ${12}\%$ ).
But China has been working hard at mitigation and adaptation to climate change and trying to de-couple economic growth from ${\mathrm{{CO}}}_{2}$ emissions at the earliest date possible. And the present study provides a prism through which to see China’s efforts and appreciate its magnitude. The study is organized around the three linchpins, i.e., Part I, Policy; Part II, Technology; and Part III, Market. This study ends with a projection to 2060 in Part IV, by which China has pledged to achieve carbon neutrality. China has to be an integral part of the global efforts in fight against climate change-the most consequential threat facing humanity. As the latest UN Intergovernmental Panel on Climate Change suggests, without concerted efforts, the dire situation will only get worse. Everyone must act now-with a sense of urgency-to address the crisis.
What follows is a synopsis of the these principal building blocks-as well as the overall research design-of the study.
Part I Policy
At a fundamental level, climate change reflects the logic of negative externalities of what scholars have described as “the tragedy of the commons.” In order to prevent that tragedy from happening, public policy becomes indispensable. To understand China’s evolving policy framework to decarbonize its economy, a principal theme to watch is the dynamic interaction between China’s international commitments and domestic agenda setting with respect to climate change. At the risk of oversimplification, three sets of milestone international commitments can be identified for China’s efforts of mitigation and adaption to climate change.
Under the principle of “common and differentiated responsibilities” of the UNFCCC (UN Framework Convention for Climate Change), in 2009, China pledged to the international community to reduce carbon intensity per unit of GDP by 40-45% by 2020 from the level of 2015. In 2015, China pledged again to peak carbon emissions around 2030 and reduce carbon intensity by 60-65% by 2030 from the level of 2005. In 2020, building upon previous successes, China again pledged that it would peak carbon emissions prior to 2030 and try to achieve carbon neutrality by 2060. This pledge was particularly significant. Indeed, shifting from carbon equity toward carbon neutrality indicates a change of political philosophy from particular justice to general justice. (Note that China, about 157 ${\mathrm{{tCO}}}_{2}$ , was still below the world average, about ${209}{\mathrm{{tCO}}}_{2}$ , in terms of per capita accumulated ${\mathrm{{CO}}}_{2}$ emissions from 1900 to 2019. By comparison, it was about ${1218}{\mathrm{{tCO}}}_{2}$ for the U.S., ${930}{\mathrm{{tCO}}}_{2}$ for the U.K., and ${516}{\mathrm{{tCO}}}_{2}$ for France). These international commitments, in turn, have been successively factored into China’s 11th Five-Year Plan (FYP 2006-2010), 12th FYP 2011-2015, 13th FYP 2016- 2020, and 14th FYP 2021-2025, and together they have constituted an evolving policy framework, shaping the country’s efforts to decarbonize its developmental path.
Initial evidence is compelling that China has taken these commitments seriously. In 2019, for instance, China has fulfilled its 2009 pledge one year ahead of schedule, with carbon intensity reduced by 48.1% from the 2005 level and non-fossil fuels raised to 15.3% as a share of energy structure. In 2016-2019, a total of 1.4 billion tons of ${\mathrm{{CO}}}_{2}$ emissions were reduced due to work at energy efficiency nation-wide. As evidenced in the steel sector, with both “sticks” and “carrots,” the Chinese government had aggressively pursued a low-carbon strategy, by way of reducing inefficient overcapacity and enhancing energy efficiency in the 13th FYP (2016-2020). And the steel sector has been planning for a super-low-carbon strategy for the 14th FYP (2021-2025). Arguably, the overall current approach seems to be more fiat than market. But the trend is increasingly market-oriented. Indeed, having gained experience from its eight $\left( {7 + 1}\right)$ regional ETS pilots, China operationally rolled out a national carbon market (or ETS) in 2021, which promised to become the largest in the world.
The Paris Agreement set out a global action plan to keep the world on track by limiting global warming to well below ${2}^{ \circ }\mathrm{C}$ above pre-industrial levels in the long-term and urged contracting states to undertake rapid carbon emission reductions with best available technologies (BATs). As a contracting state to the Paris Agreement, China has been keen on BATs, as illustrated by its policies to encourage and shape the development of carbon capture, utilization, and storage (CCUS). Indeed, as a global fieldtrip would attest, in the last few years China has been catching up rapidly in this field and has become one of six leading countries (the USA, Canada, UK, Norway, Japan, China) in the world. Thus far, whereas most CCUS pilots and demonstrations in China are in the power sector (accounting for about ${50}\%$ of total industrial ${\mathrm{{CO}}}_{2}$ emissions), its steel sector (accounting for about 15% to total industrial ${\mathrm{{CO}}}_{2}$ emissions) seems increasingly posed to set up CCUS pilots as well in the 14th FYP (2021-2025).
Part II Technology
Generally speaking, there are three broad categories of technologies of decarbonization, i.e., low carbon, zero carbon, and negative carbon. To illustrate, hydraulic, wind, and solar power are examples of zero-carbon technologies, but the caveat here is the supply incongruence or instability of wind and solar energy for the grid, unless battery technology has made hitherto unknown breakthroughs. Currently, however, only about 15% of China’s grid capacity is VRE (variable renewable energy) compatible for wind and solar power, the sources of which vary across different regions and are unstable by nature, although their cost, excluding storage, has come down dramatically in recent years. The challenge here is for the grid to move up to higher phases of VRE integration. Or an alternative strategy is to develop green (as opposed to grey) hydrogen. That is, to use wind or solar power to produce green hydrogen locally and then store and transport it cross-regionally. In this case, attendant technology for its storage and transport must also be developed on scale. Note as well, on the endless frontier of science to watch, nuclear fusion of deuterium and tritium, two hydrogen isotopes, if successful, would mean the ultimate clean energy that is almost boundless.
Various techniques or methods of energy conservation and energy efficiency-aggressively pursued in China’s iron/steel sector thus far-typically embody low carbon technologies. By contrast, carbon capture, utilization, and storage (CCUS), including both onshore and offshore sequestration, represents negative carbon technology. Looking forward, a strategic pathway for China to move toward carbon neutrality by 2060 is likely to feature a dynamic mix in different proportions of all three categories of technologies.
To cut into the web of green technologies, our research strategy is to address the most complex and still evolving one head on, i.e., CCUS, believing that, having done the most difficult, the rest-e.g., hydraulic, wind, and solar power, etc.- would be relatively easier to piece together. After all, much research has already been done on the latter part of the picture, the basic contour is clear, and we do not have to start from scratch. Accordingly, lending credence to the strategic roadmap based on simulation for the future deployment of CCUS in the Chinese steel sector in the previous chapter, Part II of this study takes an in-depth look at CCUS as an emerging strategic reserve technology on industrial scale for direct abatement of ${\mathrm{{CO}}}_{2}$ emissions. Under country-specific engineering conditions, the study begins by methodically going through a typical iron/steel plant in China. In the process, it provides a systematic analysis of the appropriate options as well as potential pitfalls of ${\mathrm{{CO}}}_{2}$ capture technologies-physical or chemical or both—in steel-making processes, including options for ${\mathrm{{CO}}}_{2}$ transport and storage. In addition, cost estimates, together with tech-performance, of a full-chain CCUS are also provided to assist planners or decision-makers in identifying most cost-effective pathways.
For example, integrated infrastructural outlays involving optimal ${\mathrm{{CO}}}_{2}$ source-sink matching can presumably reduce unit cost of a CCUS-retrofitted plant operating in a hub-spoke cluster. In light of the source-sink matching and the maturity of various CCUS technologies for ${\mathrm{{CO}}}_{2}$ emission reduction in the near, medium, and long term, there is evidence to suggest that the steel sector should adopt the strategy linking enhanced oil recovery (EOR) and enhanced coal bed methane recovery (ECBM) technologies as the near- and medium-term utilization and storage solution and storage in deep saline aquifers as the long-term storage solution. At present, EOR and ECBM in China, experimentally or otherwise, account for only a few million tons of ${\mathrm{{CO}}}_{2}$ used annually-indeed a tiny part of the 10.4 billion tons of ${\mathrm{{CO}}}_{2}$ that China emitted in 2020. Beyond the steel sector and for considerations of scale economy and public good, it also makes sense for the government to plan, design, and invest in the basic infrastructure of hub-spoke transport clusters to facilitate or speed up the deployment of integrated full-chain CCUS projects.
Currently, however, while slow progress on CCUS pilots or demonstrations has been under way in China and overseas, huge initial investment and lack of viable business models for cost considerations are seen as the main obstacle to rapid development of CCUS, globally. The International Energy Agency (IEA) has warned that CCUS is not on track for Paris Agreement targets and picking up the pace of CCUS deployment is urgent. In China, currently CCUS pilots are mostly in coal-fired power plant and none has captured ${\mathrm{{CO}}}_{2}$ emissions in the steel and the cement sector. But as China revs up efforts to achieve carbon neutrality by 2060, it is expected that the deployment of CCUS would quicken steps in fossil fuels-intensive industries, including in the iron/steel sector. Indeed, if the rapid unfolding of the fast-speed railway network in recent years is any indication, China would also be particularly good at building multiple ${\mathrm{{CO}}}_{2}$ source-sink clusters for CCUS to scale up. And one would anticipate that work is likely to start during the 15th FYP (2026-2030), if not earlier. And if it does, it would be better to pilot first rather than big-bang approach, because CCUS has remained complex, costly, and uncertain in the nexus of all green technologies thus far. As such, in strategic sequencing, it makes sense to see CCUS as a reserve technology or “the lender of last resort”, so to speak, to borrow a term from finance.
Part III Market
Right sequencing is a critical component of a successful strategy-a lesson that China has learned from its own experience of reforms and opening-up in the past 40 years. This logic seems to have applied to the development of carbon market in China as well. That is, “testing it out before scaling it up,” so to speak. On the heels of the previous part on technology, lest one forget, markets as humanly-made institutional arrangements are institutional technologies, the design of which has to deal with both politics and economics and as such can either speed up or slow down the rate of production of ideas, products and services. Fundamentally, markets and the rule of law, as is often said, are the two sides of the same coin. In building carbon market, in 2013, after two years of preparations, China rolled out seven regional ETS (emission-trading system) pilots (i.e., in Beijing, Chongqing, Guangdong, Hubei, Shanghai, Shenzhen, and Tianjin) as a first step. The vision was-if these regional ETS pilots were successful-to build a unified national ETS starting in 2017, which eventually would become the largest ETS in the world, covering well over 6 billion tons of ${\mathrm{{CO}}}_{2}$ emissions, or more than half of China’s total ${\mathrm{{CO}}}_{2}$ emissions.
Theoretically speaking, ETS built on the theme of “cap and trade” can reduce ${\mathrm{{CO}}}_{2}$ emissions at a lower cost than direct government regulations such as mandated technologies and performance standards. Thus far, the theoretical proposition has been validated by the experience in the USA and the European Union. Are the regional ETS pilots really working in the Chinese context of regional disparities? To assess their validity in terms of behavioral changes on the part of polluting firms toward de-carbonization is thus the focus of Part III. For the sake of analytical rigor, the present study has made efforts to go beyond mere descriptive statistics by deploying the method of synthetic control in evaluating the efficacy of these regional ETS pilots.
Going beyond a prima facie case, the main findings of the investigation are as follows. First, even at this early stage, except Tianjin and Chongqing, there is evidence of varying degrees that these regional ETS pilots have contributed to the reduction of ${\mathrm{{CO}}}_{2}$ emissions, with Hubei ETS pilot being the most salient case. Second, the early success is nevertheless uneven across different regions in China, suggesting that caution is needed when considering scaling up regional ETS pilots to a unified national carbon market after 2017. Given the varying industrial structures in different regions across China for historical reasons, strategically a gradual rather than a big bang approach—with different phase-in periods for various sectors-to the construction of the national ETS would seem appropriate. Or, one could run the risk of making rich regions richer and poor regions poorer.
Third, as information and transparency is essential for market operations, a robust MRV system (monitoring, reporting, and verification) is critical, as China moves further ahead with the construction of the unified national carbon market, as well as with green financing. According to the People’s Bank of China (PBOC), by 2030 China will need to invest about RMB 2.2 trillion on a yearly basis to decarbonize its economy, and the amount will further increase to about RMB 3.9 trillion from 2030 to 2060. To meet the need, both public and private funds must be mobilized.
By 2020, all of China’s regional ETS pilots had covered a total of some 3000 firms and accumulated a ${\mathrm{{CO}}}_{2}$ trade volume of some 430 million tons, or about RMB 10 billion. Yet the current carbon price of these regional ETS pilots, averaging about RMB ${30}/{\mathrm{{tCO}}}_{2}$ , seemed too low to spur serious strategic shifts in terms of investment in new technologies such as CCUS. In principle, carbon price must reflect environmental cost, and, here, China still has a long way to go. By international comparison, carbon price in the USA and EU was about US$ 15-16/ton in 2018. Globally, unless carbon price increases dramatically in the years to come, say over US$ 70/tCO2, to galvanize a more robust path to decarbonization, it would be difficult to achieve the goal of the 2015 Paris Agreement, i.e., keeping global temperatures well below $2{}^{ \circ }\mathrm{C}$ above the pre-industrial levels.
In this connection, Part III also explores various design options of ETS on how best to incentivize CCUS from the perspective of a business model, for investment decisions with respect to green technologies (not necessarily CCUS) are ultimately made at the firm level, and sensitive to public policy and institutional environment. Take it as a brain teaser to think further ahead, now that China has rolled out a national ETS in 2021, bringing the world’s largest ETS online after three years of preparation on the basis of its experience of eight regional ETS pilots. As a first step, the national ETS now regulates some 2,200 firms from the power sector (including combined heat and power, as well as captive power plants of other sectors), and its scope is expected to expand further in the future, to cover refining and petrochemicals, chemicals, building materials, steel, nonferrous metals, paper, and aviation as well. If and when the national ETS expands to cover all eight sectors, it will cover well over 60% of China’s total emissions down the road.
Part IV Projection
Taking stock and looking forward, in 2020, China has pledged to the world that it would peak carbon emissions prior to 2030 and try to achieve carbon neutrality by 2060. The task is daunting. Put in international perspective, China’s deadline is very tight. Whereas most advanced economies have planned to spend 50-70 years from carbon peak to carbon neutrality, China has only given itself a 30-year transition period. Thus, in the years ahead, China must move aggressively to decarbonize its economy, and in the process, transitional risks can be enormous, especially for resource-intensive and fossil fuel-intensive industries. In 2020, China emitted about 10.4 billion ${\mathrm{{tCO}}}_{2}$ -or about 7.4 ${\mathrm{{tCO}}}_{2}/\mathrm{{per}}$ capita-about ${92}\%$ of which comes from the burning of coal (about 7.4 billion ${\mathrm{{tCO}}}_{2}$ ), oil (1.5 billion ${\mathrm{{tCO}}}_{2}$ ), and natural gas (0.6 billion ${\mathrm{{tCO}}}_{2}$ ). As can be imagined, the challenge for China to de-carbonize its economy within the next 40 years can be mind-boggling.
Be that as it may, there are basically four general approaches for China trying to meet the challenge lying ahead, i.e., public policy approach (PPA), market-based approach (MBA), carbon capture and storage (CCS), and nature-based solutions (NBS), such as forest sink. Based the conceptual framework of PPA+MBA+CCS+NBS (or PMCN model for short), a big part of Part IV represents efforts to project forward by way of disciplined exercises of simulation of various scenarios, such that one can see more clearly what lies ahead and reckon how best to respond. On the basis of these simulations or projections, the main takeaways are as follows:
First, as was true during the so-called new normal period, when growth rate of Chinese heavy industry (i.e., energy, cement, steel, automobiles, shipbuilding, construction, etc.) dropped dramatically from above 10% in 2008-2011 to 6% in 2015, generally economic slowdowns have lessened the steep upward trend of ${\mathrm{{CO}}}_{2}$ emissions, thus helping China peak ${\mathrm{{CO}}}_{2}$ emissions by 2030. Conversely, the simulation exercises also show that all the strategies of carbon emission reduction, including ETS, come at the cost of GDP loss, with modest declines in employment, investment, and consumption. That said, a better calibrated mix of policy instruments will take smaller costs of economic loss. In this context, in the various PPA+MBA combinations, high carbon price rather than low energy enhancement is a preferred option. In longer terms, market approach is a preferred choice over administrative fiat.
Second, to peak ${\mathrm{{CO}}}_{2}$ emissions before 2030 and achieve carbon neutrality by 2060, along the spectrum of PPA+MBA+CCS+NBS, all the instruments currently available (e.g., improvement in energy efficiency, cost reduction in renewable energy, and carbon pricing) are all necessary, but not enough even in a full combination of all above instruments. New instruments, especially for a more powerful shift from fossil to no-fossil fuels, are needed to achieve the carbon neutral goal in time. Here, carbon tax and green finance, including green loans, green bonds, and green projects, are important areas that need further explorations. Lying between PPA and MBA, carbon tax and green finance could be a potent tool to facilitate technology shifting or even leapfrogging from fossil to non-fossil fuels. And just as in ETS, to develop a robust, sophisticated and standardized MRV system, not just domestically but also internationally, including good metrics or protocols of ESG to avoid “green washing” or reduce moral hazards, is also critical in green finance, if only for the sake of risk assessment, e.g., green assets vis-à-vis brown assets. The issue of moral hazards would arise, where people’s interest and risk are not well aligned so they may have incentives to take on greater risk than they would if no one else effectively contributed insurance. Here, we must encourage international cooperation and create the right incentive structures, with respect to risks, rewards, and responsibilities.
Finally, combined rather than separate PPA aiming at de-carbonization will reshape the future structure of energy demand most powerfully. Specifically, renewable energy will be on the rise, whereas fossil fuels, especially coal, will decrease. Yet a caveat is in order. Even in the most comprehensive of all PPA scenarios available today, by 2060, renewable energy will only account for less than 80% of energy structure, whereas fossil fuels still account for more than 20%. In this light, introducing carbon tax and promoting the electric vehicle sector and other forms of electrification are important for further reductions in fossil energy, but the prerequisite is that the sources of electricity have to be clean (Currently, however, fossil-fuels power plants account for roughly 70%, the rest is non-fossil-hydraulic roughly ${15}\%$ , wind $7\%$ , nuclear $5\%$ , and solar 3%). And hopefully, variables exogenous to the current parameters of the simulation model-e.g., dramatic expansions of green finance, technology breakthroughs, including additional PPA instruments—may come along the way, thus increasing the chance that China achieve carbon neutrality in time.
Admittedly, accurate and trustworthy predictions are difficult, even when people do their best to model everything relevant. The inputs and assumptions that enter any particular model might significantly affect a conclusion. It is therefore critical to be straightforward about uncertainties if a prediction is to have any value. Note as well, there is a difference between simulation and emulation. Whereas the former is basically linear in thinking, the latter is characterized by both deductive and inductive tinkering, constantly searching for order out of complexity and even chaos. Fundamentally humans are good at emulation. Indeed, facing uncertainties and unknowns, one has to stand ready to adjust and adapt as circumstances change. Accordingly, as a research strategy for such a complex issue as climate crisis threatening humanity, one ought to conceptualize like a “philosophy-king”, straddling different disciplines of knowledge for a broad and yet logically consistent vision, and act like an academic “foot soldier”, who is well armed with the “state-of-the-art” tools or techniques of rigorous analysis and investigation. After all, philosophical views could affect the conceptual framework one deploys to describe predictions, even though not the predictions themselves. And indeed, it is at least in this spirit that the current book is orchestrated and written, leaving ample room for adding details and making corrections down the road, as contingency preparedness by way of both deductive and inductive tinkering increases resilience in transition. Our hope is to provide a rough map rather than the actual driving itself, as we move towards the middle of the 21st century.
To sum up, to peak carbon emissions prior to 2030 and achieve carbon neutrality by 2060 is a very tall order, fraught with uncertainties and unknowns down the road. What is certain is that China has to undergo a veritable green revolution -from what the Chinese would say “Gongye Wenming” (industrial civilization) to “Shengtai Wenming” (eco-civilization), which, broadly speaking, would also include protecting biodiversity and healing geo-environmental degradation - both are relevant topics but nevertheless beyond the scope of this study. In the process, as the world is intrinsically interconnected, none of us will be spared the harsh realities of ecological crisis, which means we are all in this together—“Tongzhou Gongji” (all in the same boat).
Acknowledgements
Initial research included in this book was financially supported by BHP through a project-based grant to Peking University which began in 2017 through 2020 with a focus on carbon capture, utilization and storage (CCUS) in the steel sector. Follow-up research and editing of the book in 2021 through its publication was financially supported by the Leo Koguan Foundation and the Deloitte Touche Tohmatsu CPA Ltd. through their educational and CSR programs. On behalf of our colleagues involved in this cross-disciplinary study, the editors of this book-who have led the research teams on climate change from the National School of Development, the College of Engineering, and the Guanghua School of Management at Peking University—gratefully acknowledge the generous support.
For logistic support, we would like to thank Peking University Public Policy Forum International, which has hosted many stimulating workshops and seminars on climate change, among others. We are also grateful to Yin Jianhong, Zhao Ting, and Hu Weiyi for administrative support.
Contents
Part I Policy
1 Mitigation & Adaptation-China’s Evolving Policy Framework 3
Jun Fu, Qiang Zhou, Ruqiang Zou, and Dandan Zhang
2 Drawing Strategic Roadmap of Decarbonization for the Steel Sector 35
Jun Fu, Min Wang, and Qimin Cai
Part II Technology
3 Carbon Capture, Utilization & Storage: A General Overview 61
Dongxiao Zhang, Ruqiang Zou, Xidong Wang, Jin Liu, and Fanyang Mo
4 CCUS: What is It? How Does It Cost? Techno-Economic Analysis 109
Qianguo Lin, Xi Liang, Ming Lei, Y. M. Zhang, Y. R. Pan, and N. Wang
Part III Market
5 Building Carbon Market in China: Take Stock and Look Ahead . 183
Jun Fu, Xing Chen, and Jintao Xu
6 Design Options of ETS: How to Incentivize CCUS 219
Mengfei Jiang, Xi Liang, Ming Lei, Francisco Ascui, Qianguo Lin, Muxin Liu, and Li Wang
Part IV Projection
7 Achieving Carbon Neutrality by 2060: What (More) Has to Be Done? 249
Jun Fu, Jintao Xu, Yu Liu, Lunyu Xie, and Shilei Liu
Correction to: Climate Mitigation and Adaptation in China C1
Jun Fu, Dongxiao Zhang, and Ming Lei
Index 277
About the Editors
Jun Fu, Esq., is Professor of Political Economy and Public Policy at the National School of Development, Peking University. He received his Master’s degree and Ph.D. from Harvard University and is the first Chinese to have been elected Foreign Academician of the Bologna Academy of Sciences in its long history. He is the author of Institutions and Investments (Studies in International Economics, the University of Michigan Press), and The Dao of the Wealth of Nations (Peking University Press). Previously, he held faculty positions at the School of Economics and Management, the School of Public Policy and Management, Tsinghua University, and the School of Government, Peking University. He has served, among others, as Member of the Listing Committee of Shenzhen Stock Exchange, Vice Chair of the World Economic Forum’s Global Agenda Council on New Growth Models, and Advisor to Chairman of the Executive Council of UNESCO. As a globally known thought leader, he was twice featured in the Outlook on the Global Agenda (World Economic Forum). Appointed by its Governing Board, he has also served on Visiting Committee for International and Area Studies across Harvard University.
Dongxiao Zhang is Chair Professor at College of Engineering, Peking University. An internationally well-known expert in unconventional oil and gas production, groundwater hydrology, and geological carbon sequestration, he had held positions as Senior Scientist at Los Alamos National Laboratory, Miller Chair Professor at the Department of Petroleum and Geological Engineering at the University of Oklahoma, Chair Professor at the University of Southern California, and Executive Dean of Graduate School and Dean of College of Engineering at Peking University. He has published over 220 peer-reviewed papers and authored 2 books, Stochastic Methods for Flow in Porous Media: Coping with Uncertainties (Academic Press), and Theory, Modeling and Field Investigation in Hydrogeology (Geological Society of America). He earned both his Master’s degree and Ph.D. in hydrology and water resources in 1992 and 1993, respectively, from the University of Arizona. He is Member of the U.S. National Academy of Engineering, Honorary Member of Society of Petroleum Engineers, and Fellow of Geological Society of America.
Ming Lei is Full Professor at Guanghua School of Management, Peking University. He is the author of Green Input-output Accounting: Theory and Application, Green Accounting of China (1992-2002) and Integrated Analysis of China’s Natural Resources-Economy-Environment (1992-2002) (Peking University Press, 2000/2010/2011). He was Associate Professor of Donated Chair by KENSAI Power of Japan, Graduated School of Energy Science, Kyoto University, Japan in 1998, and has held numerous honorary and academic positions, including President elect of Asia Pacific DSI, Senior Expert of Chinese National Green GDP Accounting Project, Fellow of International Sustainable Energy Association (ISEA), Fellow of Chinese Environmental Science Society, Fellow of Chinese Operation Research Society, Fellow of Chinese Environmental and Culture Society, Fellow of Chinese National Accounting Society, and Fellow of Chinese Energy Society. A Member of the Editorial Broad of Economic Science, he is Dean of the Institute on Poverty Research at Peking University and Honorary Professor of the University of Edinburgh.
Abbreviations
AAUs Assigned Amount Units
BATs Best available technologies
BECCS Bio-Energy CCS
BFG Blast furnace gas
BFs Blast furnaces steelmaking
BOF Basic oxygen furnace
CAMU China Association of Metal Scrap Utilization
CCER China certified emission reduction
CCS Carbon capture and storage
CCUS Carbon capture, utilization, and storage
CCX Chicago Climate Exchange
CDM Clean Development Mechanism
CERs Certified emission reductions
CNPC China National Petroleum Corporation
${\mathrm{{CO}}}_{2}$ Carbon dioxide
${\mathrm{{CO}}}_{2}\mathrm{e}$ Carbon dioxide equivalent
${\mathrm{{CO}}}_{2}$ -EOR Enhanced oil recovery
CSLF Carbon Sequestration Leadership Forum
DAC Direct air capture
DICE Dynamic integrated model of climate and the economy
DRI Direct reduce ion
EAF Electric arc furnace
EC European Commission
ECBM Enhanced coal bed methane
EIA Environmental Impact Assessment
EIB European Investment Bank
EOR Enhance oil recovery
ERUs Emission reduction units
ESA Electric Swing Adsorption
ETG Emissions Trading Group
ETS Emission trading system
EU ETS EU Emissions Trading System
EU European Union
FFCER Fujian Forestry Certified Emission Reduction
FYP Five-Year Plan
GCCSI Global Carbon Capture and Storage Institute
GDP Gross domestic product
GHG Greenhouse gas
HBFG Hot blast furnace gas
IEA International Energy Agency
IET International Emission Trading
IPCC Intergovernmental Panel on Climate Change
IUCN The International Union for the Conservation of Nature
JI Joint implementation
KPI Key Performance Indicators
LDG Linz-Donawitz gas
LSIPs Large-scale integrated projects
MAF Electric arc furnace
MBA Market-based approach
MEA Mono Ethanol Amine
MEE Ministry of Ecology and Environment
MEP Ministry of environmental protection
MIIT Ministry of Industry and Information Technology
MIRV Monitoring, Reporting and Verification
MNR Ministry of Natural Resources
MOF Ministry of Finance
MOST Ministry of Science and Technology
MOT Ministry of Transport
MSPE Mean Square Percent Error
MTCE Million tons of coal equivalent
NAP National Allocation Plans
NBS Nature-based solutions
NCSC National Center for Climate Strategy and International Cooperation
NDC Nationally determined contributions
NDRC National Development and Reform Commission
NPC National People’s Congress
NRA National Railway Administration
NSW National Trust of Australia
NTCC National Technical Committee on Carbon Management
PHCER Pu Hui Certified Emission Reduction
PPA Public Policy Approach
PSA Pressure Swing Adsorption
RICE Regional dynamic integrated model of climate and the economy
SAC Standardization Administration of China
SACC Strategy Analysis of Climate in China
SFA State Forestry Administration
${\mathrm{{SO}}}_{2}$ Sulphur dioxide
TCE Ton of coal equivalent
TGRBF Top Gas Recycle of Blast Furnace
TRT Top Gas Pressure Recovery Turbine
TSA Temperature Swing Adsorption
UNFCCC United Nations Framework Convention on Climate Change
VPSA Vacuum Pressure Swing Adsorption
WTO World Trade Organization
List of Figures
Chapter 1
Fig. 1 Output of total economy and industry sector (RMB trillion). Source China Statistical Yearbooks 6
Fig. 2 Output of crude steel (million tons). Source Statistical Abstract of China 7
Fig. 3 Energy consumption in China (coal equivalent, billion tons). Source IEA (2020) 8
Fig. 4 ${\mathrm{{CO}}}_{2}$ Emissions in China (billion tons). Source Shan et al. (2018, 2020) 8
Chapter 2
Fig. 1 Total Production of Crude Steel (billion tons), 1996-2020 37
Fig. 2 Steel Use (crude steel equivalent, billion tons), 1996-2019 39
Fig. 3 Energy consumption of Steel in China (Kgce/t), 2000- 2019 (data source China Steel Industry Yearbook) 44
Fig. 4 Framework of the SACC model 46
Fig. 5 CO2 Emission Reduction Model for the Steel Sector. Source NCSC 47
Fig. 6 Forecasts of ${\mathrm{{CO}}}_{2}$ Reduced by CCUS in China (mtCO2). Sources ADB, Study of China’s Carbon Capture and Storage Demonstration and Promotion Roadmap, 2015; IEA, WEO 2015 Special Report on Energy and Climate Change, 2015; Nie Ligong et al., A Study of the Path to Global Commercialization of CCS Technology, 2016; OECD/IEA, Energy Technology Analysis-Prospects for ${\mathrm{{CO}}}_{2}$ Capture and Storage,2004 52
Fig. 7 A phased CCUS Policy Roadmap for Steel Sector 54
Chapter 3
Fig. 1 Main technological processes in producing steel 62
Fig. 2 Cost and capacity for transportation alternatives at ${250}\mathrm{\;{km}}$ (Sevensson et al., 2004) 83
Fig. 3 The ${\mathrm{{CO}}}_{2}$ transport chain (Modified from Aspelund & Jordal, 2007) 86
Fig. 4 Construction costs for pipelines from various information sources. Costs exclude booster stations (Metz, 2005) 86
Fig. 5 Levelized cost of pipeline transport from various information sources (Metz, 2005) 88
Fig. 6 Comparison of costs of onshore and offshore pipelines, and ship transport (Metz, 2005) 89
Fig. 7 Trapping mechanisms evolution with time (Modified from Metz et al., 2005) 91
Fig. 8 Different kinds of appropriate ${\mathrm{{CO}}}_{2}$ storage sites (Modified from Benson & Cole, 2008) 93
Chapter 4
Fig. 1 Coke oven gas purification system 113
Fig. 2 Principle of chemical absorption method 121
Fig. 3 Schematic principle of membrane separation ${\mathrm{{CO}}}_{2}$ 124
Chapter 5
Fig. 1 ETS Pilots in China: Transaction Threshold and Reporting Threshold. Note 1. Data. Source Websites of local DRC in 7 regional ETS pilots; 2. Reporting emissions of Chongqing is unavailable 189
Fig. 2 Share of trading volume/trading turnover. Data source http://k.tanjiaoyi.com/ 196
Fig. 3 Trends of emission permit trading in China. Data source http://k.tanjiaoyi.com/ 197
Fig. 4 ${\mathrm{{CO}}}_{2}$ emissions between Hubei and synthetic Hubei 204
Fig. 5 ${\mathrm{{CO}}}_{2}$ emissions of polluting industries between Hubei and synthetic Hubei 205
Fig. 6 ${\mathrm{{CO}}}_{2}$ emissions between Guangdong and synthetic Guangdong 206
Fig. 7 ${\mathrm{{CO}}}_{2}$ Emissions between Tianjin and synthetic Tianjin 206
Fig. 8 ${\mathrm{{CO}}}_{2}$ emissions between Beijing and synthetic Beijing 207
Fig. 9 ${\mathrm{{CO}}}_{2}$ emissions between Shanghai and synthetic Shanghai 208
Fig. 10 Placebo test 209
Fig. 11 ${\mathrm{{CO}}}_{2}$ emissions between Chongqing and synthetic Chongqing 215
Chapter 6
Fig. 1 Operation mechanism of ETS 221
Chapter 7
Fig. 1 Energy intensity: China, Germany, US, Japan and India (1990-2015). Source World Bank. Unit: MJ/$2011 PPP GDP 257
Fig. 2 Share of Renewable Energy: China, Germany, US, Japan and India (1990-2015). Source World Bank Unit: % 257
Fig. 3 ${\mathrm{{CO}}}_{2}$ emissions in China (2020-2060) by various scenarios of energy efficiency improvement (Unit: 0.1 billion tons) Note: A1 energy efficiency increase by 0.5%/year, A2 energy efficiency increase by 1%/year, A3 energy efficiency increase by 1.5%/year, A4 energy efficiency increase by $2\% /$ year, A5 energy efficiency increase by ${2.5}\% /$ year, A6 energy efficiency increase by $3\% /$ year 265
Fig. 4 ${\mathrm{{CO}}}_{2}$ Emissions in China (2020-2060) by various scenarios of renewable energy cost reduction (Unit: 0.1 billion tons) Note: R1 Cost of renewable energy decreases rapidly, R2 Cost of renewable energy decreases slowly 265
Fig. 5 ${\mathrm{{CO}}}_{2}$ Emissions in China (2020-2060) by various scenarios of carbon pricing (Unit: 0.1 billion tons). Note T1 $100/tCO2 in 2060, T2 $200/tCO2 in 2060, T3 $300/tCO2 in 2060, T4 $400/tCO2 in 2060, T5 $500/tCO2 in 2060, and T6 $600/tCO2 in 2060 266
Fig. 6 ${\mathrm{{CO}}}_{2}$ Emissions in China (2020-2060) by various scenarios of policy portfolios (Unit: 0.1 billion tons). Note As an example, R1A6T6 indicates a combination of policy R1, A6 and T6 267
Fig. 7 Energy Structure in China in 2060 by various scenarios of policy portfolios (Unit: %) 268
Fig. 8 Tradeoff between ${\mathrm{{CO}}}_{2}$ Emission and GDP Loss in China in 2060, by various scenarios of policy portfolios Note Blue dot represents some one policy portfolio 268
Fig. 9 Impact of policy portfolios on macroeconomic variables in China in 2060 269
List of Tables
Chapter 1
Key elements of climate policy framework in China 10
Table 2 Key targets of FYPs 14
Table 3 CCUS Regulatory Framework in Major region/countries 24
Table 4 Policy Framework for CCUS development in China 27
Chapter 2
Table 1 Forecasts of ${\mathrm{{CO}}}_{2}$ reduced by CCUS in China (mtCO2) 50
Table 2 ${\mathrm{{CO}}}_{2}$ Reduction potential of CCUS in the steel sector 51
Chapter 3
Table 1 Transportation of global large-scale CCS project in operation. Adapted from GCCSI (2017b) 85
Table 2 Primary capture and storage type of global large-scale CCS project in operation. Adapted from GCCSI (2017b) 98
Chapter 4
Table 1 Flue gas composition of #4 Lime Kiln in Shougang Jingtang 112
Table 2 Composition of typical coke oven gas 113
Table 3 Operating condition at TRT inlet and outlet 114
Table 4 BFG composition of typical iron/steel plant in China 115
Table 5 Composition of typical LDG 117
Table 6 Composition of typical hot blast furnace flue gas 118
Table 7 Characteristics of ${\mathrm{{CO}}}_{2}$ separation technologies 127
Table 8 Composition of typical blast furnace gas in China 130
Table 9 Technical applicability of technologies for industrial grade ${\mathrm{{CO}}}_{2}$ from BFG prior to TRT 133
Table 10 Technical applicability of technologies for storage Grade ${\mathrm{{CO}}}_{2}$ from BFG prior to TRT 135
Table 11 Economic performance of technologies for industrial grade above ${\mathrm{{CO}}}_{2}$ capture from BFG before TRT (at capture rate of ${90}\%$ ) 137
Table 12 Economic performance of capture ${\mathrm{{CO}}}_{2}$ of storage grade from BFG before TRT (at 90% capture rate) 138
Economic performance of technologies for industrial grade ${\mathrm{{CO}}}_{2}$ capture from BFG after TRT (capture rate of 90%) 144
Economic of capture ${\mathrm{{CO}}}_{2}$ of storage grade from BFG before TRT (90% capture rate) 146
Caloric value benefit of ${\mathrm{{CO}}}_{2}$ capture from BFG under different capture rate 149
Technical performance of capture methods for industrial grade ${\mathrm{{CO}}}_{2}$ from LKFG 150
Technical performance of capture methods for storage grade ${\mathrm{{CO}}}_{2}$ from LKFG 153
Economic performance of technologies for industrial grade from LKFG (at capture rate of 90%) 155
Economic performance of technologies for storage grade from LKFG (at capture rate of 90%) 156
Composition of typical hot blast furnace flue gas in China 157
Technical performance of technologies for hot blast furnace flue gas 159
Economic performance of technologies for industrial grade from hot blast furnace flue gas (at capture rate of 90%) 161
Table 23 Economic performance of technologies for storage grade from hot blast furnace flue gas (at capture rate of 90%) 162
Table 24 le 24 Technical performance of technologies for Linz-Donawitz gas before cabinet 165
List of Tables
Technical performance of technologies for industry grade ${\mathrm{{CO}}}_{2}$ from Linz-Donawitz gas after cabinet 166
Table 26 Technical performance of technologies for storage grade ${\mathrm{{CO}}}_{2}$ from Linz-Donawitz Gas after cabinet 168
Table 27 Economic performance of technologies for industrial grade ${\mathrm{{CO}}}_{2}$ from Linz-Donawitz gas after cabinet (at capture rate of 90%) 171
Table 28 Economic performance of capture ${\mathrm{{CO}}}_{2}$ of storage grade after Linz-Donawitz Gas after cabinet (90% capture rate) 172
Chapter 5
Table 1 Policy framework of regional ETS pilots in China 187
Table 2 China’s regional ETS pilots in operation 190
Table 3 ETS Pilots: trading indicators 195
Table 4 Economic features of real pilots versuss synthetic pilots 201
Table 5 Synthetic weight for synthetic pilots 202
Chapter 6
Table 1 Sectoral coverage of pilot ETSs (2018) 223
Table 2 Offsets regulations in China’s pilot ETSs 226
Table 3 Comparison of 3 design options of ETS 238
Table A1: GHG accounting guidelines for iron/steel industry in China (NDRC, 2013a) 240
Chapter 7
Table 1 Single PPA scenarios 262
Table 2 Composite PPA Scenarios 263
Part I
Policy
Mitigation & Adaptation-China’s Evolving Policy Framework
Jun Fu, Qiang Zhou, Ruqiang Zou, and Dandan Zhang
Climate change caused by anthropogenic greenhouse gas (GHG) ${}^{1}$ emissions from industrialization is a global challenge. The 2015 Paris Agreement represents a global action plan to set the world on track to avoid dangerous climate change by limiting global warming to well below $2{}^{ \circ }\mathrm{C}$ above pre-industrial levels in the long-term, and to pursue best efforts to limit the increase in warming to ${1.5}{}^{ \circ }\mathrm{C}$ . To achieve the goal, the Paris Agreement underscored the need for global GHG emissions to peak as soon as possible and for the contracting states to the Agreement to undertake rapid carbon emission reductions with best available technologies (BATs).
${}^{1}$ Gases that trap heat in the atmosphere are called greenhouse gases. Global GHG emissions due to human activities primarily consist of Carbon dioxide $\left( {\mathrm{{CO}}}_{2}\right)$ , Methane $\left( {\mathrm{{CH}}}_{4}\right)$ , and Nitrous oxide $\left( {{\mathrm{N}}_{2}\mathrm{O}}\right)$ . These three types of gases represent ${76}\% ,{16}\%$ and $6\%$ of total global GHG emissions respectively. In 2017, for example, global GHG emissions was 50.9 gigatons in ${\mathrm{{CO}}}_{2}$ equivalent. See U.S. Environmental Protection Agency and PBL Netherlands Environmental Assessment Agency.
The original version of this chapter was revised: A sentence has been added on page 29. The correction to this chapter can be found at https://doi.org/10.1007/978-981-16-4310-1_8.
J. Fu $\left( \infty \right) \cdot$ D. Zhang
National School of Development, Peking University, Beijing, China
Q. Zhou
School of Government, Peking University, Beijing, China
R. Zou
College of Engineering, Peking University, Beijing, China
Due to its large population (1.4 billion people) and rapid economic growth in the midst of industrialization, currently China is the largest ${\mathrm{{CO}}}_{2}$ emitter in the world, contributing more than a quarter of global carbon emissions. But China has been working hard at mitigation and adaptation to climate change with its increasingly progressive international commitments to reduce ${\mathrm{{CO}}}_{2}$ emissions, which in turn have facilitated its domestic agenda setting for developing a low-carbon and green economy. In the past two decades, there have been three milestone announcements of China’s green pledge to the international community. In 2009, during the Copenhagen Climate Change Conference, China pledged to cut ${\mathrm{{CO}}}_{2}$ emissions per unit of GDP by 40-45% by 2020 from the 2005 level-a commitment that China has achieved by the end of 2019. ${}^{2}$ In 2015, during the Paris Climate Change Conference, China again committed to peak carbon emissions around 2030 and reduced carbon intensity of GDP by 60-65% by 2030 from the 2005 level. In 2020, at the General Debate of the 75th Session of the UN General Assembly, Chinese President Xi Jinping pledged again that China will peak its carbon emissions prior to [emphasis added] 2030, ${}^{3}$ and become carbon neutral by 2060.
The aim of this chapter is to outline the evolution of China’s policy or regulatory framework to de-carbonize its economy. It does so through the prism of the steel sector and with a special attention to the emerging technology of carbon capture, utilization and storage (CCUS). Where relevant, international comparisons are also made so that we have a sense of where China stands now in terms of both policy and technology for green growth.
The rest of this chapter is organized as follows: Section 1 presents a brief overview of China’s industrial growth, including the steel sector, in the past 2-3 decades, in terms of growth trends, energy consumption and carbon emissions. Section 2 discusses China’s policy framework to decarbonize the industry. In the process, we will identify the key government departments tasked with shaping the country’s strategy for sustainable economic and social development. Section 3 puts China in international perspective in connection with CCUS—an emerging technology increasingly recognized as having great potentials for direct abatement of ${\mathrm{{CO}}}_{2}$ emissions (Global CCS Institute,2015). Section 4 concludes by a brief review on China’s CCUS developments in terms of both policy and practice.
${}^{2}$ By the end of 2019, the reduction was 48.1%, and non-fossil fuels as a share of energy structure reached 15.3%.
${}^{3}$ To achieve this goal, it means that carbon intensity has to go down by 60-65%, non-fossil fuels as a share of energy structure have to go up to ${20}\%$ ; and forest sink has to increase by 4.5 billion square meters from the 2005 level.
1 Section 1
1.1 Chinese Industrial Sectors
Since economic reforms and opening-up initiated in 1978, China has been growing at almost double-digit rates for many years, which was fueled by the fast growth of the industrial sector. By 2011, the China’s total output of over 220 industrial products among 500 major ones were in the first place of the world. That would make China the world’s largest industrial country. In terms of the industrial structure, the second industry had long been in the dominate position before it was overtaken by the tertiary industry in 2012. During China’s 11th Five-Year Plan (FYP) (2006-2010), the ratio of heavy to light industries was 7:3, significantly higher than the current level and even surpass the highest level of many developed countries. ${}^{4}$
The secondary industry of China has been fueled by the rapid urbanization process in China. The urbanization rate of China was about ${18}\%$ in the late 1970s, it has reached 64% in 2020. Since the mid-1990s, heavy industries-automobiles, petrochemicals, and heavy-duty equipment, etc. -received massive government support at both the national and the local levels, reflecting China’s industrial policy at that time. After the worldwide financial crisis in 2008, however, the Chinese economy has been slowing down, and eventually entered a new period of which Chinese President Xi Jinping called the “New Normal”. ${}^{5}$ With the “New Normal”, real GDP growth rate of China has dropped dramatically-from an average of 10.76% in 2003-2011 to 7.2% in 2012-2017 (National Bureau of Statistics, 2018). Despite the growth of industrial value added has slow down, the industrial sector has remained its original scale in China. In 2020, the value added of the secondary industry was RMB 38,404 billion, accounting for 37.8% of China’s GDP (Fig. 1).
${}^{4}$ Starting in 2013, the National Bureau of Statistics (NBS) of China no longer uses light industries or heavy industries categorization. Instead, NBS uses a classification system that conforms to ISIC. See http://www.stats.gov.cn/tjsj/zxfb/201402/t20140224_514970.html.
${}^{5}$ The term “new normal” first came to public discourse during President Xi Jinping’s visit to Henan in May 2014. Under the “new normal”, the importance of growth speed is eclipsed by immensely complex structural reforms to transform the economy to one that relies more on the services sector, domestic spending and innovation, than manufacturing and exports. http://www.aisixiang.com/zhuanti/175.html.
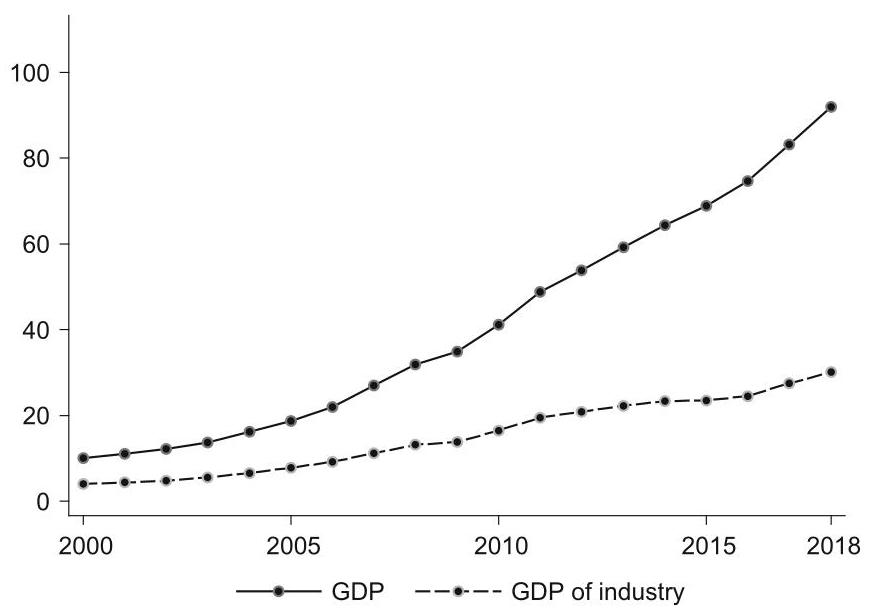
Fig. 1 Output of total economy and industry sector (RMB trillion). Source China Statistical Yearbooks
1.2 The Steel Sector
The steel sector plays an important role in the Chinese economy. China has been the world’s largest iron and steel producer since 1996. Crude steel production was 1.6 million tons in 1949 (when the People’s Republic of China was established), it surged to 804 million tons in 2015; on per capita basis, China reached ${586}\mathrm{\;{kg}}$ of steel production, about 2.6 times the world’s average, next only to South Korea. In the fleet of China’s iron and steel plants, huge disparities existed in production capacity, energy-saving technology, and product structure. Yet long-process iron/steel production remains the mainstream, whereas short-process steelmaking accounts for only about ${10}\% {.}^{6}$ Compared with the United States, the share of electric arc furnaces (EAF)—a short-process steel production—was 68% in 2018. ${}^{7}$ (Fig. 2).
The impact of the “New Normal” was tremendous on the China’s industrial sector, in particular on the steel sector-a topic that we will pick up and discuss further in Chapter 2. We emphasize here that the steel sector had confronted severe overcapacity issues. Capacity utilization rate in the steel sector fell from 88.7% in in 2006 to 64.8% in 2015. Since then, like many other resource- and energy-intensive industries, e.g., power and cement, the steel sector has been pushed hard to shift towards a quality-over-quantity and a low-carbon development path. Initial upgrading results were remarkable. Energy consumption per ton of crude steel produced decreased significantly from 605 to 527 kgce (kilograms of coal equivalent) during the 12th FYP (2011-2015), indicating a great improvement in terms of energy efficiency.
${}^{6}$ There are two processes in iron and steel production: a long process and a short process. The main difference is that the long process takes iron ore and coke as the main raw materials, melts them and then converts them to steel; while the short process uses scrap steel as a raw material to melt steel. More on iron/steel making will be discussed in Chapters 3 and 4 of this study.
7 World Steel in Figs. 2019, World Steel Association.
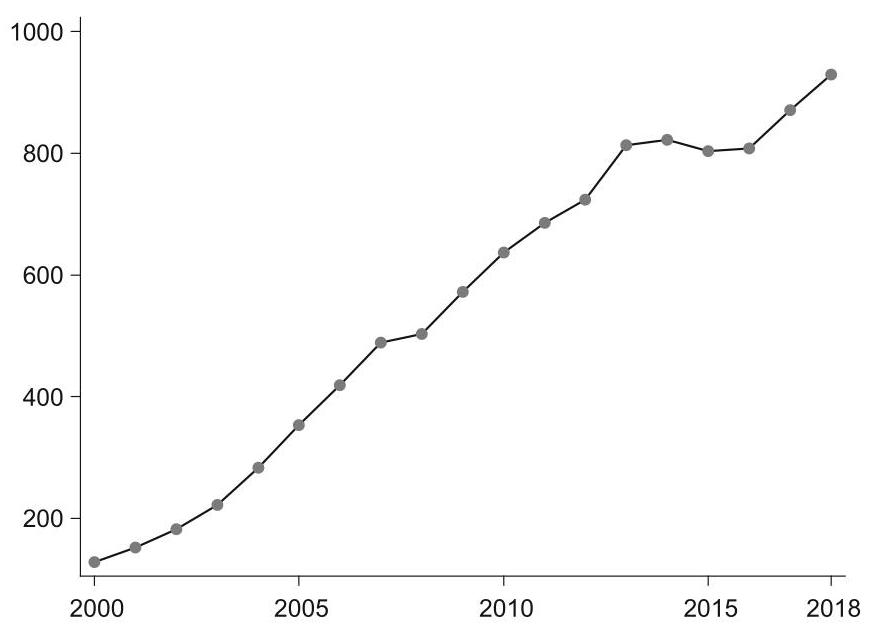
Fig. 2 Output of crude steel (million tons). Source Statistical Abstract of China
1.3 Energy Consumption and ${\mathrm{{CO}}}_{2}$ Emissions
In China, fossil fuels are still the primary source for energy and raw material supply utilized in the industrial sector such as power, cement, steel, petrochemicals, and etc.. Among various industrial activities, the iron/steel sector is one of the most energy- and coal-intensive sectors and emits a large amount of ${\mathrm{{CO}}}_{2}$ into the atmosphere, accounting for about ${15}\%$ of total industrial ${\mathrm{{CO}}}_{2}$ emissions in China, and about 60% of carbon emissions from global steel industries. When further breaking iron/steel sector down to detailed sectors, the power, steel and cement sectors in total represent over 75% of carbon emissions in China, generating ${45}\% ,{15}\%$ , and ${15}\%$ carbon emissions, respectively.
The increasing trends of energy consumption in China for the total economy, the industrial sector, and the steel sector are shown in Fig. 3.
Additionally, Fig. 4 depicts the trends of ${\mathrm{{CO}}}_{2}$ emissions in China for the total economy, the industrial sector and the steel sector.
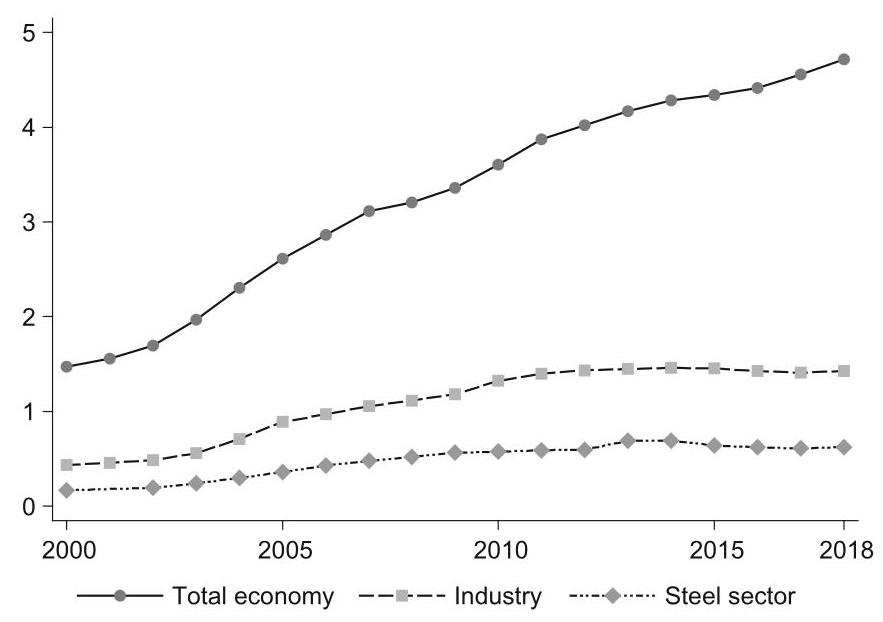
Fig. 3 Energy consumption in China (coal equivalent, billion tons). Source IEA (2020)
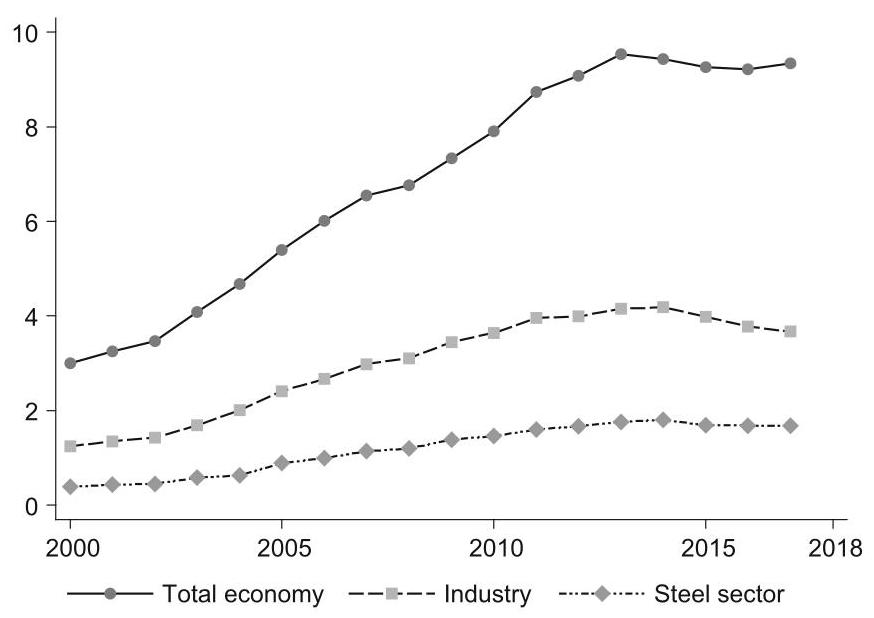
Fig. 4 ${\mathrm{{CO}}}_{2}$ Emissions in China (billion tons). Source Shan et al. (2018,2020)
During China’s 13th FYP (2016-2020), “low carbon” and “green” growth has been emphasized as a crucial policy goal, and a series of policy tools were launched to urge industrial firms to take action in saving their energy and cutting ${\mathrm{{CO}}}_{2}$ emissions. For the steel sector in particular, the de-carbonization strategy consists of following three paths: (1) optimization of processes, (2) phasing-out of inefficient capacities, and (3) deploying new technologies at energy conservation and emission reductions.
2 Section 2
2.1 Climate Policy in China: An Evolving Framework
China has made remarkable progress in mitigation and adaptation to climate change in the past decade. The 12th Five Year Plan (FYP) (2011-2015) has identified the low-carbon and green growth as a strategic pathway towards sustainable growth since. The policy framework, however, was not put into place overnight. It has been an evolving process. Indeed, a salient feature of that process was “testing it out before scaling it up” with a mixture of pilots, (special) policies, regulations, and economic incentives. In other words, the policy framework consists of both “sticks” and “carrots” (see Table 1).
Given the complexity of a country’s institution of political economy, reform policies have been involving and will continue to involve in various government departments, both hierarchical and horizontal. The top level often provides guidance, either ex ante or ex post. Action takes place at the bottom level. Successful stories, often not explicitly authorized by the government a priori, could provide basis for formulating new policies ex post. Here, the same logic seems to have applied to the formulation of policies for developing a low-carbon and green economy. The need for inter-agency coordination has been particularly salient.
For instance, to launch CCUS pilots would involve multiple authorities, including the National Development and Reform Commission (NDRC), the Ministry of Science and Technology (MOST), the Ministry of Industry and Information Technology (MIIT), the Ministry of Natural Resources (MNR), etc., each with its own distinctive focus. Whereas MOST may focus on the R&D aspects of CCUS, NDRC may be more concerned from the perspective of energy security and economic and social impact from mitigation. And a new ministry, the Ministry of Ecology and Environment (MEE), has been established in 2018 to better respond to challenges posed by climate change.
Table 1 Key elements of climate policy framework in China
| Policies with "sticks" | Policies with "carrots" | ||
| Laws and regulations (by central and local governments) | Incentives | ||
| 30 laws: | e.g., Climate Change Law | e.g., pricing; subsidies; loan | |
| 90 regulations: | e.g., Administrative Regulations on ETS | discounts; fiscal and tax support; access to special funds | |
| Administrative orders (by central governments) | Markets | ||
| e.g., Standards for GHG emissions from industries (by SAC); accounting and reporting methods for GHG emissions in key industries (by NDRC) | e.g., 7 regional ETS pilots; national ETS in power sector; CCERs (by NDRC) | ||
In particular, as mentioned at the beginning of this chapter, there has been a constant and interactive feedback channel between China’s international commitments and domestic policy-making in climate change. Under the UN Framework Convention for Climate Change (UNFCCC), in 2009, China had pledged to reduce carbon intensity of GDP by 40-45% by 2020 from the 2005 level, and increase non-fossil fuels as a share of its energy structure to about 15%. Subsequently, the concept of carbon intensity was incorporated into the China’s 12th FYP (2011-2015). Similarly, during the Paris Climate Change Conference in 2015, China pledged to peak carbon emissions around 2030, and reduce carbon intensity of GDP by 60-65% by 2030 from the 2005 level. These commitments were integrated into China’s 13th FYP (2016-2020). Now that China has pledged to peak ${\mathrm{{CO}}}_{2}$ emissions prior to 2030 and become carbon neutral in 2060, one would expect that the coming 14th FYP (2021-2025) will embody a number of policies aimed at peaking ${\mathrm{{CO}}}_{2}$ emissions prior to 2030, and begin to work toward achieving carbon neutral in 2060.
In what follows, we review some of the key policies, regulations, and laws, which together have fleshed out what has been and will continue to be an evolving policy framework for formulating a low-carbon and green economy in China, including the topic of CCUS as a negative carbon tool, in addition to low carbon and zero carbon technologies. In the process, among the complex and bewildering network of government agencies, we identify the key government departments tasked with green and sustainable growth in China.
2.2 A Nexus of Legislation, Regulation, and Policy
Currently there are about 30 laws and 90 regulations regarding the development of low-carbon and green economy in China (see Table 1). In 2011, for better synergic work in a complex network of government agencies, the National Leading Group for Climate Change Legislation was set up to coordinate the legislation on issues of climate change. The group is comprised of the Environmental Protection and Resources Conservation Committee, the Law Committee of the National People’s Congress (NPC), the Legislative Affairs Office of the State Council-China’s cabinet, and as many as 17 central government ministries.
Among the 17 central government ministries, the National Development and Reform Commission (NDRC) is tasked with spearheading the legislative process, including drafting of laws, e.g., the Climate Change Law and the Administrative Regulations on Carbon Emissions Trading.
Climate change-related legislation, regulation, and policy all tended to be very complicated. The making of China’s National Plan on Climate Change (2014- 2020) gives a good example of the complexity of the planning and implementation process. It involved not only many central government departments but also many local government departments. Indeed, setting ambitious but realistic targets is not an easy job. The effectiveness of policy impact is ultimately determined at the local levels rather than at the central level in Beijing. In other words, for policy implementation, there has to be a feedback channel in the political economy of central-local relations in China.
Indeed, the top-down and bottom-up approach was reflected in the way that China built carbon market, known as emission-trading system (ETS) in Europe. In China, the 12th FYP (2011-15) had provided for “gradually establishing a carbon emissions trading market”. In line with the 12th FYP, in 2013, NDRC officially launched seven regional ETS pilots in China, including Beijing, Shanghai, Hubei, Guangdong, Shenzhen, Tianjin, and Chongqing-a topic that will be examined further in Part III of this study. In the same year, NDRC also issued a Circular on Promotion of Experiment and Demonstration in Carbon Capture, Utilization and Storage (CCUS), aimed at promoting CCUS as an emerging technology for direct ${\mathrm{{CO}}}_{2}$ emission reductions. As both CCUS and ETS are important topics of this study, they will be explored in a more systematical way in Part II and III, we will skip further discussion here to avoid redundancy.
It is important to note that in China’s evolving policy framework for low-carbon and green growth, “administrative orders”, more ad hoc than legislation, play an important role. These policy instruments are particularly salient in the energy conservation and ${\mathrm{{CO}}}_{2}$ emission controls. Examples include performance thresholds, green procurements, safety standards, and industry thresholds. For instance, in 2015 the Standardization Administration of China (SAC) issued 11 national standards for GHG emissions from industries. The Ministry of Transport (MOT), the National Railway Administration (NRA), and the State Forestry Administration (SFA) also issued low-carbon standards. The NDRC provided accounting and reporting methods for GHG emissions in 23 key industries. The National Technical Committee on Carbon Management (NTCC) was responsible for formulating and revising national standards for the carbon management, which includes a system of low-carbon product certification launched in 2015.
2.3 Low-Carbon Policy for Industry
The industrial sector in China is a major energy consumer and ${\mathrm{{CO}}}_{2}$ emitter. ${}^{8}$ Key battles have to be fought there. Indeed, during the 12th FYP (2011-2015), China came up with a series of policies, with both “sticks” and “carrots”, all aiming at low-carbon and green growth. In the 12th FYP period, these policies came in the form of 10 plans, 9 programs, 13 opinions, 6 notices, and 8 decisions, measures and guidelines, which fall into six buckets: structural adjustment, standard development, regulatory instruments, economic incentives, market-based instruments, and policy guidance.
The mix of “sticks” and “carrots” of these policy instruments as whole seemed to have worked in reducing energy consumption and ${\mathrm{{CO}}}_{2}$ emissions. For example, while the share of energy-intensive industries declined, that of high-tech industries increased. In 2010, energy-intensive industries accounted for about 30.3% in terms of value added, by 2015, the comparable number was 27.8%, down by 2.5% from the 2010 level. In the process, a large amount of outdated production capacity was removed, including 91 million tons of iron, 95 million tons of steel, 657 million tons of cement, and 2 million tons of electrolytic aluminum. At the same time, energy efficiency was significantly improved. The energy consumption per unit of value added dropped by ${28}\%$ , representing 690 million tons of standard coal saved. In particular, six major industries—steel, nonferrous metals, petrochemicals, chemicals, building materials, and paper-making—narrowed the gap with their global leaders in terms of energy consumption per unit of products.
${}^{8}$ According to IEA classification of ’Industry’, in 2015 for example, industry sector alone accounted for ${43}\%$ of national energy consumption and ${52}\%$ of national carbon emissions.
2.4 Low-Carbon Policy for the Steel Sector
In 2006, under the United Nations Framework Convention on Climate Change (UNFCCC), China had pledged to the world to reduce energy intensity of GDP by 40-45% in 2020 from the 2005 level. Consistent with that pledge, during the 11th FYP (2006-2010), China had for the first time incorporated the concept of “energy intensity” into the national economic and social development plan. To promote low-carbon pathways, policy-makers started to set binding targets for energy conservation and energy efficiency and took proactive measures to adjust the industrial structure by inhibiting fossil-intensive industries. In the 12th FYP (2011-2015), carbon intensity of GDP was integrated into the national plan for economic and social development, and ${\mathrm{{CO}}}_{2}$ emission controls became an eye-grabbing issue especially for the steel sector.
In retrospect, a total of 36 key policies were issued for the iron/steel sector since 2006, including 12 during the 11th FYP (2006-2010), 17 during the 12th FYP (2011-2015), and 7 during the 13th FYP (2016-2020). These policy instruments can be categorized into five areas: structural adjustment, mandatory tasks, economic incentives, industry standards, and industry guidelines. And the policy making involved a long list of government departments, including the State Council, the NDRC, the Ministry of Industry and Information Technology (MIIT) (for the structural adjustment); the NDRC, the MIIT and the SAC (for the industry standards); the State Council, the NDRC, and the Ministry of Finance (MOF) (for economic incentives); and the State Council, the MIIT, the NDRC and local governments (for mandatory tasks).
While industry guidelines are not mandatory, they have the effect of encouraging industrial firms to shape or rather re-shape strategic planning, carry out R&D, and shift towards green-oriented circular economy via energy saving and technology upgrading, etc.
During the 11th FYP (2006-2010), the policy focus for the steel sector centered on structural adjustments, aiming to enhance energy efficiency, control overcapacity, and upgrade technology. Mergers and acquisitions (M&A) in the iron/steel sector were encouraged to improve industrial concentration. The results were significant. Under the combined policy implementation, 123 million tons of inefficient iron production capacity and 72 million tons of inefficient steel production capacity were phased out over the five years. They were replaced by large-scale modern facilitates. Among leading steel plants, the share of blast furnaces with over ${1000}{\mathrm{\;m}}^{3}$ capacity increased from 48 to ${61}\%$ , and that of converters with over 100 tons capacity increased from 45 to 57%. By 2011, energy consumption per ton of iron dropped to 605 kgce (kilograms of coal equivalent), down by 12.8%, as compared with that in 2005. Table 2 summarizes key targets of FYPs (Five Year Plans).
Table 2 Key targets of FYPs
| 11th FYP (2006-2010) | 12th FYP (2011-2015) | 13th FYP (2016-2020) | |
| International pledges | Reduce carbon intensity of GDP by 40-45% in 2020 from the 2005 level; increase non-fossil to 15% | Reduce carbon intensity of GDP by 60-65% in 2030 from the 2005 level | Peak carbon emissions prior to 2030, and achieve carbon neutrality by 2060 |
| Domestic regulatory moves | Mergers and acquisitions in steel sector and energy conservation encouraged | Industrial standards and access to steel sector raised; pilot ETS launched | MOF offered supportive policies to steel sector; 25-member inter-ministerial joint conference set up with approval of SC to address overcapacity; national ETS started |
| Formation of carbon market | None | 7 regional ETS pilots launched in 2013. They cover many industries, including steel sector | National ETS in 2017, covering only power sector |
During the 12th FYP (2011-2015), “low carbon” was identified as a principal objective for the steel sector, and the target of ${18}\% {\mathrm{{CO}}}_{2}$ emission reduction per unit of value added was set. To this end, industrial standards and access to the sector were raised and new targets were set to further phase out inefficient facilities. As a result, a total of 90.89 million and 94.86 million tons of inefficient iron and steel production capacity were slashed off respectively, although overcapacity continued to exist. Crude steel capacity utilization, for instance, was down from 79 to ${70}\%$ , and the debt rate of large and medium-sized firms exceeded 70%. In the meantime, although the energy consumption per ton of steel declined from 605 to 572 kgce, it was not adequate to offset the net increase of energy consumption with continued production expansion in the sector.
Efforts for a low-carbon economy had intensified in the 13th FYP (2016- 2020). Due to an integral part of quality-over-quantity growth strategy, supply-side reforms were highly emphasized on the agenda of the 13th FYP. In line with this, the overall policy on the steel sector tightened up, where the cumulative reduction in its production capacity was up to 100-150 million ton (including 90 million tons of outdated production facilities). To facilitate the low-carbon economy process, in addition to “sticks”, “carrots” were also offered. The MOF issued several policy documents, covering fiscal and tax supports, subsidies, employee relocation benefits, land use, etc. In addition, a mechanism of coordination of 25-member inter-ministerial joint conference was set up with the approval of the State Council. The policy goal was to solve the issue of overcapacity in iron, steel, and coal production.
The 12th FYP had provided for “gradually establishing a carbon emissions trading market”. Along with the experiences of the seven regional ETS pilots launched in 2013, during the 13th FYP (2016-2020), China has started the process of building national carbon market by the end of 2017. According to the 2015 China-US Joint Presidential Statement on Climate Change, the national ETS in China would cover some major polluting industries, like steel, electricity, chemicals, building materials, paper-making, and non-ferrous metals. Yet, when China first kicked off the national ETS in 2017, the national ETS only covered the power sector, with the expectation that other industrial sectors would eventually be included into the unified national ETS. At the same time, China has adopted a two-track system of ETSs—a national ETS and seven regional ETS pilots. The former covers only the power sector, whereas the latter covers a wider range of industrial sectors. Some have included the steel sector. Such heterogeneity may reflect the regional diversity of China in sectorial and industrial structures.
3 Section 3
3.1 Climate Policy Regarding CCUS: A Global Perspective
In 2018, the Intergovernmental Panel on Climate Change (IPCC) issued the Special Report on Global Warming of ${1.5}{}^{ \circ }\mathrm{C}$ (SR15). The Report warns that the impact of above ${1.5}^{ \circ }\mathrm{C}$ of global warming will spell disasters to the ecosystem on Earth, and highlights the urgency for the global community to undertake ${\mathrm{{CO}}}_{2}$ emission reductions with best available technologies (BATs). In this context, the International Energy Agency (IEA) takes carbon capture, utilization and storage (CCUS) as an integral part of the lowest cost route to achieving climate targets (IEA, 2019b; IPCC, 2018), and removing CCUS from the BAT portfolio would lead to a doubling of costs in the future-the biggest rise in costs from excluding any technology.
While many governments have recognized the role of CCUS as an emerging technology for direct reduction of carbon emissions on industrial scale, actions in terms of policy supports are yet to come. Indeed, many are watching and waiting, given the fact that globally CCUS is still in nascent state with many uncertainties and risks, leading to an investment dilemma. A higher perceived risk means a higher rate of return expected, but making the funding process more difficult. The immediate challenge is that while an operational CCUS project may capture millions of tons of ${\mathrm{{CO}}}_{2}$ emissions per year, it requires hundreds of millions of dollars for an initial investment. As a result, funding has been a big barrier to the development of CCUS. That said, in the past few years, six countries-the US, the UK, Canada, Norway, Japan, and China-have stood out as CCUS leaders in the field (IEA, 2019b).
In what follows next, to better understand where China stands in terms of policy and practice in the field of CCUS, let us take a global fieldtrip first, looking at climate policies and CCUS projects in different countries/regions around the world. After the tour, we will come back to China in Section 4 for reviewing its policy and practice with respect to CCUS-a strategical reserve technology under development in its efforts of mitigation and adaptation to climate change down the road.
3.2 A Global Fieldtrip
The United States
As early as in 2006, the US Climate Technology Program had suggested controlling GHG emissions through CCUS. Accordingly, the US Carbon Capture and Storage Early Deployment Act (2009) encouraged the early deployment of CCUS, and the American Clean Energy Leadership Act (2009) further clarified the regulatory framework and financial assistance for CCUS. In its Clean Power Plan, the carbon emission standards pushed forward low-carbon technologies and gave strong impetus to mitigation in the power supply sector. As CCUS technology remains high on the learning curve, incentives focus on providing for early stage initiatives and reducing long-term uncertainty.
Specifically, the Department of Energy (DOE) incentivized CCUS demonstration projects in the industrial sector with US$ 1.52 billion in the deployment funding, derived from the 2009 American Reinvestment and Recovery Act. Section 45Q of the Internal Revenue Code also provided for carbon sequestration tax credits. Section 45Q gave $20 tax credit per ton of ${\mathrm{{CO}}}_{2}$ captured and stored, and $10 per ton of ${\mathrm{{CO}}}_{2}$ captured and used for enhanced oil recovery (EOR). In 2018, the United States Congress further increased tax credit to $\$ {35}$ per ton of ${\mathrm{{CO}}}_{2}$ sequestered through EOR and to \$50 per ton of geological sequestration if the project begins construction by 2024, which help to encourage the early deployment of CCUS. The value of up to $50 per ton of ${\mathrm{{CO}}}_{2}$ over the next five years is expected to spur a new round of CCUS facilities (Department of the Treasury, 2018).
In the United States, there are a lot of local actions at the state level as well. For example, after California passed its legislation on zero-carbon energy mandate and carbon neutrality by 2050 target, other states followed suit. Louisiana, Montana, North Dakota, and Texas have also offered tax incentives for the deployment of CCUS (Clean Air Task Force, 2019).
So far, the United States has the largest CCUS facility in the world, with a cumulative capture and injection capacity of more than 150 million tons. Of the 18 operating CCUS facilities worldwide, 10 are located in the US (including a CO2 injection capture facility in Canada) (Global CCS Institute, 2019). Among these, the largest is the Century Natural Gas plant and CCUS plant in Texas, with an annual capacity of 8.4 million tons, followed by the Shuter Creek CCUS facility, which has an annual capacity of 7 million tons. The industrial CCS facility in Illinois reached the million-ton mark by extracting ${\mathrm{{CO}}}_{2}$ from an ethanol plant run by Archer Daniels Midland and storing ${\mathrm{{CO}}}_{2}$ deep underground near the plant.
The Petra Nova is the only large CCUS power plant in the United States, and one of the only two in the world. The plant uses post-combustion capture technology to extract ${90}\%$ of ${\mathrm{{CO}}}_{2}$ emissions from the flue gas of the generator set. The facility captures up to 1.4 million tons of ${\mathrm{{CO}}}_{2}$ emissions on a yearly basis.
Canada and South America
Across the Americas, interest in CCUS remains high. Indeed, more than 10% of Canadian government R&D spending has been directed toward CCUS since 2010. Since then, the country has aimed to drive the development of CCUS through both grant support and emission performance standard. At the provincial level, Alberta and Saskatchevan have a royalty relief protocol for ${\mathrm{{CO}}}_{2}$ -EOR, and British Columbia has a carbon tax of US$ 30/ton ${\mathrm{{CO}}}_{2}$ from anthropogenic combustion emissions.
Under the Canadian Sustainable Growth and Climate Action Plan, each Canadian province and territory is required to submit to the federal government with a summary of its carbon pricing plan. Costs must start at Canadian $10 (or more) per ton of ${\mathrm{{CO}}}_{2}$ and rise to Canadian $50 per ton by 2022. The federal carbon pricing scheme took effect in January, 2019, and all direct carbon pricing revenue will return to the jurisdiction of origin (Government of Canada, 2008).
In the Americas, through the Canada Strategic Innovation Fund, several milestones were set as the Canadian government. They has invested $25 million in Carbon Engineering (a Canadian Direct Air Capture company), in partnership with some private firms such as BHP, Chevron, and Occidental. Since 2013, the Petrobras Santos Basin Pre-Salt Oil Field CCS has been on-site to separate and capture ${\mathrm{{CO}}}_{2}$ as part of natural gas extraction. Deploying EOR (enhanced oil recovery) technology, the captured ${\mathrm{{CO}}}_{2}$ is injected directly into the natural gas field. The Boundary Dam CCUS project has the capacity to captures about $1\mathrm{M}$ tpa ${\mathrm{{CO}}}_{2}$ from a coal-fired power plant and use part of it for EOR purposes at the Weyhurn oil field, with a small proportion for dedicated geological storage. The Quest CCUS facility, a joint venture of Shell (60%), Chevon (20%) and Marathon Oil (20%), captures, transports, and stores over $1\mathrm{{Mtpa}}$ of ${\mathrm{{CO}}}_{2}$ .
Elsewhere, coal and gas power plants, as well as stakeholders in the ethanol market, are keen to speed up CCUS development. In Mexico, there are two CCUS pilots- ${\mathrm{{CO}}}_{2}$ Capture Pilot Project and ${\mathrm{{CO}}}_{2}$ -EOR and Sequestration Pilot-underway with the support of the CCUS Trust Fund of the World Bank. These CCUS projects were expected to begin operation in 2020.
The European Union
As early as in 2006, the Green Paper: A European Strategy for Sustainable, Competitive and Secure Energy was issued by the European Union (EU). The Green Paper identified CCUS as one of the three policy priorities to address the challenge associated with energy security and climate change. In addition, the European Strategic Energy Technology Plan (SET-Plan) published in 2007 proposed a dedicated policy to accelerate the development and application of low-carbon technologies.
With respect to CCUS technology, the EU CCS Directive specifically dedicates Articles 13 and 16 to the issue of leakage, and the Recommended Practice: Design and Operation of ${\mathrm{{CO}}}_{2}$ Pipelines of Det Norske Veritas makes provisions for monitoring tools and incident response. In addition, the EU’s Seventh Framework Program for Research and Technological Development released in 2007 proposed funding projects related to CCUS and sets aside 300 million EU ETS (Emission Trading System) allowances to support 10-12 CCUS projects. Moreover, the EU Comprehensive Climate and Energy Package of 2009 set specific targets for ETS and CCUS, as well as for renewables as share of energy consumption to increase to 20% and to cut GHG emissions by 20% by 2020 from the 1990 level.
In 2018, in its Clean World for All-A Long-term European Strategic Vision for a Stable, Modern, Efficient and Climate-Neutral Economy, the European Commission (EC) unveiled its plan for Europe to achieve carbon neutrality by 2050 (European Commission, 2018). To achieve that goal, both ETS and CCUS have a strategic role to play. In terms of ETS, based on new research on EU-ETS, the EU beeefd up its market stability reserves and was ready to accelerate emission reductions. More specifically, from 2021, the EU will reduce total emission allowances at an annual rate of 2.2%, as compared with the current rate of 1.74%. In terms of CCUS, a €10 billion Innovation Fund was set up, with an aim to speed up the development of CCUS projects. CCUS was expected to contribute anywhere from 52 million to 6.06 million tons of ${\mathrm{{CO}}}_{2}$ per year by 2050 under different scenarios.
In recent years, significant changes have taken place in the way the CCUS project is designed in Europe. The new emphasis is on integrated and full chain solution rather than individual transportation from ${\mathrm{{CO}}}_{2}$ source to storage site. Shared infrastructure for ${\mathrm{{CO}}}_{2}$ transport and storage sites can reduce unit costs across the CCUS value chain. As a result, most CCUS projects in Europe are designed as an integral part of industrial clusters with hubs and spokes. These CCUS-dedicated industrial clusters are expected to be established in several major industrial areas of Europe: the ports of Antwerp in Belgium, Amsterdam and Rotterdam in the Netherlands, Humber and Teesside in the UK (Global CCS Institute, 2016).
The United Kingdom
In the UK, the Stern Report in 2006 provided a basis for meeting energy challenge and developing CCUS. In its wake, the White Paper on Energy in 2007 put forward process-wide CCUS demonstration in power plants across the country. Further, the Energy Act of 2008 provided a framework for licensing, enforcement and registration of storage sites. The world’s first Climate Change Act of 2008 incorporated CCUS into the emission reduction plan for the power industry.
From the perspective of the UK government, CCUS is taken as an important technology in its strategy to transit to a low-carbon economy, and the government therefore provides tax supports to facilitate this strategic transition. Accordingly, the UK Climate Change Levy stipulates that the electric power enterprises enjoy an 80% tax relief as long as they reach certain targets for energy efficiency and emission reduction through CCUS applications. As a part of its Clean Growth plan, the UK government has also pledged to invest $100 million in innovation in CCUS to reduce costs, as well as to pursue international cooperation opportunities.
In 2019, based on the recommendation by the UK Committee on Climate Change, the UK government set the goal of achieving carbon neutrality by 2050. To facilitate decarbonization, CCUS was identified to play an important role in the process. In March 2019, the UK government set up the CCUS Advisory Group-composed of experts from the business, finance and legal professions-to identify current bottlenecks facing CCUS development (CCUS Advisory Group, 2019). Apart from business models that propose to diversify funding mechanisms of CCUS investment, the Advisory Group also recommended the reuse or repurpose of the existing infrastructure in the country, aiming to reduce ${\mathrm{{CO}}}_{2}$ transportation and storage costs.
Earlier in 2018, the UK government had announced that it would create its first net-zero carbon cluster in the North-East of England by 2040. The cluster aimed to capture six million tons of carbon emissions on a year basis from a gas-fired power plant and other industrial sources and was expected to start operation by 2030. (European Commission, 2019). Beyond CCUS, Drax, the UK’s largest power station, has been conducting tests of the BECCS project and has proposed a local hydrogen and CCS network. A large hydrogen and CCUS center were under plan at St Fergus in Scotland—a good location to add hydrogen directly to the power grid, since 35% of UK’s gas comes from onshore. In 2018, the project took step forward when the Oil and Gas Authority-the UK’s independent regulator and licensing authority for offshore ${\mathrm{{CO}}}_{2}$ storage-issued the first ${\mathrm{{CO}}}_{2}$ assessment and storage license (Committee on Climate Change, 2018).
Norway
Carbon taxes have been applied in a number of Nordic countries, but only Norway has effectively applied a carbon tax to trigger its CCUS investment. As early as in 1991, Norway introduced a carbon tax on carbon emissions from oil and gas production facilities. This move eventually led to two ${\mathrm{{CO}}}_{2}$ storage projects, Sleipner and Snøhvit, both operated by the Norwegian oil companies Statoil. In 2008, the EU ETS included Norway’s offshore oil and gas production emissions, which means that the operators of these facilities must also surrender one EU allowance (EUA) for every ton of ${\mathrm{{CO}}}_{2}$ emitted. But if the ${\mathrm{{CO}}}_{2}$ can be permanently stored, both the tax and EU ETS liabilities can be avoided, which provides powerful incentives to spur CCUS development. Consequently, Norway has been a major player in the global CCUS industry, reducing more than 20 million tons of ${\mathrm{{CO}}}_{2}$ through geological sequestration over the past two decades. Sleipner and Snøhvit are the first companies in the world to store ${\mathrm{{CO}}}_{2}$ emissions offshore and the only large-scale operational CCS facility in Europe.
There is also a major CCS proposal that would involve capturing and transporting ${\mathrm{{CO}}}_{2}$ for offshore storage from multiple industrial facilities in Europe. The proposed facility will be operated by Equinor in partnership with Shell and Total, and it will ship and store ${\mathrm{{CO}}}_{2}$ mainly from northwest Europe (IEA,2016). FEED research (front-end engineering design) has been doing feasibility studies, and a drilling operation is planned to examine the Norwegian continental shelf for ${\mathrm{{CO}}}_{2}$ sequestration. Based on past success with the large-scale CCS deployment, the Norwegian government intends to use the proposed project as a catalyst for a wider CCS implementation in Europe (Overa, 2019).
Indeed, the Norwegian government has rich experience in the CCUS industry. To illustrate, the government had set up Gassnova, a state-owned enterprise, which has represented the country’s investment as a shareholder of Technology Center Mong-stad, or TCM. TCM is the world’s largest center for testing and developing CCUS technologies. It has the capacity to capture up to 100,000 tons of ${\mathrm{{CO}}}_{2}$ emissions on a yearly basis, and has participated in the first full-scale CCUS project in Norway.
Middle East and Central Asia
There is a growing recognition in the Middle East that CCUS will play an important role in supporting energy demand and shifting to clean energy. Indeed, led by Saudi Arabia and the United Arab Emirates (UAE), each country in the region has a large CCS facility. Whereas Abu Dhabi extracts ${\mathrm{{CO}}}_{2}$ from steel production, Saudi Arabia extracts ${\mathrm{{CO}}}_{2}$ from natural gas production with EOR technology. Abu Dhabi National Oil Company (ADNOC) has recently announced that ${\mathrm{{CO}}}_{2}$ emissions will be reduced by 10% by 2023, and ADNOC also plans to scale up CCS deployment in the next 10 years to capture 5 million tons of ${\mathrm{{CO}}}_{2}$ emissions by 2030 (Adnoc, 2019).
In 2019, Qatar announced that it plans to capture and store 5 million tons of ${\mathrm{{CO}}}_{2}$ emissions from its facilities by 2025 (Zawadzki &Kravtsova,2019). Qatar Petroleum also announced that it will build the largest CCS-EOR capture and storage facility in the Middle East and North Africa, with a capacity of 2.1 million tons of ${\mathrm{{CO}}}_{2}$ (Aljazeera,2019). Saudi Arabia and the UAE are members of the Ministerial Meeting on Innovation Tasks and Renewable Energy. Both countries have pledged to double public investment in the renewable energy research and development, and are active participants in the clean energy ministerial CCUS initiative.
Central Asia is one of the world’s most energy-intensive economic zone, and it will face enormous challenges to decarbonize the region’s energy system and to meet global climate goals. For example, in Kazakhstan, coal, oil, and natural gas have provided 98% of the country’s primary energy supply (IEA, 2019a). Given the country’s significant coal reserves and dependence on mining, Kazakhstan has a strong interest in CCUS technology. Eurasia Resources Group (ERG), a natural resources company, is currently studying how CCUS can be used to reduce ${\mathrm{{CO}}}_{2}$ emissions from generating electricity from fossil fuels. The preliminary proposal is to retrofit a coal-fired power plant with a ${20}\mathrm{{mt}}/$ year capacity via a CCUS pilot.
Asia Pacific
Over half of the world’s total ${\mathrm{{CO}}}_{2}$ emissions come from the Asia-Pacific region. The Asia-Pacific economies also produce over half of the world’s most emission-intensive commodities, such as iron, steel, and cement (Global Cement, 2017). Many countries, particularly in South-East Asia, already have and are planning to have more fossil-fuel power plants, and these plants will have a life cycle of decades ahead of them. With the inertia to develop a low-carbon strategy and the lack of an effective legal framework to promote investment in CCUS, the challenge to decarbonize these economies would seem to be enormous. That said, it is encouraging to note that in 2019, the Asia-Pacific region is a home to 12 large CCUS facilities in operation or at various stages of development (GCCSI, 2019).
Japan
In Japan, the Act on Promotion of Global Warming Countermeasures of 1998 stipulated that the control of carbon emissions is the shared responsibility of governments, businesses and the general public. Recognizing the importance of low-carbon technologies, the Japanese government supports research on nuclear power, energy efficiency, renewable energy, and clean fossil energy utilization, including CCUS application. Japan’s efforts to develop CCUS has received the policy support and guidance of the Ministry of Economy, Trade, and Industry (METI) and the Ministry of the Environment (MOE).
In 2012, the METI decided to carry out a CCS pilot in Tomakomai City, Hokkaido Prefecture. Earlier, the initial preparation work was commissioned by METI to Japan CCS Co (or JCCS) founded in 2008, which can be regarded as a special purpose vehicle (SPV) explicitly dedicated to the development of CCUS (Japan CCS, 2018). By way of the SPV, the Japanese government funded extensive studies on the various aspects-economic, social, environmental, and legal-of CCUS project, including possible ${\mathrm{{CO}}}_{2}$ storage sites. On the basis of JCCS experience, in 2019, the Japanese government announced its long-term plan to decarbonize its economy under the Paris Agreement. In the plan, CCUS was taken as an important mitigation technology, and the Japanese government decided to work with the private sector as well as other governments to implement a series of initiatives aimed at reducing obstacles to the commercial deployment of CCUS technologies (GCCSI, 2015, 2019).
One example of the Japanese government working to commercialize CCS is the Hydrogen Supply Chain program (HESC). The HESC pilot has involved a number of private businesses, e.g., J-Power, Iwatani, Kawasaki Heavy Industries, Marubeni, Sumitomo, and AGL. The pilot aims to demonstrate hydrogen production from coal with CCS. The construction of the gasifier began in November 2019 in Latropus Valley, Australia, and the project was expected to provide the first batch of hydrogen by 2021. If successful, it was hoped, the demonstration could lead to investment decision around the mid-2020s.
Australia
Australia has a good prospect for CCUS applications, with sound legal and regulatory framework and large geological storage capacities. By making renewable energy and low-carbon technologies available for the same investment opportunities, in 2017, the Amendment to the Clean Energy Finance Corporation (CEFC) further removed barriers to CCUS investment. In Australia, CEFC is a government agency charged with overseeing a US$10 billion clean energy plan (GCCSI, 2019).
In 2019, Australia announced that it would build the country’s largest and the world’s 19th major CCUS project with EOR technology. When fully operational, the project will have a ${\mathrm{{CO}}}_{2}$ storage capacity of 3.4-4 Mt/year-the largest dedicated geologic sequestration facility in the world. As a result, the Latropus Valley has been gaining momentum around the Hydrogen Supply Chain program (HESC) in collaboration with the Japanese government and private firms. Besides, Carbon Net in Victoria, Australia, has also been conducting feasibility studies to develop a commercial CCUS transport and storage site.
India
India, the world’s second-largest energy producer, saw carbon emissions increase by 4.8%, and coal consumption increase by 5% in 2018. However, the IEA has predicted that in a clean energy scenario, India can account for 20% of global industrial ${\mathrm{{CO}}}_{2}$ emissions captured and sequestered by 2060. As such, CCUS has an important role to play in India in the years ahead (IEA, 2019b).
For example, Dalmia Cement, an Indian company, has announced that the company will achieve carbon negative by 2040, and that the company takes CCUS as one of the pathways to achieve this goal. In 2019, the company announced that it will build a large CCUS facility in Tamil Nadu, with an annual capacity to capture 500,000 tons of carbon emissions. To implement the plan, the company has been working with Carbon Clean Solutions, which will provide CCUS technology for the project. The company is also considering multiple carbon capture facilities for source-sink optimalization.
We end our global tour here. Table 3 highlights some of the key elements of the policy or legal framework for CCUS in the major regions/countries that we have just visited before heading back to China.
Table 3 CCUS Regulatory Framework in Major region/countries
| Stage | Legal action | Examplar legislation | |
| EU | Identification | Identify CCUS as a preferred option to tackle climate change | e.g., via Green Paper: A European Strategy for Sustainable, Competitive and Secure Energy (2006) |
| Finance/Commercialization | Provide finance to CCUS projects and studies | Climate and Renewable Energy Package (2008) | |
| Institutionalization | form world's first detailed legislation on CCUS | CCUS Directive 2009/31 (2009) | |
| UK | Identification | Implement CCUS demonstration in power plants | Meeting the Energy Challenge: A White Paper on Energy (2007) |
| Finance/Commercialization | Identify CCUS as an important technical choice for electric power industry | Climate Change Act (2008) | |
| Institutionalization | include provisions on agreeing and using CCUS technologies | Energy Act (2010) | |
| US | Identification | Plan to control GHG emissions through capture and storage | Climate Change Technology Program (CCTP) (2006) |
| Finance/Commercialization | update Safe Drinking Water Act by including injection wells purely for carbon sequestration | Bill for Regulation for Underground Storage of Carbon Dioxide (2008) | |
| Institutionalization | provide ownership of stored gas and responsibility of transfer after CCUS projects shut down | House Bill to Include Carbon Storage Act into Legal System (HB259) (2010) |
(continued)
Table 3 (continued)
| Stage | Legal action | Examplar legislation | |
| Australia | Identification | Establish unified | Regulatory Guiding |
| CCUS framework | Principles for Carbon | ||
| within jurisdiction of | Dioxide Capture and | ||
| Australia | Geological Storage (2005) | ||
| Finance/Commercialization | N.A | N.A | |
| Institutionalization | provide legality of offshore storage of ${\mathrm{{CO}}}_{2}$ | Offshore Petroleum and Greenhouse Gas Storage Act (2006) |
4 Section 4
4.1 Reality Check on CCUS in China
Climate change is increasingly becoming the focus of China’s developmental agenda in the past decade, so that the issue has been elevated to “the construction of eco-civilization” described by the Chinese government in many of its official documents.
In 2018, the Chinese central government set up a new and dedicated ministry, the Ministry of Ecology and Environment (MEE), and a big part of the new ministry’s mission has to deal with the challenge of climate change. Apparently, even if GDP growth was the top concern previously, the measurement is no longer enough. Now the indicators of carbon intensity must be taken into account in the GDP growth, since the single-minded GDP growth will destroy the ecosystem on Earth. As reflected by the evolving policy framework for low-carbon and green growth punctuated by the country’s FYPs, the trend has been clear: as the economy grew as a share of the world’s total, so does its mitigation and adaptation efforts. So far, the general contour is marked by three milestones: 2020 (carbon intensity); ${}^{9}$ 2030 (carbon peak) ${}^{10}$ ; and 2060 (carbon neutral).
${}^{9}$ In 2009, China had pledged that it would lower carbon intensity of GDP by 40-45% by 2020 from the 2005 level. By the end of 2019, China had successfully surpassed that target by achieving a 48.1% reduction in carbon intensity of GDP. During the same period, non-fossil fuels as a share of its energy structure rose from 7.4% in 2005 to 15.3% in 2019. Based on this success, China has pledged to reduce carbon intensity of GDP by 65% by 2030 from the 2005 level, and to increase non-fossil fuels as a share of its energy structure to 25% by 2030. ${}^{10}$ By comparison, the EU peaked ${\mathrm{{CO}}}_{2}$ emissions in 2006 and the US in 2007. As part of its NDCs (nationally determined contributions) under of Paris Agreement, of late China has
Currently China produces close to one third of the world’s ${\mathrm{{CO}}}_{2}$ emissions and urgently needs to reduce them. The Chinese government has viewed CCUS as a promising or strategic reserve technology for the direct abatement of ${\mathrm{{CO}}}_{2}$ emissions on large industrial scale, ${}^{11}$ and as such, the government has already put in place a workable regulatory and policy framework to shape its development. As it shown in Table 4, while there is no law dedicated to CCUS in China, CCUS projects are nonetheless regulated by new and relevant policies and existing laws, which, collectively and/or individually, cover the various aspects of CCUS projects. In the life cycle of a CCUS project, these aspects would include project approval, ownership, operation, environmental protection, safety standard, and closure process.
To see how these seemingly separate laws and policies work, let us elaborate on the process by setting up an imaginary CCUS project in China. The proposal for setting up such a project will go through the Construction Law and the Administrative Licensing Law to get project approval. Then ownership of the project will get recognized under the Property Law, the Land Management Law, as well as the Contract Law. While the project is in operation, the ${\mathrm{{CO}}}_{2}$ capture is under the purview of the Production Safety Law; ${\mathrm{{CO}}}_{2}$ transport is governed by the Highway Law, the Law on Protection of Oil and Gas Pipelines, as well as the Road Transport Regulations; and ${\mathrm{{CO}}}_{2}$ storage and utilization fall within the purview of the Mineral Resources Law. Meanwhile, the CCUS project has to comply with a variety of environment and safety regulations, such as the Environmental Impact Assessment Law, the Labor Law, the Production Safety Law, the Tort Liability Law, the Regulations on Hazardous Chemicals, and the Regulations for Safety and Supervision of Pressure Pipelines, etc. In the event that the CCUS project causes environmental damage or degradation, the Environmental Protection Law or the Marine Environmental Protection Law will be invoked.
According to the Global Carbon Capture and Storage Institute (GCCSI), by the end of 2016, there were a total of 38 large-scale integrated projects (LSIPs). ${}^{12}$
pledged to peak ${\mathrm{{CO}}}_{2}$ emissions prior to 2030. In addition, carbon intensity of GDP will drop to 65% from the 2005 level; 6 billion ${\mathrm{m}}^{3}$ of forest will be added to the 2005 level; non-fossil fuels, as a share of its energy structure, will increase to 25%; and capacity of wind and solar power will increase to 1.2 billion kw by 2030.
11 Integrated with other technologies, CCUS may neutralize ${\mathrm{{CO}}}_{2}$ emission, or may remove ${\mathrm{{CO}}}_{2}$ from atmosphere, thus contributes to carbon neutrality, or even negative emission.
12 Large-scale integrated projects (LSIPs) refer to large-scale projects that integrate carbon capture, transport and storage, with an annual capture capacity of 800,000 tons for coal-fired power plants and with an annual capture capacity of 400,000 tons for other emissions-intensive sources.
Table 4 Policy Framework for CCUS development in China
| Authority | Dedicated Policy Documents | Year |
| MOST | Science and Technology Road map of China's CCUS Development | 2011 |
| MOST | National Special Plan for CCUS Technology Development in 12th FYP | 2013 |
| NDRC | Notice on Promoting CCUS Experiment and Demonstration | 2013 |
| MEPC | Notice on Strengthening Environmental Protection of CCUS Pilot Demonstration Projects | 2013 |
| Relevant Policy Documents | ||
| State Council | National Guideline on Medium- and Long-term Program for S&T Development (2006-2020) | 2006 |
| MOST | China's National Climate Change Program | 2007 |
| MOST | National S & T Actions on Climate Change | 2007 |
| MOST | National Plan for S & T Development (12th FYP) | 2011 |
| State Council | Working Plan on GHG Control (12th FYP) | 2011 |
| NDRC | Coal Industry Development (12th FYP) | 2012 |
| State Council | Energy Development Plan (12th FYP) | 2013 |
| State Council | Opinions on Accelerating the Development of Energy Saving and Environmental Protection Industry | 2013 |
| NDRC | National Key Low-carbon Technology Catalogue (I) | 2014 |
| NDRC | National Plan on Climate Change (2014-2020) | 2014 |
| State Council | Enhanced Actions on Climate Change: China's Nationally Determined Contributions | 2015 |
| NDRC | National Key Low-carbon Technology Catalogue (II) | 2015 |
| MEE | Opinion to Promote Super Low Emission in Iron/Steel Sector; Guideline for Super Low Emissions in Iron/Steel Sector | 2019 |
| MEE | National Measures for the Administration of Carbon Emissions Trading (for Trial Implementation) | 2021 |
Among them, 15 projects became operational and captured more than 29 million tons of ${\mathrm{{CO}}}_{2}$ . While most LSIPs are in the United States and China, those already in operation are mostly in the United States and Canada, and they mostly involve natural gas and coal-fired power plants. Likewise, most CCUS pilots in China are targeted at energy and coal-fired power plants, and none has existed in the steel sector so far. However, unlike the United States where Section 45Q of the Internal Revenue Code has been a potential tool to encourage CCUS development, in China, government supports thus far have been mainly targeted at R&D of CCUS pilots and mostly by the Ministry of Science and Technology (MOST). The latest Road Map for CCUS in China was released in May 2019. Recognizing the important role of CCUS as part of the country’s strategy for low-carbon and green growth, the road map sets out medium- and long-term goals and objectives for achieving low-carbon transformation through affordable, feasible, and reliable CCUS technologies (Asian Development Bank, 2015).
In 2019, China has one large LSIP project in operation, two under construction, and five in early stage of development. The CNPC Jilin Oilfield ${\mathrm{{CO}}}_{2}$ -EOR demonstration, with a total injection capacity of 1.12 million tons, was the first LSIP in operation in China and the world’s 18th LSIP facility. Since 2007, the Sinopec Zhongyuan Oilfield has been injected with ${\mathrm{{CO}}}_{2}$ from a nearby chemical plant with an annual capacity of 100,000 tons. The Dunhua Methanol Plant, which began operation in 2015, could collect 100,000 tons of methanol on a yearly basis. These were all SOEs (state-owned enterprises). In terms of ownership, the Xinjiang Dunhua Petroleum Technology Co. was about the only private company deploying ${\mathrm{{CO}}}_{2}$ -EOR technology in China.
After over a decade of R&D in CCUS technology, China has made remarkable progress in low-concentration ${\mathrm{{CO}}}_{2}$ capture, manufacturing of the carbon capture equipment, ${\mathrm{{CO}}}_{2}$ enhanced oil recovery (EOR), and corrosion prevention. For the carbon capture, China has built several carbon capture plants with capacity of over 100,000 tons each. In 2019, China captured about 2 million tons of ${\mathrm{{CO}}}_{2}$ emissions, representing about ${0.02}\%$ of the total ${\mathrm{{CO}}}_{2}$ emissions nation-wide, and ${\mathrm{{CO}}}_{2}$ captured as of 2019 added up to 3.7 million tons of ${\mathrm{{CO}}}_{2}$ emissions. As for the carbon transport, China has experimented with all three modes, i.e., pipeline, tanker and sea transport, and completed a total of ${50}\mathrm{\;{km}}$ of pipeline in length. For carbon storage, China has built an onshore saline aquifer ${\mathrm{{CO}}}_{2}$ geological storage demonstration project with a capacity of 100,000 tons/year, which, once included in saline aquifer storage projects, can increase the annual ${\mathrm{{CO}}}_{2}$ storage to nearly 1.1 million tons and the total ${\mathrm{{CO}}}_{2}$ storage to more than 5.6 million tons.
In all, by 2020 China has established about 30 CCUS projects, with extensive demonstration of the various industrial aspects or processes of CCUS technology. It has set up several ${\mathrm{{CO}}}_{2}$ capture projects with a capacity of 100,000 tons or more each, and built ${\mathrm{{CO}}}_{2}$ transport pipelines with a combined length of ${50}\mathrm{\;{km}}$ . As discussed earlier, so far most of these CCUS projects are in the energy sector and none in the cement or the steel sector.
4.2 Challenges Ahead
The Paris Agreement sets out a global action plan to set the world on track to avoid dangerous climate change by limiting global warming below $2{}^{ \circ }\mathrm{C}$ above pre-industrial levels in the long-term, and to pursue best efforts to limit the increase in warming to ${1.5}^{ \circ }\mathrm{C}$ . To achieve this target, the Agreement emphasized the need for global GHG emissions to peak as soon as possible and called for the contracting states to the Agreement to reduce ${\mathrm{{CO}}}_{2}$ emissions with best available (BATs).
Generally speaking, there are three categories of BATs, readily available or still on the horizon, i.e., net-low carbon technology, net-zero carbon technology, and net-negative carbon technology. Along this spectrum of technologies of mitigation and adaptation to the impact of climate change, carbon capture, utilization and storage (CCUS) belongs to the last category, i.e., net-negative carbon technology-a topic that Part II of this study will further explore and discuss in more depth.
A reality check of the existing CCS demonstration projects around the world suggests that while China is not too behind on this technology, more must be done to realize its potential in the years ahead now that the country has pledged to peak ${\mathrm{{CO}}}_{2}$ emissions prior to 2030 and to achieve carbon neutrality by 2060. More specifically, while China has made remarkable progress in CCUS demonstrations, they are mostly in the power sector but none in the steel sector so far. The fact is that the iron/steel sector in China contributes more than half of the world’s total ${\mathrm{{CO}}}_{2}$ emissions from iron/steel making, and about ${15}\%$ of China’s total ${\mathrm{{CO}}}_{2}$ emissions from the industry. And the policy review by this study on climate mitigation and adaptation in China indicates that the iron/steel sector so far has relied mainly on net-low carbon technologies in its strategic shift toward green growth.
Looking forward, the immediate challenge is to explore and indeed, ascertain the best strategic pathways or road maps for the deployment of CCUS to decarbonize the steel sector-a topic that the next chapter of this study will follow upon.
According to IEA, there will be a 50% chance to control the global temperature rise below two degrees by 2050 when the ${\mathrm{{CO}}}_{2}$ emissions are cut by 60% from the 2013 level and emission reductions total 1000 billion tons. By then, CCUS-derived emission reductions have to reach 6.1 billion tons, which implies an average annual increase of ${50}\%$ from the current level of 2.9 million tons. Specifically, it means that an estimate of 6000 CCS projects, each with a storage capacity of over one million ${\mathrm{{tCO}}}_{2}$ , must be deployed by 2050. At present, however, there are only 3 CCS projects with a storage capacity of over one million ${\mathrm{{tCO}}}_{2}$ globally. Given the current status of CCUS, the challenge will be enormous, so will be the potential, especially in China, and for two reasons. First, currently most CCUS projects are in natural gas and coal-fired power plants, and are not yet well deployed in sectors such as steel, cement, and biotransformation industries. Second, of the total industrial ${\mathrm{{CO}}}_{2}$ emissions in China, the power sector accounts for about ${50}\%$ , steel ${15}\%$ , and cement ${15}\%$ , and as high as ${85}\%$ of the current energy structure in China is based on fossil-fuels, of which coal takes up 58% and oil 19%.
Acronym Full spelling
BATs Best available technologies
CCER China certified emission reduction
CCS Carbon capture and storage
CCUS Carbon capture, utilization and storage
CNPC China National Petroleum Corporation
EOR Enhance oil recovery
ETS Emission-trading system
FYP Five Year Plan
GCCSI Global Carbon Capture and Storage Institute
GHG Greenhouse gas
IEA International Energy Agency
IPCC Intergovernmental Panel on Climate Change
LSIPs Large-scale integrated projects
MEE Ministry of Ecology and Environment
MIIT Ministry of Industry and Information Technology
MNR Ministry of Natural Resources
MOF Ministry of Finance
MOST Ministry of Science and Technology
MOT Ministry of Transport
NCSC National Center for Climate Strategy and International Cooperation
NDRC National Development and Reform Commission
NPC National People’s Congress
NRA National Railway Administration
NTCC National Technical Committee on Carbon Management
SAC Standardization Administration of China
SACC Strategy Analysis of Climate in China
SFA State Forestry Administration
UNFCCC United Nations Framework Convention on Climate Change
References
Adnoc. (2019). ADNOC reinforces leadership role and commitment to environmental stewardship as it strengthens its position as one of the lowest greenhouse gas emitters in the oil and gas industry. https://www.adnoc.ae/en/news-and-media/press-releases/2019/ adnoc-reinforces-leadership-role-and-commitment-to-environmental-stewardship
Aljazeera. (2019). Qatar building large ${\mathrm{{CO}}}_{2}$ storage plant. https://www.aljazeera.com/eco nomy/2019/10/8/qatar-building-large-co2-storage-plant
Asian Development Bank (ADB). (2015). Roadmap for carbon capture and storage demonstration and deployment in the People’s Republic of China. Manila.
China Steel Statistics. Beijing: China Iron and Steel Association (Various years).
CCUS Advisory Group. (2019). Investment frameworks for development of CCUS in the UK. CAG final report. http://www.ccsassociation.org/files/4615/6386/6542/CCUS_Advi sory_Final_Report_22_July_2019.pdf.
Clean Air Task Force. (2019). State and utility climate change targets shift to carbon reductions, technology diversity. https://www.catf.us/wp-content/uploads/2019/05/State-and-Uti lity-Climate-Change-Targets.pdf
Committee on Climate Change. (2018). Reducing UK emissions. 2018 progress report to parliament. https://www.theccc.org.uk/wp-content/uploads/201806/CCC-2018- Progress-Report-to-Parliament.pdf
Department of the Treasury, USA. (2018). Carbon oxide sequestration credit. https://www.irs/pub/irs-access/f8933_accessible.pdf
European Commission. (2019). The potential for CCS and CCU in Europe. https://ec.europa.eu/info/sites/info/files/iogp_-_report_-_ccs_ccu.pdf
Global CCS Institute (Global Carbon Capture and Storage Institute). (2009). Strategic analysis of the global status of CCS: 2009. Melbourne, Australia.
Global CCS Institute (Global Carbon Capture and Storage Institute). (2015). The global status of CCS: 2015. Melbourne, Australia.
Global CCS Institute (Global Carbon Capture and Storage Institute). (2016). The global status of CCS: 2016. Melbourne, Australia.
Global CCS Institute (Global Carbon Capture and Storage Institute). (2019). The global status of CCS: 2019. Melbourne, Australia.
Global Cement. (2017). Global cement top 100 report 2017-2018. http://www.globalcement.com/magazine/articles/1054-global-cement-top-100-report-2017-2018.
Government of Canada. (2008). The global status of CCS, 2028. http://www.globalcement.com/resources/global-status-report
International Energy Agency (IEA). (2019a). World outlook 2019. Paris: IEA. https://www.iea.org/reports/world-energy-outlook-2019
International Energy Agency (IEA). (2019b). Transforming industry through CCUS. http:// www.iea.org/reports/tranforming-industry-through-ccus
International Energy Agency (IEA). (2020). World energy outlook 2020. https://www.iea.org/ reports/world-energy-outlook-2020
IPCC. (2018). In V. Masson-Delmotte, P. Zhai, H.-O. Pörtner, D. Roberts, J. Skea, P. R. Shukla, A. Pirani, W. Moufouma-Okia, C. Péan, R. Pidcock, S. Connors, J. B. R. Matthews, Y. Chen, X. Zhou, M.I. Gomis, E. Lonnoy, T. Maycock, M. Tignor, & T. Waterfield (Eds.), Global warming of ${1.5}^{ \circ }\mathrm{C}$ . An IPCC special report on the impacts of global warming of ${1.5}^{ \circ }\mathrm{C}$ above pre-industrial levels and related global greenhouse gas emission pathways, in the context of strengthening the global response to the threat of climate change, sustainable development, and efforts to eradicate poverty. Geneva, Switzerland: World Meteorological Organization.
Japan CCS. (2018). From Japan to the world—Aiming for the practical use of CCS Technology in Japan. http://www.Japanccs.com/en/corporae/message.php
Jiang, K., et al. (2020). China’s carbon capture, utilization and storage (CCUS) policy: A critical review. Renewable and Sustainable Energy Reviews., 119, 109601. https://doi.org/ 10.1016/j.rser.2019.109601
Li, J. (2011). Carbon capture, utilization and storage (CCUS) Activities in China. Sanya, China. http://www.cagsinfo.net/__data/assets/pdf_file/0009/81576/1-3-carbon-capture-utilisation-storage-activities-China.pdf.Accessed March 5, 2021.
Li, X. (2020). The road map of China’s steel industry: Reduction. Beijing, China: Metallurgical Industry Press.
Liu, Q. (2016). CCUS development in China: Outlook, projects and policies. Japan. http:// jp.globalccsinstitute.com/sites/jp.globalccsinstitute.com/files/content/media_release/122 850/files/S2_CCUS_development_in_China_Liu_qiang_NCSC.pdf. Accessed June 16.
National Bureau of Statistics of the People’s Republic of China. http://www.stats.gov.cn
Overa, S. (2019). Telling the Norwegian CCS story, Northern lights: A European CO2 transport and storage project. https://www.globalccsinstitute.com/news-media/events/telling-the-norwegian-ccs-story-part-3-northern-lights-a-european-co2-transport-and-storage-pro ject/
PBL Netherlands Environmental Assessment Agency. (2021). Energy and climate change. The Hague. https://www.pbl.nl/en/topics/energy-and-climate-change
Shan, Y., et al. (2018). China ${\mathrm{{CO}}}_{2}$ emission accounts 1997-2015. Scientific Data, 5, 170201. https://doi.org/10.1038/sdata.2017.201
Shan, Y., et al. (2020). China ${\mathrm{{CO}}}_{2}$ emission accounts 2016-2017. Scientific Data, 7,54. https://doi.org/10.1038/s41597-020-0393-y
U.S. Environmental Protection Agency. (2021). Greenhouse Gas (GHG) emissions. Washington, D.C. https://www.epa.gov/ghgemissions
Website of Aisixiang. (2021, 5 March). http://www.aisixiang.com/zhuanti/175.html
World Steel Association (, Worldsteel, & ). (2019). World steel in figures 2019. Belgium.
Zawadzki, S., & Kravtsova, E. (2019). Qatar opens CO2storage plant, targets 5 mln T a year by 2025. https://www.nasdaq.com/articles/qatar-opens-co2-storage-plant-targets-5- mln-t-a-year-by-2025-2019-10-08
Zhang, X. (2014). Status of CCUS in China. Changsha, China. https://iea.blob.core.windows.net/assets/imports/events/76/CarboncaptureandstoragedevelopmentsinChina.pdf.Accessed March 5, 2021.
Drawing Strategic Roadmap of Decarbonization for the Steel Sector
Jun Fu, Min Wang, and Qimin Cai
The steel sector is one of the largest industrial sources of ${\mathrm{{CO}}}_{2}$ emissions, contributing around $7\%$ of the global energy sector ${\mathrm{{CO}}}_{2}$ emissions (including process emissions) (IEA, 2020). ${}^{1}$ In the overall scheme of this study, one may take China’s steel sector as a window through which to see the magnitude of mitigation and
${}^{1}$ IEA (2020), Iron and Steel Technology Roadmap, IEA, Paris, https://www.iea.org/reports/ iron-and-steel-technology-roadmap.
${}^{2}$ In terms of ${\mathrm{{CO}}}_{2}$ emissions, the power, the steel, and the cement sectors are the three largest ${\mathrm{{CO}}}_{2}$ emitters in China. As a share of total industrial ${\mathrm{{CO}}}_{2}$ emissions, the power sector accounts for about ${50}\%$ , the steel sector ${15}\%$ , and the cement another ${50}\%$ . Compared with the other two sectors, the steel sector is arguably more representative of the complexity that China faces in its decarbonization efforts, if only because it is more diverse in production processes and product portiforlios than those of the power and cement sectors. This would make the MRV (monitoring, reporting and verification) system—a necessary component of carbon market— more difficult. The point is that if a system is ready to deal with complexity, it is relatively easy to deal with simplicity. For discussion on carbon market or ETS (emissions trading system) in China, see Chapter 5 of this study.
In writing this chapter, the authors benefited from two seminars on climate change given at Peking Uiversity by LI Junfeng, formerly director-general of the National Center for Climate Change Strategy and International Cooperation (NCSC) in China, as well as from several talks with LI Xinchuang, President of China Metallorgical Industry Planning and Research Institute.
J. Fu ( $\boxtimes$ ) $\cdot$ M. Wang
National School of Development, Peking University, Beijing, China
Q. Cai
National Center for Climate Change Strategy and International Cooperation (NCSC), Beijing, China
adaptation efforts under climate change. ${}^{2}$ Indeed, the steel sector has been playing an important role in the country’s strategy for developing a low-carbon economy. To highlight the point, a few more statistics shall suffice here.
In 2020, the world’s total crude steel output was 1.864 billion tons, to which China contributed 56.5% (World Steel Association, 2021). On average, an integrated blast furnace steel plant produces approximated 2 tons of ${\mathrm{{CO}}}_{2}$ per ton of crude steel produced. Given these simple yet powerful numbers, it is critical to explore ways to decarbonize the steel sector in China, especially when Chinese central government announced to peak ${\mathrm{{CO}}}_{2}$ emissions by 2030 and work towards carbon neutrality by 2060. One important technological option for direct reduction of ${\mathrm{{CO}}}_{2}$ emissions is carbon capture, utilization and storage (CCUS), especially after the current paraphernalia of technologies at indirect ${\mathrm{{CO}}}_{2}$ emission reductions via energy savings and energy efficiency has increasingly exhausted their marginal effects. We must plan ahead. For over the next 40 years, the ambition is no longer low carbon now but carbon neural.
In line with the above, this chapter looks at the steel sector as a critical part of China’s strategy for developing a green economy. The chapter is structured into four sections. Section 1 provides an overview of the growth trends of China’s steel sector, in terms of production, consumption, and ${\mathrm{{CO}}}_{2}$ emissions. Section 2 examines various policy instruments by the Chinese government to decarbonize the steel sector, in light of the country’s new pledge to cap ${\mathrm{{CO}}}_{2}$ emissions prior to 2030 and achieve carbon neutrality in 2060. In Section 3, we introduce a simulation model in connection with CCUS for the steel sector to plan ahead and shift from indirect to direct ${\mathrm{{CO}}}_{2}$ emission reductions. Section 4 concludes by presenting a roadmap for the development of CCUS in the steel sector, as an indispensable part of the country’s strategy to achieve carbon neutrality in 2060.
1 Overview of China’s Steel Sector
1.1 Steel Production
Since China started the reform and opening-up strategy in 1978, the economy witnessed tremendous growth with real GDP on average growing around 9% annually, which together with the large size of the economy has led to the explosive growth of steel production in China. The annual production of crude steel in China on average grows around 11% during 1978-2020, increasing from 31.78 million tons (around 4.4% of world production) in 1978 to 1.05 billion tons in 2020.3
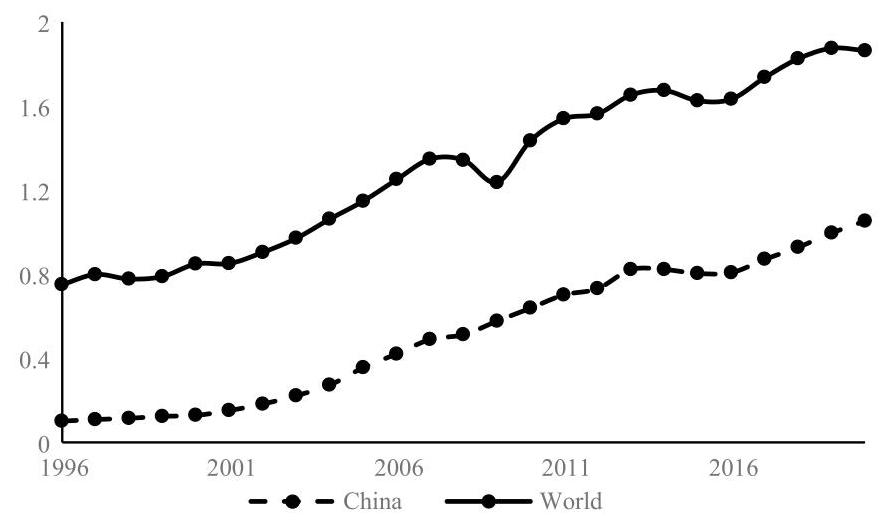
Fig. 1 Total Production of Crude Steel (billion tons), 1996-2020
China surpassed Japan as the world largest producer of crude steel in 1996 and has overwhelmingly dominated the worlds’ steel industry afterwards by keeping astonishing production growth. The total production of crude steel in 2020 is 10.4 times the total production in 1996. The global share of China’s production of crude steel has continuously increased from 15.1% in 1996 to 56.5% in 2020. By contrast, the global share of crude steel production from the second largest producer to the 6th largest producer, EU, India, Japan, Russia and U.S., is 7.4%, 5.3%, 4.5%, 3.9% and 3.9% respectively in 2020.
Figure 1 shows a clear trend of China’s production of crude steel in the past two decades. Driven by the new round economic boom especially after China joined the WTO, the growth rate of annual production of crude steel in China reached to a historic high, 21% on average during 2001-2007. After the global financial crisis in 2008, the average growth rate of annual production of crude steel in China fell to 9% during 2008-2013.
Largely due to weak demand, the steel sector was rather dismal during 2014- 2016, in which the growth rate of annual production of crude steel was 0.04%, -2.25% and 0.47% respectively in 2014, 2015 and 2016. Chinese steel producers experienced their worst year in 2015, when the capacity utilization rate of the whole steel sector was only 65% and around half of China’s steel mills made loss with many struggling to exit from the sector. The sector has since been under enormous pressures to shift towards a quality-over-quantity and low-carbon development path.
3 The data on steel production in different countries used in this paper are from World Steel Statistical Yearbook published by World Steel Association, unless otherwise stated.
At that time, China government unveiled a series of policies to resolve the steel industry overcapacity problem, such as Opinions on Reducing Overcapacity and Removing Development Obstacles in the Iron/Steel Sector (No.6 [2016] of the State Council). These policies aimed to phase out backward and highly polluting capacity and curtail capacity expansion by setting new higher standards. In total, 100-150 million tons of crude steel production capacity were closed down during the 13th Fifth Year Plan period (2016-2020).
The steel sector recovered quickly after the aggressive policy intervention and is keeping a stable growth rate during 2017-2020. The production of crude steel grows around 6.86% per year in this most recent period. Even when the economy growth was slowed down by the COVID-19 pandemic, the total production of crude steel in China still kept a high growth rate, 5.69%, in 2020. Given the expectation that China may retain average annual real GDP growth rate around 4%-5% in the next three decades (until 2050) and the urbanization rate may increase from 60% in 2020 to 80% in 2050 (United Nations, 2018; Wang, 2020), it is quite likely that China’s steel production would keep steady growth in the foreseeable future. In international perspective, in 2020, steel output per capita in China was about 10 tons, 25 tons in the U.S. and 45 tons in Japan.
1.2 Steel Consumption
Figure 2 presents the apparent steel use in China and the whole world between 1996 and 2019. Not surprisingly, as the steel output is mainly consumed by domestic users, Fig. 2 has exactly the same pattern as Fig. 1. In 2019, the global share of apparent steel use of the world’s 6 largest steel users, China, EU, Indian, USA, Japan and South Korea, is respectively 50%, 9.13%, 5.76%, 5.74%, 3.69% and 2.94%. Evidently China is not only the largest producer but also the largest consumer, dominating the world steel consumption market.
Moreover, the difference between the global shares of production and consumption of the steel in China also reveals that China is the largest net exporter in the world steel market. It need to note that the total domestic production of crude steel was always lower than the total amount of apparent steel use in China until 2005. That is, China has become a net steel exporter since (including) 2006.
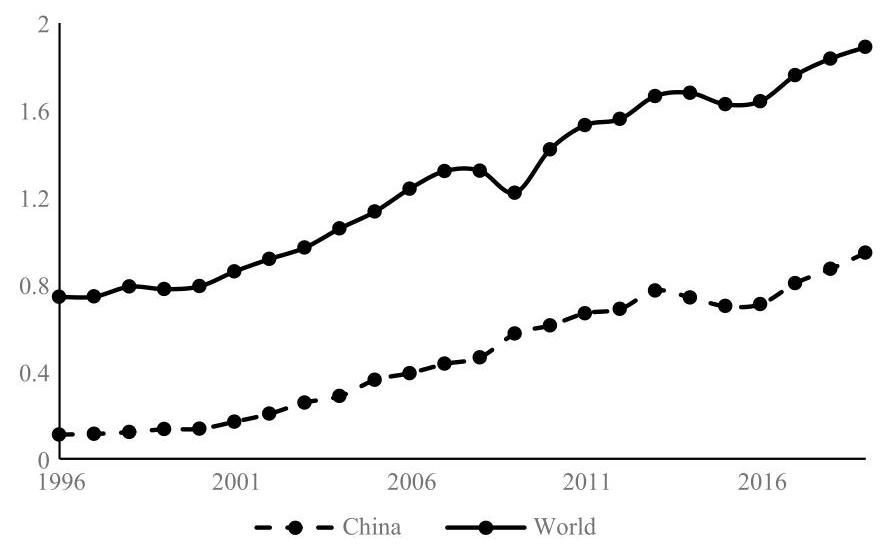
Fig. 2 Steel Use (crude steel equivalent, billion tons), 1996-2019
1.3 Energy Use
Given the explosive growth of steel production and consumption in China, the energy use and carbon emissions from the steel sector are great challenges not only for the sector but also for the whole economy. Fortunately, the energy intensity, measured by the energy consumption per ton of steel, has declined significantly, especially since the 1990s, largely due to policy-induced process restructuring and optimization.
The energy consumption per ton of steel was 2040 kgce in 1980 and almost halved to 1240 kgce in 1999. As shown in Fig. 2, the engery intensity of the steel production fell by 39% during 2000-2019, decreasing from 906 kgce/t in 2000 to 553 kgce/t in 2019. However, given the fast growth of the steel production in the period, the total energy use of the steel sector was increased by 8.6 times, from 116 mtce in 2000 to 996 mtce in 2019. ${}^{4}$ As a consequence, the steel sector has become an increasingly large source of air pollutant emissions and carbon emissions.
Since 2000, under the obligatory energy saving and emission reduction policies, the steel’s energy intensity in China kept decreasing significantly until 2006. On average, the energy intensity decreased by 8.6 per year during 2000-2006.
${}^{4}$ The total energy use is calculated by multiplying the total production of crude steel with the energy intensity.
The decreasing trend of the energy intensity slowed down after 2006. In terms of energy intensity, it only fell at 1.11% per year during 2007-2019 and reached at 553 kgce/ton in 2019. By comparison, the world average energy intensity of crude steel production was ${678}\mathrm{{kgce}}/$ ton in ${2019.}^{5}$ Thus, the current level of the energy intensity in China is not only much lower than the world average but also close to that in developed countries. That said, both the trend and the level of the energy intensity also indicate that there is limited room for China’s steel sector to improve the energy efficiency. Hence, unless there are technological breakthroughs, we expect that the growth of the energy use in China’s steel sector would keep pace with the growth of the steel production.
1.4 Carbon Emissions
China has surpassed U.S. as the world largest carbon emitter since 2005. In 2019, China’s ${\mathrm{{CO}}}_{2}$ emissions are almost twice of ${\mathrm{{CO}}}_{2}$ emissions in U.S., and China alone was responsible for ${29}\%$ of global ${\mathrm{{CO}}}_{2}$ emissions (BP,2020). China’s steel sector is a resource- and energy-intensive industry, and the afore-mentioned explosive growth of the production and energy use lead to the rapid growth of ${\mathrm{{CO}}}_{2}$ emissions in the sector. China’s steel sector is now emitting around 15% of the country’s total ${\mathrm{{CO}}}_{2}$ emissions, right after the largest industry emitter, power sector, which accounts for around ${50}\%$ of total ${\mathrm{{CO}}}_{2}$ emissions in China. The steel industry is under great pressure to curtain the growth of ${\mathrm{{CO}}}_{2}$ emissions.
It is understood that ${\mathrm{{CO}}}_{2}$ emission from the blast furnaces (BFs) steelmaking process is about around 2-2.2 tonnes for per tonne of steel, while that from the electric arc furnace (EAF) process is far lower at ${800}\mathrm{\;{kg}}$ per tonne of steel. The BFs steelmaking process (alternatively known as long process) however accounts for around 90% of China’s steel capacity. On Dec. 31, 2020, the Ministry of Information and Technology released guidelines for the domestic steel industrial development for 2021-2025. According to the guidelines, EAF steelmaking should be lifted to ${15}\%$ or ${20}\%$ by ${2025.}^{6}$ However, since the products of EAFs do not well fit into the steel demand of manufacturing industries which are the key end users in China, there is also limited room for further expansion of the proportion of EAFs.
${}^{5}$ Data source: Sustainable steel—Indicators 2020 and steel applications, World Steel Association.
${}^{6}$ At the present, EAF steelmaking in China accounts for about ${10}\%$ ; and the rest is long process. By international comparison, EAF accounts for about 47% globally (excluding China). That for many advanced economies such as the US has reached 90%, indicating significant scope for the Chinese steel sector to reduce ${\mathrm{{CO}}}_{2}$ emissions in this area, i.e. from long process to EAF, in the years to come.
Recently, Chinese President Xi Jinping announced aggressive actions to tackle climate changes. In particular, China will peak ${\mathrm{{CO}}}_{2}$ emissions before 2030, increase non-fossil fuel around ${25}\%$ by 2030 and cut its ${\mathrm{{CO}}}_{2}$ emissions per unit of GDP, or carbon intensity, by more than 65% from 2005 levels by 2030. By comparison, the earlier targets that the Chinese government had pledged in 2015 were to peak ${\mathrm{{CO}}}_{2}$ emissions around 2030 (could be after 2030), increase non-fossil fuel around 20% by 2030 and lower carbon intensity by 60-65% by 2030. In line with China’s new pledge of climate targets, China has launched national carbon trading market for the power sector in early 2021 and it is expected to cover the steel sector in the near future. ${}^{7}$ And given the fact that the marginal effects of existing technologies on raising energy efficiency and reducing carbon intensity has been on decline, the industry has to explore new ways to decarbonize iron and steel making, such as EAF and hydrogen metallurgy in the short run. ${}^{8}$ But in the long run, CCUS remains another promising option to decarbonize the steel sector.
2 Review of Low Carbon Policy
2.1 Low-Carbon Policy for the Steel Sector
During the 11th FYP (2006-2010), the steel sector in China expanded rapidly, and the policies focused on energy saving and emission reduction. During the 12th FYP (2011-2015), to resolve the overcapacity problem resulted from the great expansion of the steel sector in the 11th FYP, the policies focused on cutting excess capacity, which was regarded as a representative example of “supply-side reforms” at that time. A key component of the 13th FYP (2016-2020) was “eco-civilization”, which translated into action plans for industrial firms, means decarbonization and green growth.
${}^{7}$ For more on the development of China’s carbon market or ETS (emissions trading system), see Chapters 5 and 6 and this study.
${}^{8}$ HBIS, China’s second largest steel group company in collaboration with TENOVA, an Italian corporation, has been exploring ways to deploy hydrogen technologies in steel-making since 2019. If successful, the new technology can produce steel at a much lower rate of ${\mathrm{{CO}}}_{2}$ emissions, about ${125}{\mathrm{{kgCO}}}_{2}/$ ton, which is approximately $1/{12}$ of the current rate of ${\mathrm{{CO}}}_{2}$ emissions in long-process steelmaking in China. This is strong indication that, in addition to CCUS, China has been exploring all BATS (best available technologies) to reduce ${\mathrm{{CO}}}_{2}$ emissions.
The policies imposed on the steel sector in the last two decades could be summarized in three categories:
(1) Restructuring the steel industry by resolving the over-capacity. Most policies belonged to this category focused on eliminating existing backward production capacity. ${}^{9}$ These policies generally set a target on existing production capacity that could not meet a certain standard and should be closed down. Some policies might specifically aimed to close down backward processes and backward products. ${}^{10}$ Some policies, such as Opinions on Reducing Overcapacityand Removing Development Obstacles in Iron/SteelSector rleased by State Council in 2016, were issued to curtail the expansion of new capacity.
(2) Enhancing the energy efficiency of steel production. The policies in this category generally set the steel sector’s environmental standards and energy use standards, such as standards of pollutant emissions, energy intensity, energy saving and energy use in major production processes. ${}^{11}$
9 Development Policies for Iron/Steel Industry, NDRC, 2005; Notice on Controlling Total Production Capacity, Eliminating Backward Production Capacity and Accelerating Restructuring in Steel Sector, NDRC, 2006; Notice on Accelerating Restructuring Industries with Excess Capacity, State Council, 2006; Notice on Accelerating Industrial Restructuring with Excess Capacity, State Council, 2006; Notice on Comprehensive Work Plan for Energy Saving and Emission Reduction, State Council, 2007; Letter of Responsibility for Closedown and Elimination of Backward Production Capacity, NDRC, et al., 2007; Regarding Curbing Overcapacity, Redundancy, and Guiding Sound Development in Some Industries, forwarded by State Council, 2009; Notice on Further Stepping up the Efforts to Eliminate Backward Production Capacity, State Council, 2010; Notice on Further Efforts to Ensure Energy Conservation and Emission Reduction Targets during the 11th FYP, State Council, 2010; Opinion on Further Efforts to Achieve Energy Saving, Emissions Reduction Emissions, and Acceleration of Restructuring in the Steel Sector, State Council, 2010; Notice on Checking up Iron/Steel Projects, State Council, et al. 2010; Guiding Opinion on Resolving Contradictions of Serious Overcapacity, State Council, 2013; Notice on Effectively Conducting Production Capacity Replacement for Some Industries with Serious Overcapacity, MIIT, 2014; Notice on Formulating Targets and Plans for Elimination of Backward and Excessive Capacity in Key Industries in the 13th FYP, 2014, MIIT, 2014; Notice of Measures for Capacity Replacement in Sectors with Serious Overcapacity, MIIT, 2015.
10 Industrial Restructuring Guidance-Catalogues. NDRC, 2005; Guidance Catalogue for Elimination of Backward Processes, Equipment, and Products in Some Industries, MIIT, 2010; Industrial Restructuring Guidance Catalogue. NDRC (2011), 2011; Catalogue of Value-Added Tax Preferences for Products and Services in Comprehensive Use of Resources, 2015. State Council, MOF, STA.
11 The Norm of Energy Consumption per Unit Product of Major Individual Process of Crude Steel Manufacturing Process, 2008, Standardization Administration of China; Access Conditions and Management Measures for Production and Operation of Existing Iron and Steel Enterprises, 2009, MIIT; Norms and Conditions for Production and Operation of Iron and
(3) Changing the energy mix in steel production toward low carbon mix. The policies in this category mainly aimed to promote the development of EAFs technology in steel production, such as proposing the proportion of EAFs that should be used in the steel production and setting an upper limit for energy intensity of the EAF technology. ${}^{12}$
Many policy initiatives could be traced back to the 12th FYP or even earlier, but they were intensively issued during the 13th FYP right after China government signed Paris Agreement in 2015. Given the above mentioned upgrade of China’s 2030 climate change targets, we expect more low-carbon policies will be made and enforced in the steel sector.
2.2 Policy Effects
Under the intensive policy implementation, the steel sector succeeded in cutting excessive capacity dramatically since the 11th FYP (2006-2010). 72.24 million tons of inefficient capacity was slashed during the 11th FYP. Another 94.86 million tons of inefficient steel capacity was phased out during the 12th FYP (2011-2015). During the 13th FYP, 100-150 million tons of capacity, including 90 million tons of backward capacity, were eliminated.
Steel Industry, 2010, MIIT; Guiding Opinions on Mergers and Reorganizations in the Iron and Steel Industry, 2010, MIIT; Design Criterion for Energy Saving of Iron and Steel Industry, 2010, the Ministry of Housing and Urban-Rural Development (MOHURD); Guiding Opinions on Energy Conservation and Emission Reduction in the Iron and Steel Industry, 2010, MIIT; The Notice on Printing and Issuing the Development Strategy and Immediate Action Plan for Circular Economy, 2013, the State Council; The Norm of Energy Consumption per Unit Product of Major Individual Process of Crude Steel Manufacturing Process (GB21256), 2014; Access Conditions for the Coking Industry (Revised in 2014), 2014, MIIT; Norms and Conditions for the Iron and Steel Industry (Revised in 2015), 2015, MIIT; Requirements of the Greenhouse Gas Emission Accounting and Reporting: Iron and Steel Production Enterprises, 2016, NDRC; Code for Design of Energy Saving of Iron and Steel Industry (Draft for Comment), 2017, MOHURD; The Norm of Energy Consumption per Unit Product of Coke (GB21342); The Norm of Energy Consumption per Unit Product of Steel Making Electric Arc Furnace (GB 32,050-2015).
12 Interim Measures for the Management of Financial Incentive Funds for Energy Saving Technological Transformation, 2007, MOF, NDRC; The 13th Five-Year Plan for the Development of the Scrap Iron and Steel Industry, 2016, China Association of Metalscrap Utilization (CAMU); The Standard of Energy Consumption per Unit Product of Steel Making Electric Arc Furnace, 2016, General Administration of Quality Supervision, Inspection and Quarantine.
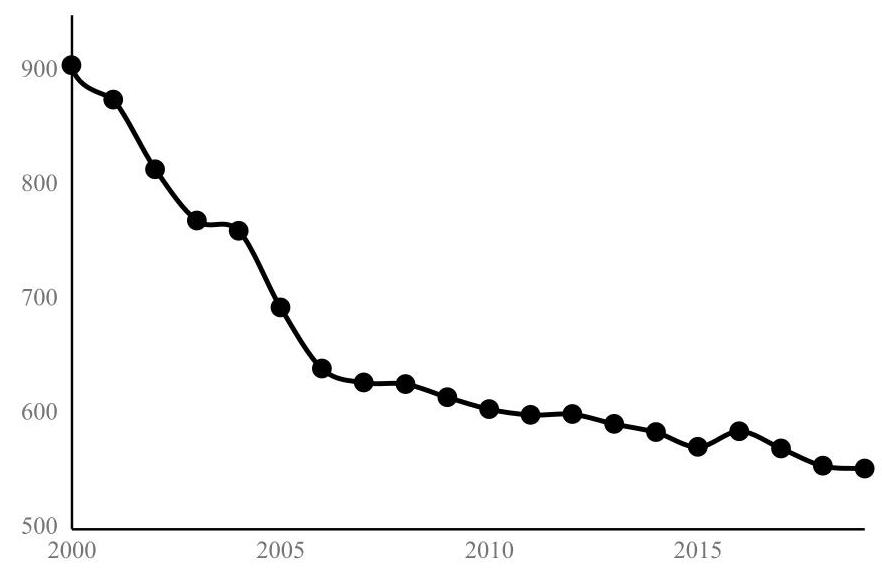
Fig. 3 Energy consumption of Steel in China (Kgce/t), 2000-2019 (data source China Steel Industry Yearbook)
In the meantime, more advanced production facilities with better technologies were put into use. As the result, energy efficiency was significantly increased. During the 11th FYP, large- and medium-sized steel plants witnessed a 12.9% drop in energy intensity, falling to 605 kgce in 2010. The energy intensity further decreased to 572 kgce/t in the end of the 12th FYP and 553 kgce/t in 2019. During the 13th FYP, an ${18}\% {\mathrm{{CO}}}_{2}$ emission reduction per unit of value added was set as a mandatory target in the steel sector.
2.3 Policies Regarding CCUS
Comparing to fossil fuel saving technologies which indirectly reduce the ${\mathrm{{CO}}}_{2}$ emissions, CCUS is the only available end-of-pipe technology capable of directly reducing ${\mathrm{{CO}}}_{2}$ emissions, although it is not commercial yet. ${}^{13}$ The Chinese government takes CCUS as an emerging and strategical technology, and has been actively promoting the development. So far, the government has published more than 26 CCUS-related policy documents at the national level. ${}^{14}$
13 We will further elaborate CCUS in a systematical and technical fashion in Chapters 3 and 4.
14 They included rules, plans, notices and opinions released by the State Council and different ministries and commissions, which can be classified into five categories, namely technology promoting, demonstration support, target setting, environmental management, and others.
During the 12th FYP (2011-2015), the MOST promulgated the National Special Plan for Development of CCUS Technology in 2013. The Plan set out priorities for CCUS pilots and demonstrations. In the same year, NDRC issued a Circular on Promoting Experiment and Demonstration of CCUS. The Circular provided support and guidance for CCUS tests and demonstrations. Also in 2013, MEP issued a Circular on Strengthening Environmental Protection of CCUS Projects. MEP’s Circular aimed to enhance environmental protection of CCUS projects, including environmental impact assessment (EIA), monitoring, risk prevention, and damage controls. In 2016, NDRC published the Action Plan for Innovations in Energy Technology Revolution (2016-2030). The Action Plan puts CCUS on its roadmap of key innovations in the energy sector for the 2016-2050 period.
3 Simulation of Deployment of CCUS Technology
3.1 SACC with CCUS
In this section, we present Strategy Analysis of Climate in China (SACC) in connection with CCUS. SACC is a simulation model developed by the National Center for Climate Change Strategy and International Cooperation (NCSC) in China. NCSC researchers ${}^{15}$ collaborated closely with Peking University researchers on this study to figure out the long-term trends of energy use and ${\mathrm{{CO}}}_{2}$ emissions. Key parameters of SACC in connection CCUS in the steel sector are illustrated in Figs. 3, 4 and 5.
The mechanics of SACC-CCUS simulation model works as follows: (1) the model first calculates end energy consumption ${}^{16}$ based on macroeconomic data on GDP, population, industrial structure, and urbanization; (2) the model projects forward with different scenarios of energy mix, given priorities to non-fossil fuels over fossil fuels; (3) the model makes policy recommendations on different paths to achieving carbon neutrality in ${2060.}^{17}$ For projections, the base year is set at 2015.
15 NCSC project team was previouoly led by Liu Qiang and is now led by Cai Qimin.
${}^{16}$ For consistency between model data and China’s energy balance sheets, this study incorporates the end energy consumption in agriculture and construction sectors into that in industrial sectors.
17 Data for the model comes mainly from China Electricity Council, China Energy Statistical Yearbooks, and China Statistical Yearbooks.
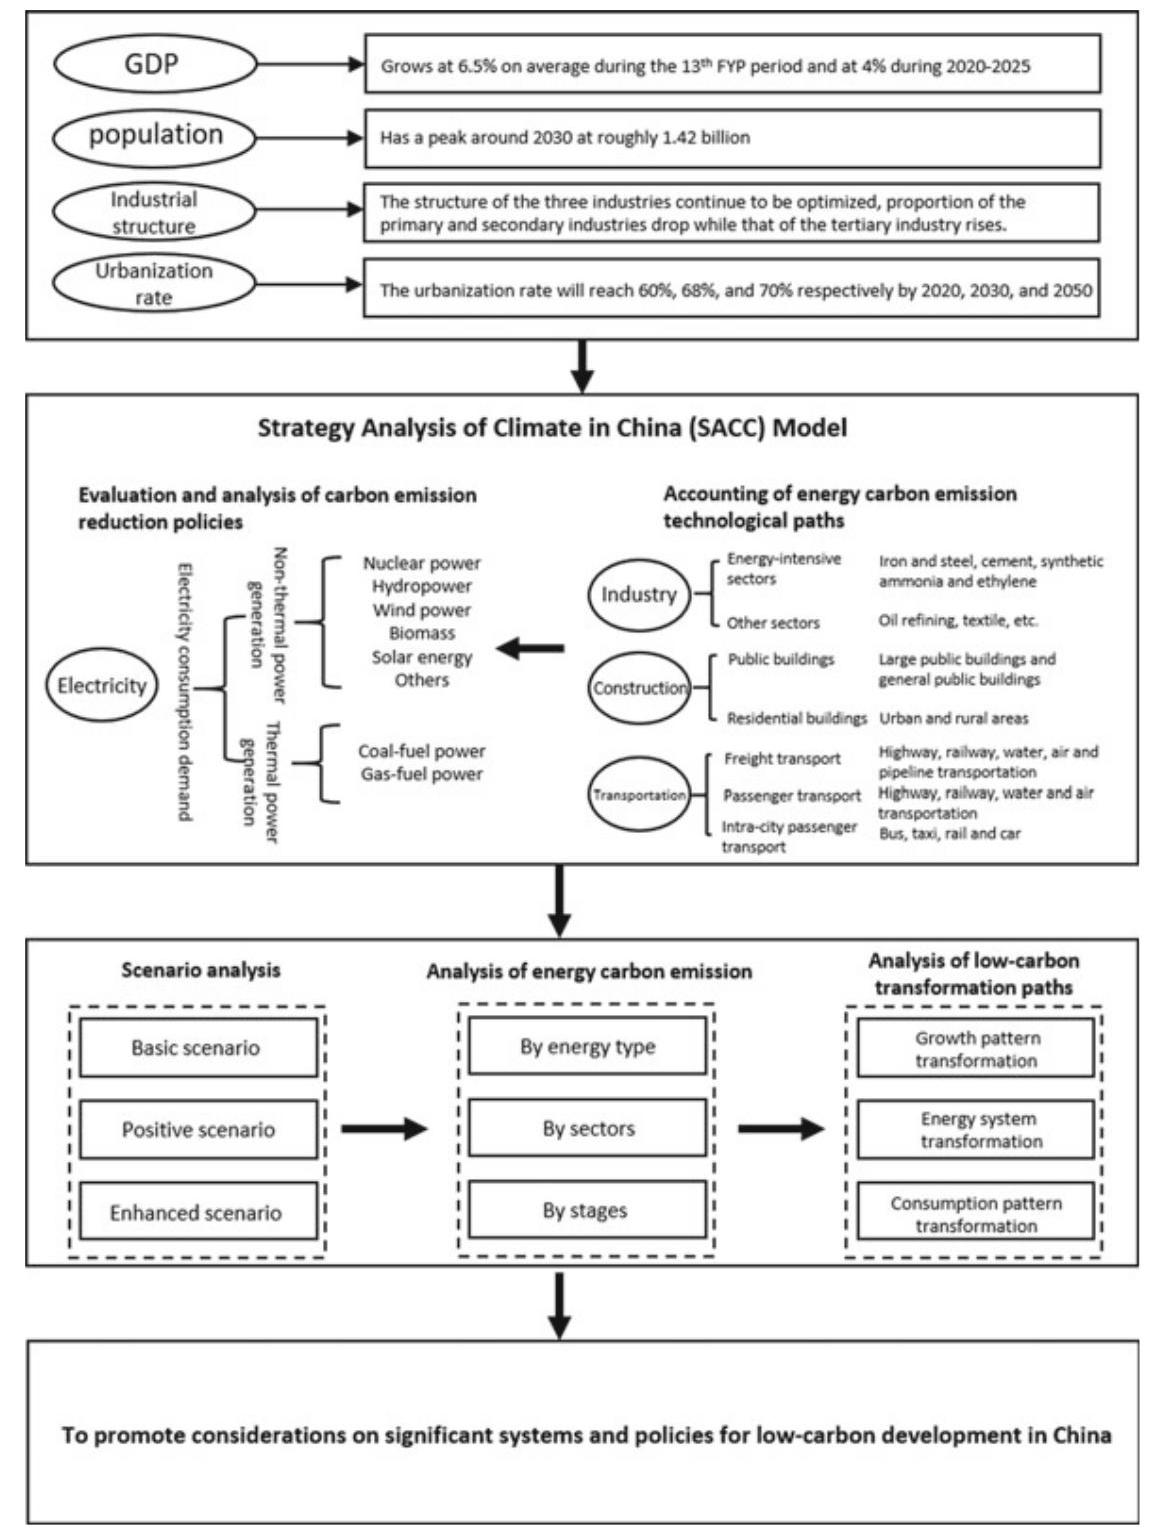
Fig. 4 Framework of the SACC model
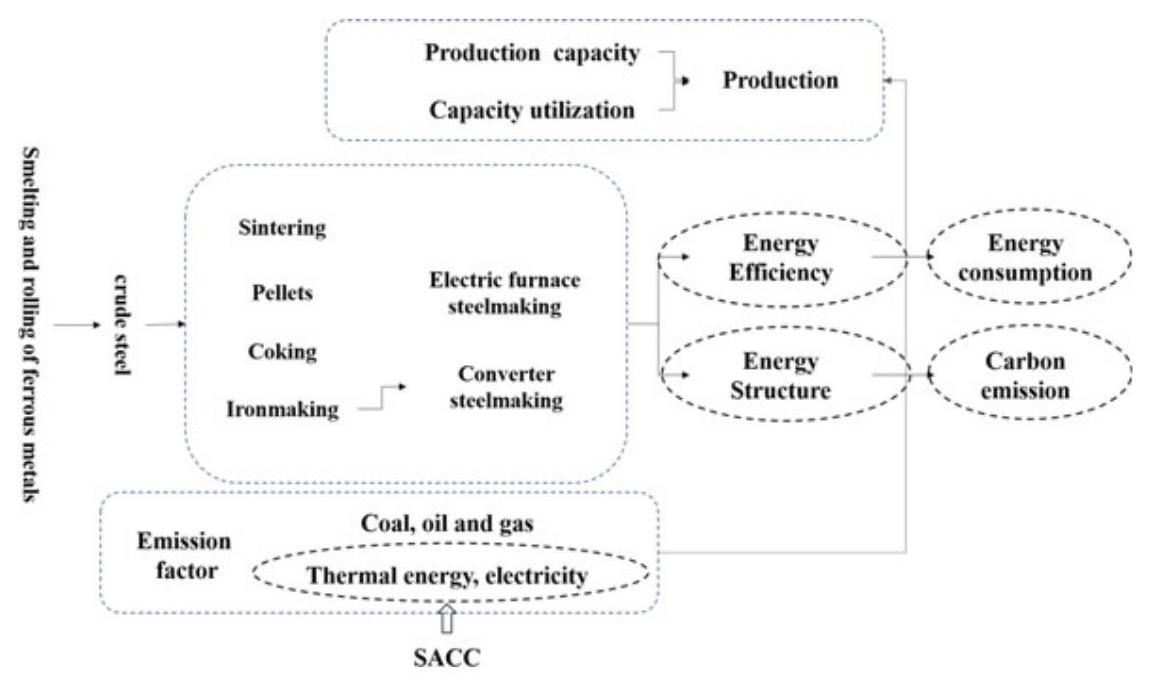
Fig. $5{\mathrm{{CO}}}_{2}$ Emission Reduction Model for the Steel Sector. Source NCSC
Specific to the steel sector, the SACC-CCUS model takes into account sector-specific variables, which presumably will affect ${\mathrm{{CO}}}_{2}$ emission rates in the steelmaking processes. Key parameters affected by CCUS application to steelmaking processes are circled in red in Figure 10. Here, some of CCUS-specific parameters in the model are calculated as follows:
Energy consumption of converter steel making $= \sum$ (energy efficiency of large and medium - sized processes ${}_{i} \; \times$ the proportion of such processes ${}_{i}$ efficiency of small processes ${}_{i} \; \times$ the proportion of such processes ${}_{i}$
where $i$ represents different processes, namely sintering, pelletizing, coking, ironmaking and converter steelmaking.
Energy consumption of EAF steelmaking $=$ Energy efficiency of large and medium
sized EAF steelmaking processes
× the proportion of such processes
- energy efficiency of small EAF steelmaking processes
× the proportion of such processes,
Carbon emissions $= \sum$ (energy consumption of converter steelmaking ${}_{j} \times {\text{ emission factor }}_{j}$
$$
- \text{ energy consumption of EAF steelmaking }{}{j} \times {\text{ emission factor }}{j}\text{ ) } $$
where $j$ represents different energy types, namely coal, oil, gas, heat and electricity. Emission factors of coal, oil and gas are calculated and estimated based on the The People’s Republic of China National Greenhouse Gas Inventory while those of heat and electricity are input from the SACC model.
3.2 Simulation: 3 Scenarios
Based on the SACC-CCUS model of simulation, we set three scenarios of decarbonization for the steel sector, namely a baseline scenario, a low-carbon scenario, and a near net-zero carbon scenario. The basic features of the three scenarios are as follows:
Base-Line Scenario
In the baseline scenario, it is assumed that all energy saving and low-carbon policies introduced thus far will be followed. Specific to the steel sector, all targets set by the 13th FYP will be achieved and low-carbon policies already in place will continue beyond the 13th FYP. But no major technological breakthroughs will be made by 2050, and key low-carbon technologies, including CCUS, are not applied on a large scale.
Low Carbon Scenario
In the low carbon scenario, it is assumed that beyond the 13th FYP, more robust policies will be pursued to reduce carbon emissions than the baseline scenario. Specific to the steel sector, energy conservation and energy efficiency will be further improved. Crucially, the steel sector will go from indirect abatement of ${\mathrm{{CO}}}_{2}$ emission to direct abatement, which means that CCUS will be deployed in the steel sector, as the technology matures over time.
Near Zero Carbon Scenario
In the near zero carbon scenario, it is assumed that all else being equal with the low-carbon scenario, electrification in each of energy end-user sectors will be intensified, and the energy structure will be further optimized. Compared to the baseline scenario, in the steel sector, better production processes such as EAF steelmaking, including an improved auxiliary system of scrap steel recycling, will replace the old long process of steelmaking aggressively, and deployment of CCUS will be taken into full consideration as well.
3.3 Simulation Results
Baseline Scenario
China’s carbon intensity per unit of GDP in 2020 and 2030 will decline by roughly 49% and 67% respectively over the 2005 level, in both cases exceeding the targets set by the government. Industrial carbon emissions will peak around 2025 at approximately 6.3 billion tons of ${\mathrm{{CO}}}_{2}$ , which will further decrease to 2.1 billion and 2 billion tons of ${\mathrm{{CO}}}_{2}$ in 2035 and 2050 respectively. In the steel sector, carbon emissions will decrease from 1.33 billion tons in 2015 to 1.2 billion, 0.78 billion and 0.46 billion tons of ${\mathrm{{CO}}}_{2}$ in 2025,2035 and 2050 respectively. By 2050, carbon emissions will be about a third of the 2015 level. Crude steel production will be at a high plateau in 2015-2025 period, and then drop gradually to 0.5 billion tons in 2050.
Low Carbon Scenario
China’s carbon intensity per unit of GDP in 2020 and 2030 will decline by about 51% and 71% respectively over the 2005 level, in both cases substantially exceeding the targets set by the government. Industrial carbon emissions will peak around 2025 at approximately 6.5 billion tons of ${\mathrm{{CO}}}_{2}$ , and will further decrease to 2 billion and 1.7 billion tons of ${\mathrm{{CO}}}_{2}$ in 2035 and 2050 respectively. In the steel sector, carbon emissions will decrease from 1.33 billion tons in 2015 to 1.1 billion, 0.72 billion and 0.08 billion tons of ${\mathrm{{CO}}}_{2}$ in 2025,2035 and 2050 respectively. Approximately 0.1 billion and 0.2 billion tons of carbon emissions will be captured by CCUS in 2035 and 2050 respectively. In this scenario, under more stringent policies to control production capacity, crude steel production will gradually decline to the 2010 level by 2030 and drop to 0.45 billion tons in 2050.
Near Zero Carbon Scenario
China’s carbon intensity per unit of GDP in 2020 and 2030 will decline by roughly 53% and 76% respectively over the level of 2005, in both cases substantially exceeding the targets set by the government. Industrial carbon emissions will peak around 2025 at approximately 6.3 billion tons of ${\mathrm{{CO}}}_{2}$ , which will further decrease to 1.7 billion and 1.3 billion tons of ${\mathrm{{CO}}}_{2}$ in 2035 and 2050 respectively. In the steel sector, carbon emissions will decrease from 1.33 billion tons in 2015 to 1 billion, 0.57 billion and 0.03 billion tons of ${\mathrm{{CO}}}_{2}$ respectively in 2025,2035 and 2050. Approximately 0.05-0.1 billion and 0.1-0.2 billion tons of carbon emissions will be captured by CCUS in 2035 and 2050 respectively. In this scenario, carbon emissions cut by CCUS, however, may be less than in the second scenario. The reason is that replacement of old steelmaking processes by EAF steelmaking methods will reduce the application of CCUS in the steel sector, although not necessarily for the whole country.
3.4 CO2 Reduction Potential of CCUS in China
Figure 11 exhibits forecasts by different studies on emission reduction potential of CCUS for China as a whole. The range of emission reductions in the near (2020), medium (2035) and long (2050) term is listed below (Table 11). These studies show that through CCUS, China can reduce 10-200 million tons of ${\mathrm{{CO}}}_{2}$ emissions in 2020 and 100-2240 million tons of ${\mathrm{{CO}}}_{2}$ emissions in 2035. To achieve a higher range of emission reductions, i.e., 1000-3840 million tons of ${\mathrm{{CO}}}_{2}$ emissions in 2050, CCUS will have to be extensively deployed beyond 2035. By 2050, CCUS can be put into commercial use on a large scale, and achieving near-zero carbon emissions means large demand for CCUS technologies (Table 1).
Table 1 Forecasts of ${\mathrm{{CO}}}_{2}$ reduced by CCUS in China (mtCO2)
| Year | 2020 | 2035 | 2050 |
| Range of emission reductions | 10-200 | 100-2240 | 1000-3840 |
Sources ADB, Study of China’s Carbon Capture and Storage Demonstration and Promotion Roadmap, 2015; IEA, WEO 2015 Special Report on Energy and Climate Change, 2015; Nie Ligong et al., A Study of the Path to Global Commercialization of CCS Technology, 2016; OECD/IEA, Energy Technology Analysis—Prospects for CO2 Capture and Storage, 2004
Table $2{\mathrm{{CO}}}_{2}$ Reduction potential of CCUS in the steel sector
| 2030 | 2035 | 2040 | 2045 | 2050 | |
| Emission reduction potential $\left( {\mathrm{{mtCO}}}_{2}\right)$ | 10 | 15 | 50 | 75-100 | 100-200 |
Source NCSC
3.5 CO2 Reduction Potential of CCUS in the Steel Sector
In light of the above, and based on our stimulations of low carbon and near-zero carbon shown in Table 11. In the near term, the steel sector will see little emission reduction effects of CCUS. However, the emission reduction potential of CCUS in the steel sector can reach ${10}{\mathrm{{mtCO}}}_{2}$ by 2030 and ${15}{\mathrm{{mtCO}}}_{2}$ in 2035, accounting for ${0.6} - {15}\%$ of the national total, and register ${50}{\mathrm{{mtCO}}}_{2}$ in 2040. Up to this period of time, however, CCUS technologies will not have scale effect in the steel sector. However, by 2045, as industrial cluster and infrastructure of transport and storage significantly improve, the emission reduction potential of CCUS in the sector can also increase, reaching ${75} - {100}{\mathrm{{mtCO}}}_{2}$ in 2045, and climbing further to 100-200 ${\mathrm{{mtCO}}}_{2}$ in 2050, accounting for ${5.2}\% - {10}\%$ of the national total (Table 2).
4 Strategic Roadmap for CCUS in the Steel Sector
According to the IEA, to achieve the global energy and climate goals in light of the Paris agreement, direct carbon emissions from the steel sector will have to decrease by more than ${50}\%$ by 2050 from the 2019 levels, and ${\mathrm{{CO}}}_{2}$ emissions will have to go down to 0.6 tons of ${\mathrm{{CO}}}_{2}$ per ton of crude steel produced, and then move further down towards zero emissions. To make that happen, CCUS has increasingly been recognized as a technology of direct ${\mathrm{{CO}}}_{2}$ emission reduction on industrial scale, and yet, worldwide, the technology, by and large, is still at the early stage of pilots and demonstrations.
In China, the situation is similar. So far there are about 30 CCUS projects under operation or under construction-mostly in energy or coal-fired power plants but none has existed in the steel sector. In September 2020, China pledged to the world to peak ${\mathrm{{CO}}}_{2}$ emissions prior to 2030 and to achieve carbon neutrality in 2060. In view of the new pledge and the significant role of the steel sector in China’s low carbon strategy, it becomes increasingly relevant to consider, and indeed promote, CCUS in the steel sector as well. Although very costly now, CCUS is expected to be commercially viable on a large scale by the middle of this century, and when combined with technologies of biomass and EOR (enhanced oil recovery), the technology even has the potential to achieve negative ${\mathrm{{CO}}}_{2}$ emissions. Given the simulation results in the previous section, we develop and indeed recommend a strategic roadmap for CCUS development in China’s steel sector. The roadmap has three phases, namely the 14th FYP (2021-2025), 2025- 2035, and 2035-2060 (see Fig. 6). We highlight the key points of each of the three phases below:
Phase I (2021-2025)
Phase I overlaps with China’s 14th FYP, and it is a preparatory phase on our strategic roadmap. In this preparatory phase, China should get CCUS started in the iron/steel sector on the basis of on-going CCUS projects in other sectors. First of all, by way of by top-level design, China should work out an overall action plan to make sure the iron/steel sector, among many other industrial sectors, peak ${\mathrm{{CO}}}_{2}$ emissions by 2030. ${}^{18}$ And in line with that action plan, China should increase policy support for large-scale CCUS pilot and demonstration projects. Authorities, both at national and local levels, should explore and develop ways to support CCUS projects.
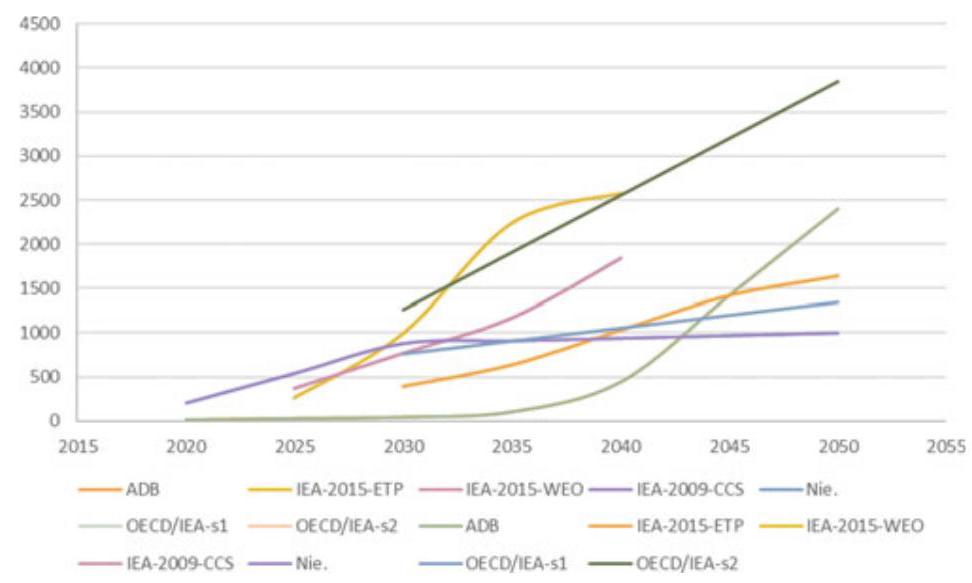
Fig. 6 Forecasts of ${\mathrm{{CO}}}_{2}$ Reduced by CCUS in China (mtCO ${}_{2}$ ). Sources ADB, Study of China’s Carbon Capture and Storage Demonstration and Promotion Roadmap, 2015; IEA, WEO 2015 Special Report on Energy and Climate Change, 2015; Nie Ligong et al., A Study of the Path to Global Commercialization of CCS Technology, 2016; OECD/IEA, Energy Technology Analysis-Prospects for ${\mathrm{{CO}}}_{2}$ Capture and Storage,2004
For example, ${\mathrm{{CO}}}_{2}$ emissions captured and stored by enterprises retrofitted with CCUS should be provided with tax credits and subsidies, including CCER (Chinese Certified Emission Reduction) and be traded in the national ETS. Specific to the steel sector, a few firms should be chosen for CCUS pilot and demonstration projects during the 14th FYP period. In the meantime, public funding to the CCUS-retrofitted firms should go beyond mere R&D money.
Phase II (2025-2035)
Phase II, from 2025 to 2035, will be to consolidate the groundwork for imporved operations of CCUS. The focus during this period should be on three areas: (a) better technologies; (b) enhanced clusters and infrastructure for large-scale full-chain CCUS operations; and (c) improved financing schemes. In terms of technology, China should increase investment in R&D of CCUS, and give stronger support to the integration of CCUS with technologies such as ULCOS and TGR-BF. In terms of infrastructure construction, China should beef up effort to develop CCUS-related industrial clusters, including infrastructure of transport and storage with optimal ${\mathrm{{CO}}}_{2}$ sink-source matching. Specific to the steel sector, during this period, the steel sector should be included in the national ETS so as to open up more channels for financing of, or give more incentives to, the deployment of CCUS for the steel sector. As in Phase I, international cooperation should be encouraged to develop CCUS in China’s industrial sectors, including the steel sector, in Phase II and beyond.
Phase III (2035-2060)
Phase III, 2035-2060, is a phase of great expansion of CCUS in China’s iorn/steel sector, now that the technogoly is relatively mature, and many CCUS-related clusters and infrastructure are ready for operations. During this phase, a sector-wide technological path for near-zero emissions should be established involving both low-carbon steelmaking technologies and CCUS as technologies of direct reductions of ${\mathrm{{CO}}}_{2}$ emissions. That aside, a new focus of the phase is to enhance international cooperations. This would invovling maintaining international standards, building level-playing field, and exploring ways to include carbon emissions reduced through CCUS in the steel sector in international ETSs, such that CCUS has a better chance to be widely applied in the pursuit of near-zero carbon emissions in the steel sector (Fig. 7).
${}^{18}$ A more optimistic prospect is that as an action plan in the making for the 14th FYP, the iron/steel sector has been planning to peak ${\mathrm{{CO}}}_{2}$ emissions by 2025 and reduce ${\mathrm{{CO}}}_{2}$ emissions by ${30}\%$ from the peak level by 2030.
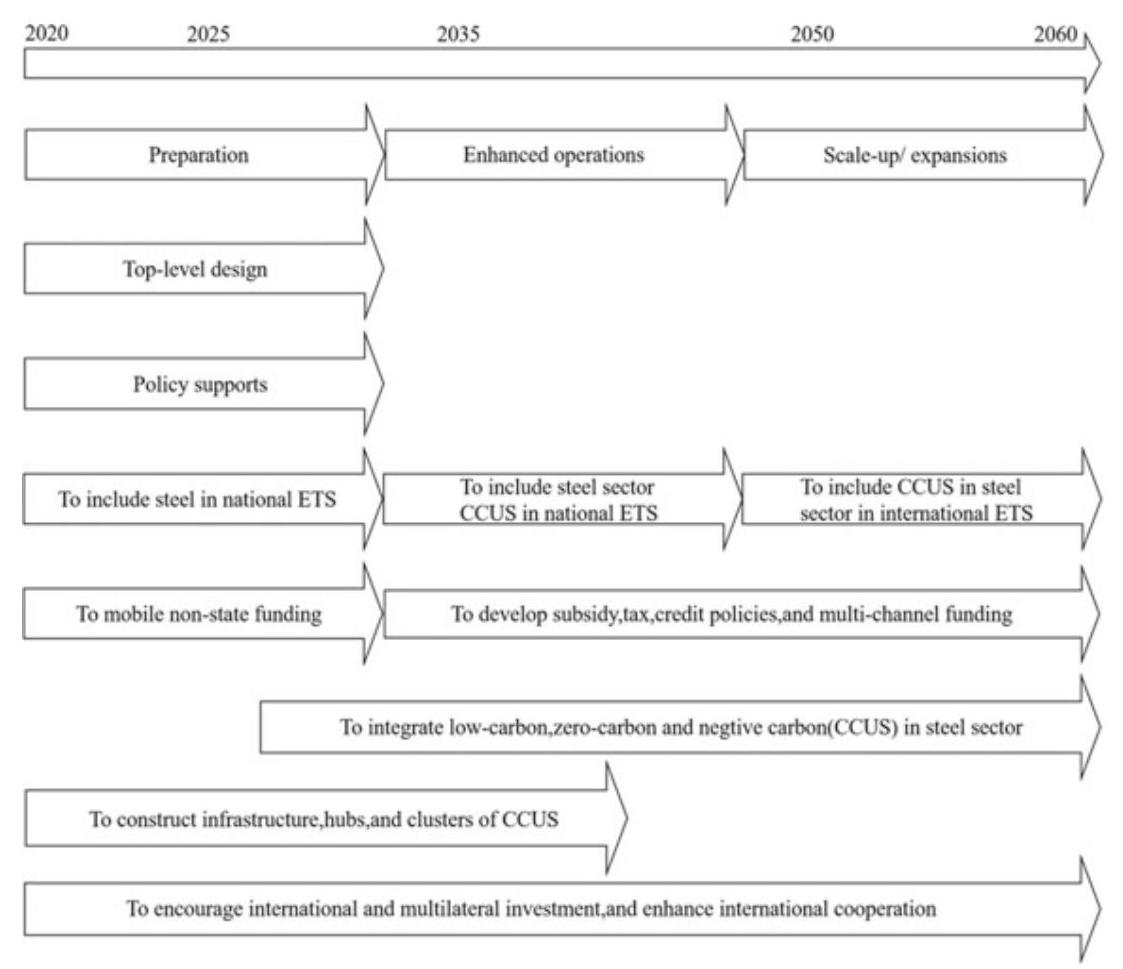
Fig. 7 A phased CCUS Policy Roadmap for Steel Sector
Acronym Full spelling
BATs Best available technologies
BFs Blast Furnaces Steelmaking
CAMU China Association of Metalscrap Utilization
CCER China certified emission reduction
CCUS Barbon capture, utilization and storage
EAF Electric are Furnace
EIA Environmental Impact Assessment
ETS Emission-trading system
FYP Five Year Plan
MEP Ministry of Environment Protection
MOF Ministry of Finance
MOST Ministry of Science and Technology
NCSC National Center for Climate Strategy and International Cooperation
NDRC National Development and Reform Commission
TGR-BF Top gas recycling blast furnace
ULCOS Ultra low ${\mathrm{{CO}}}_{2}$ steelmaking
WTO World Trade Organization
References
Asian Development of Bank. (2015) National Development and Reform Commission of China. Roadmap Research on Demonstration and Promotion of China’s Carbon Capture and Storage.
Cai, B., Pang, L., Cao, L., Li, Q., Liu, G., Zhong, P., Zhang, X., Yang, Y., Chen, F., Li, Q., Yang, X., Sun, Y., Li, Y., & Zhang, H. (2019). Two-year implementation assessment (2016-2018) of China’s technical guideline on environmental risk assessment for carbon dioxide capture, utilization and storage (on trial). Environmental Engineering, 37(02), 1-7. Global CCS Institute. Global Status of CCS Report: 2019 [EB/OL]. https://www.globalccsinstitute.com/resources/publications-rep orts-research/global-status-of-ccs-report-2019/. Accessed December 09, 2019.
China Metallurgical Industry Planning and Research Institute. (2019) Low-carbon emissions from the iron & steel industry and prospects [restricted data].
China Metallurgical Industry Planning and Research Institute. (2019). Report on energy conservation and low-carbon development in China’s iron & steel industry.
Department of Energy Statistics, National Bureau of Statistics. (2019). China energy statistical yearbook 2018. China Statistics Press.
Department of Science and Technology for Social Development, Ministry of Science and Technology, Administrative Center for China’s Agenda 21. (2019). Roadmap for carbon capture, utilization and storage technology development in China. Beijing: Science Press.
He, X., Huang, Y., & Liao, C. (2014). Review and analysis of CCS policies in domestic overseas. Advances in New and Renewable Energy, 2(2), 157-163.
IEA. (2020). Energy technology perspective 2020 [EB/OL]. https://www.iea.org/reports/ene rgy-technology-perspectives-2020. Accessed September, 2020
IEA. (2020). World Energy Outlook 2020 [EB/OL]. https://www.iea.org/reports/world-ene rgy-outlook-2020. Accessed October, 2020
IEA. (2020). Iron and steel technology roadmap [EB/OL]. https://www.iea.org/reports/iron-and-steel-technology-roadmap.Accessed October, 2020
IPCC. Special report on global warming of 1.5 [EB/OL]. https://www.ipcc.ch/sr15/
Li, X., Zhang, J., Li, Q., Liu, G., Zhang, X., & Wei, F. (2018). Implementation status and gap analysis of china’s carbon dioxide capture, utilization and geological storage technology roadmap (2011). Science & Technology Review, 36(04), 85-95.
Li, X. (2019). Roadmap to high-quality development of iron and steel industry in new age. Iron and Steel, 54(01), 1-7.
Li, X., & Li, H. Deep decarburization path for high-quality iron and steel development. China Science Daily, 003. Accessed November 10, 2020.
Ministry of Science and Technology. (2013). Notice on issuing the national 12th five-year plan for the development of carbon capture, utilization and storage [EB/OL]. http://www.gov.cn/zwgk/2013-03/11/content_2351242.htm..Accessed February 16, 2020
Ministry of ecology and environment. notice on issuing the technical guideline on environmental risk assessment for carbon dioxide capture, utilization and storage (on trial) [EB/OL]. http://www.mee.gov.cn/gkml/hbb/bgt/201606/t20160624_356016.htm.Accessed June 21, 2016.
National Bureau of Statistics. (2019). China statistical yearbook 2018. China Statistics Press.
National Bureau of Statistics. (2020). Statistical communique of the People’s Republic of China on the 2019 National Economic and Social Development [EB/OL]. http://www.stats.gov.cn/tjsj/zxfb/202002/t20200228_1728913.html.Accessed March 2020.
National Development and Reform Commission. (2013). Notice on promoting experiment and demonstration of carbon capture, utilization and storage [EB/OL]. http://www.gov.cn/zwgk/2013-05/09/content_2398995.htm.Accessed April 27, 2013.
Peng, S. (2013). Implementation of domestic and international carbon capture, utilization and storage (CCUS) projects and development of relevant policies. Low Carbon World, 1, 18-21.
United Nations. (2018). World urbanization prospects (The 2018 revision, online edition). Department of Economic and Social Affairs, Population Division
World Resources Institute. (2017). Lessons from international practices for the development of CCSL legal & regulatory framework in China [EB/OL]. https://www.wri.org.cn/CCS_ legal_and_regulatory_framework_CN. Accessed March 2017.
World Steel Association. (2020). Steel statistical yearbook 2020 [EB/OL]. https://www.wor ldsteel.org/zh/
World Steel Association. (2020). Global crude steel output decreases by 0.9% in 2020 [EB/OL]. https://www.worldsteel.org/media-centre/press-releases/2021/Global-crude-steel-output-decreases-by-0.9--in-2020.html
Wang, X. (2018). Theory and practice on energy conservation and emission reduction in China’s iron & steel industry under low carbon economy. Wuhan University Press.
Wang, X. (2020). Convergence and prospects, china 2049: economic challenges of a rising global power . Brooking Institution Press.
Yang, H., & Guo, M. (2019). Opportunities and guidelines for steel enterprises to reduce greenhouse gas emissions. China: Economic Press.
Zhang, J., Zhang, L. (2020). Preliminary discussion on the development of carbon capture, utilization and storage for carbon neutralization [J/OL]. Thermal Power Generation, 1-6. Accessed December 05, 2020.
Part II Technology
Carbon Capture, Utilization & Storage: A General Overview
Dongxiao Zhang, Ruqiang Zou, Xidong Wang, Jin Liu, and Fanyang Mo
With rapid increase in anthropogenic ${\mathrm{{CO}}}_{2}$ emissions, greenhouse effect has been more and more severe and climate change becomes a threat that influences all live beings on earth. In order to mitigate ${\mathrm{{CO}}}_{2}$ emissions, Paris Agreement was signed in 2015 which requires all countries to contribute their efforts in order to limit the global average temperature increase below $2{}^{ \circ }\mathrm{C}$ by 2050. The Paris Agreement underlines the urgent need to end the increasing trend of ${\mathrm{{CO}}}_{2}$ emissions and suggests that all technologies, either traditional or novel, should be used in reducing the emissions.
Carbon capture, utilization and storage (CCS) comes as an effective method to solve the problem, especially in fossil fuel-intensive industries. For instance, CCS in steel industry has gain more attention due to the future rising costs of carbon emissions. CCS is projected to account for 33% emission mitigation in industry by 2050, of which more than 80% the carbon dioxide captured is projected to come from steel and cement industries (IEA, 2016).
This chapter gives a general review of carbon capture, utilization and storage, as well as ${\mathrm{{CO}}}_{2}$ transportation. The chapter contains four sections: Section 1 generally introduces the layout of a typical iron/steel plant. Section 2 provides a review of the most appropriate carbon capture technologies in steelmaking. Section 3 covers emerging technologies of ${\mathrm{{CO}}}_{2}$ utilization, including ${\mathrm{{CO}}}_{2}$ -EOR (Enhanced Oil Recovery) and BECCS (Bio-Energy CCS). We look at appropriate options for COs transport and storage in Section 4.
D. Zhang $\left( \square \right) \cdot$ R. Zou $\cdot$ X. Wang $\cdot$ J. Liu $\cdot$ F. Mo
College of Engineering, Peking University, Beijing, China
Review of Typical Iron and Steel Plant Layout
Steel production consists of both a long process and a short process. The long process consists of mineral processing, sintering, ironmaking, steelmaking, and the steel rolling process. The short process begins with steel. It refers to compact production process of the combination electric arc furnace, continuous casting and continuous rolling. The main performance is the compact process of raw materials preparation, electric arc furnace melting, refining, continuous casting and rolling Current steel technology gives priority to the long process. The primary technological process in producing steel is shown in Fig. 1. The following sections will describe the long process which includes raw material preparation, ironmaking, steelmaking and steel rolling.
1.1 The Preparation of the Raw Material
1.1.1 Mineral Processing
Mineral processing of low-grade raw ore occurs via the processes of magnetic separation, flotation and re-election, followed by high grade iron concentrate in preparation for the next step of smelting. Main production processes include: crushing iron ore, grinding, mineral processing, drying, and ore concentrate powder.
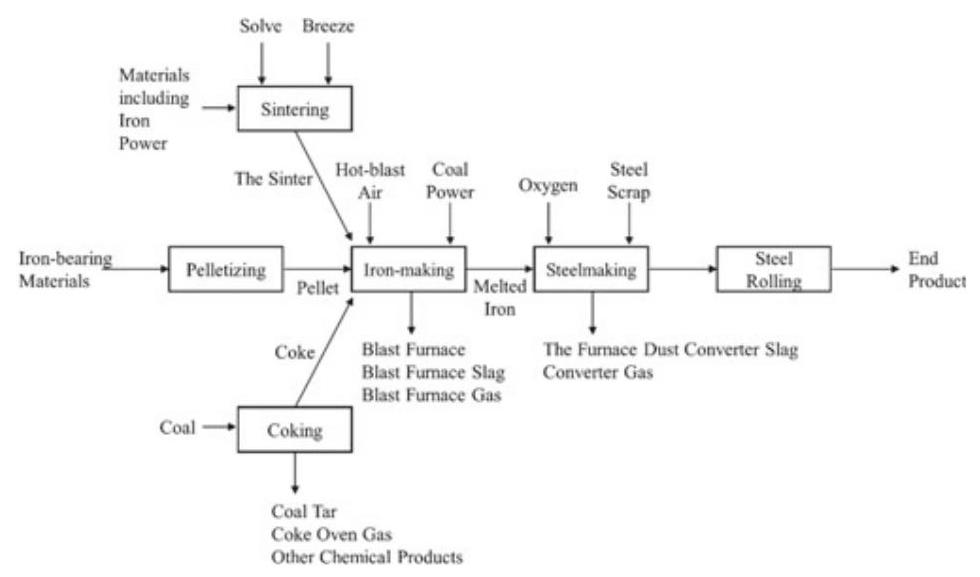
Fig. 1 Main technological processes in producing steel
1.1.2 Sintering and Pelletizing
Sintering production is the process of mixing iron powder, solvent and fuel in specific proportion and then tiling the mixture to a sintering car and ignition. This process causes solution water to evaporate and leads to a series of chemical reactions to occur, ultimately resulting in a partial liquid phase bonding with sufficient strength and granularity. Finally, after crushing, cooling and screening, we produce the finished sinter. Main production processes include burden, first-mixing, second-mixing, sintering, crushing, sieving, cooling and the finished sinter. The production of sintering generates flue gas with high sulfur content, which needs further desulfurization process.
1.1.3 Coking
Coke oven gas is a primary fuel type that is produced by sintering, coking, ironmaking, steelmaking and steel rolling processing and is used for blast furnace smelting. Coking production is the process of mixing and crushing specific coal types, and placing them in a coke oven to produce both hot and crude coke gas through the retorting process. The coking process will produce both coking gas and various other chemical products.
The coke is produced through the carbonization process, in which clean coal is heated in the vacuum-sealed carbonization chamber of the coke oven. The red-hot coke is then sent to a coke quenching tower to be cooled, crushed, sieved and classified. Following this procedure, we are able to get different particle sizes of the coke products.
1.2 Ironmaking
Blast furnace ironmaking is used to make iron ore or iron-bearing materials into the qualified liquid iron by using a reducing agent (such as coke, coal, etc.) at high temperature.
The production process for blast furnace ironmaking is mainly composed of a blast furnace stack and a number of auxiliary systems. The body of blast furnace consists of a furnace throat, stack, bosh, belly, and hearth (moving from top to base of the structure). The auxiliary system consists primarily of feeding, air-supply, coal powder injection control, blast furnace cooling, iron slag and gas purification systems.
The blast furnace ironmaking process begins with the mixing of sinter, pellets, raw ore and other materials in prescribed proportions, sending the mixture to the top of a charging device via a belt or car, and keeping the material surface at a specific height. In this environment, the materials will form ore and coke in alternating layers within the furnace. The coke with then reacts with oxygen, forming carbon monoxide and hydrogen by blowing high-pressure, hot air from the tuyere around hearth. Descending furnace charge and rising coal gas will transfer heat, resulting in reduction, melting, decarburization of the coke to generate the raw iron and slag. Both the molten iron and slag are alternatively expelled from the base of the hearth. The slag and iron are then separated by the skimmer. Molten iron is poured into torpedo ladles or hot metal packages and are sent to steelmaking plants. After the quenching process by water, blast furnace slag can find its use in construction to produce cement. After various processing steps (gravity precipitation, bag dedusting and Top-Pressure Recovery Turbine Plant (TRT) power generation), the coal gas formed at the top furnace can be incorporated into a gas pipe network.
1.3 Steelmaking
The steelmaking process is divided into four processes: molten iron pretreatment, converter steelmaking, refining outside the furnace and continuous casting. The basic tasks of the steelmaking process require the removal of a number of elemental compounds (carbon, phosphorus, sulfur, nitrogen and hydrogen) and the removal the non-metallic inclusions. After this purification process, the material is then heated and molded.
1.3.1 Molten Iron Pretreatment
Molten iron pretreatment is the preparation process for the molten iron of the blast furnace before it is sent to the steel furnace. Without an additional heat source, active substances in the treatment agents will react rapidly with sulfur, phosphorus and silicon. Thus, these elements are removed from the molten iron to form a stable slag phase separate from the molten iron. This process simplifies the steelmaking process and improves the quality of steel.
1.3.2 The Converter Steelmaking
The oxygen converter allows high-speed oxygen to oxidize with the carbon, phosphorus, sulfur, nitrogen and hydrogen in steel to produce slag. The oxidation process also removes non-metallic elements and provides a heat source. The process of steel tapping includes charging and converting the material, deoxidizing steel tapping, slag-splashing for furnace protection and, finally, pouring the slag.
1.3.3 Refining Outside the Furnace Process
Steel refining outside the furnace begins by converting the molten steel produced from primary smelting and pouring the converted steel into ladles. The steel proceeds to undergo deoxidization, desulphurization, decarbonization, and degassing. Non-metallic inclusions are then removed and liquid steel compositions are exposed to high temperatures and undergoes further smelting.
1.3.4 Continuous Casting Process
The continuous casting process is to transform steel from molten state to solid state by use of molds during solid-state phase transformation. The liquid - solid phase change occurs when cool water reacts with the surface of the casting billet, causing the molten steel to undergo the processes of crystallization and casting. In the continuous casting process, the steel will undergo phase transformation and the ingot may experiences bending, correction and some other changes.
1.4 Steel Rolling
The process of steel rolling places rolled pieces of steel into a high-speed roller to generate a desired shape. According to the product types of steel rolling, it can be divided into shaped steel, wire rod, sheet metal and pipe steel. According to production methods, it can be divided into hot rolling and cold rolling.
During the hot rolling process, steel is rolled at temperatures above the recrystallization temperature. This process includes: heating, dephosphorization, roughing rolling, top cutting, precision rolling, laminar cooling, crimp, finishing and plate cutting or heavy rolling.
Cold rolling is steel rolling that occurs at temperatures below the recrystallization temperature. This process includes: dephosphorization with acid pickling, cold rolling, degreasing, annealing, leveling, skin rolling, classifying and packaging.
2 Review of Most Appropriate Carbon Capture and Utilization Technology
2.1 Carbon Capture Technology
The most appropriate technologies used to capture ${\mathrm{{CO}}}_{2}$ can be classified as five types (Carpenter, 2012):
Adsorption;
Chemical or physical absorption, or the combination;
Physical separation;
Phase separation;
Chemical bonding.
2.1.1 Adsorption Capture Technology
Adsorption is a mass transfer process where molecules from gas phase are attracted to the surface of a solid material. Adsorption technology in carbon capture involves the passing of a gas stream containing ${\mathrm{{CO}}}_{2}$ through a series of adsorbent beds, where ${\mathrm{{CO}}}_{2}$ are adsorbed. To achieve a desired carbon capture rate, multiple adsorbent cascades are usually used. Once the first adsorbent bed is saturated, the stream is sent to the second bed. The fully loaded bed can be regenerated for recycle use (Wilcox et al., 2014). Therefore, adsorption-based carbon capture is a cyclic process where adsorption and desorption operations are alternately applied. Based on the desorption technique, adsorption technology can be divided into two main categories: the pressure swing adsorption (PSA) (or vacuum pressure swing adsorption, VPSA) and the temperature swing adsorption (TSA) (Olajire, 2010; Wilcox et al., 2014). For PSA, bed regeneration is achieved via reducing the pressure. While for TSA, the adsorbent bed is recycled via increasing the temperature. PSA technology is usually to treat gas stream with high ${\mathrm{{CO}}}_{2}$ concentration, and when the concentration of ${\mathrm{{CO}}}_{2}$ is insignificant, TSA method is favored (Carpenter, 2012; Wilberforce et al., 2019).
Zeolites are crystalline aluminosilicate materials that have a highly ordered porous structure with pore sizes at sub-nanometer scales (Figueroa et al., 2008). Zeolites are widely used as commercial adsorbents for ${\mathrm{{CO}}}_{2}$ capture. Especially, Zeolite-13X is considered as a benchmark for ${\mathrm{{CO}}}_{2}$ adsorption under relatively low temperature (Bui et al., 2018; Hao et al., 2011). Early research has shown that the primary adsorption mechanism for zeolites is physical adsorption, while some studies report that the chemical adsorption mechanism also exists (Spigarelli &Kawatra,2013). To remove both physically and chemically adsorbed ${\mathrm{{CO}}}_{2}$ , the fully loaded zeolites are usually regenerated via a TSA method. The main virtue of zeolites as ${\mathrm{{CO}}}_{2}$ adsorbents are: (1) it has high ${\mathrm{{CO}}}_{2}$ capacity with fast adsorption kinetics; (2) the adsorption performance can be operated under relatively mild conditions $\left( {0 - {100}{}^{ \circ }\mathrm{C},0,1 - 1\text{ bar }{\mathrm{{CO}}}_{2}}\right)$ (Spigarelli &Kawatra,2013). The main drawback of zeolites is that zeolites are very sensitive to impurities such as ${\mathrm{{NO}}}_{\mathrm{x}}$ , ${\mathrm{{SO}}}_{\mathrm{x}}$ , and ${\mathrm{H}}_{2}\mathrm{O}$ . These impurities can strongly interact with zeolites, which significantly decrease the uptake of ${\mathrm{{CO}}}_{2}$ . Therefore, the flue gas needs to be scrubbed prior to zeolite adsorption process in order to remove any gaseous impurities.
Activated carbon is widely used as a physical adsorption material for ${\mathrm{{CO}}}_{2}$ capture (Lee & Park, 2015). It processes an advantage over other adsorbents for its low-cost and high thermal stability (Spigarelli & Kawatra, 2013). In addition, the pore size of activated can be easily adjusted via changing the material preparation and activation methods (Lee & Park, 2015). The structure of activated carbon can be further functionalized to improve the ${\mathrm{{CO}}}_{2}$ capacity and selectivity of the adsorbent.
Metal oxides such as $\mathrm{{CaO}}$ and $\mathrm{{MgO}}$ are common chemical adsorbents for ${\mathrm{{CO}}}_{2}$ separation. They can isolate ${\mathrm{{CO}}}_{2}$ through the formation of carbonates. MgO, in particular, has the advantages of low-cost, high abundancy, and low toxicity (Lee & Park, 2015). However, compared to zeolite and activated carbon, the ${\mathrm{{CO}}}_{2}$ capacity of $\mathrm{{MgO}}$ is relatively low, especially under dry conditions.
2.1.2 Absorption Capture Technology
Absorption is a chemical or physical process in which molecules of absorbate are dissolved in a bulk absorbent solution. It is a different process from adsorption as absorption is a bulk phase phenomenon whereas adsorption means accumulation of molecules at the surface. Absorption process is a commonly used technology in industry as well as in power plants to isolate ${\mathrm{{CO}}}_{2}$ from flue and fuel gases.
Chemical Absorption
Chemical adsorption is known as the most mature and reliable strategy for ${\mathrm{{CO}}}_{2}$ separation (Leung et al.,2014). It is suitable for large scale ${\mathrm{{CO}}}_{2}$ removal and can be applied even with low flue gas concentration. As ${\mathrm{{CO}}}_{2}$ is an acidic gas, the chemical absorbents used for ${\mathrm{{CO}}}_{2}$ capture are usually amine-based solvents such as solutions of alkanolamines. During absorption process, flue gas containing ${\mathrm{{CO}}}_{2}$ is introduced from the bottom of a packed absorber column, and the absorbent is introduced from the top of the column. When the flue gas encounters the absorbent, they react with each other, forming an ${\mathrm{{CO}}}_{2}$ -rich stream. This stream is then sent to a regenerator unit, where ${\mathrm{{CO}}}_{2}$ can be stripped and absorbent solvent can be recycled through heating $\left( {{100} - {200}^{ \circ }\mathrm{C}}\right)$ . Amine absorption technology (amine scrubbing) with monoethanolamine (MEA) is a commercialized technology and is considered as the most mature ${\mathrm{{CO}}}_{2}$ capture technology in natural gas industry (Olajire, 2010). MEA process benefits from high reaction rate, low cost, and easy amine regeneration. The ${\mathrm{{CO}}}_{2}$ recycle rate can reach to ${98}\%$ (Olajire, 2010). However, this method suffers from several disadvantages such as (1) limited ${\mathrm{{CO}}}_{2}$ loading capacity (0.5 mol/mol amine) (Mondal et al.,2012); (2) high equipment corrosion rate; (3) amine loss due to ${\mathrm{{SO}}}_{2},{\mathrm{{NO}}}_{2},\mathrm{{HCl}},\mathrm{{HF}}$ , and oxygen in atmosphere; (4) high energy consumption during solvent regeneration.
Physical Absorption
For physical absorption, ${\mathrm{{CO}}}_{2}$ capture is based on the solubility of ${\mathrm{{CO}}}_{2}$ within the organic solvent, rather than the acid-base reaction. A high-temperature, low-pressure condition is favored to reach to an appropriate ${\mathrm{{CO}}}_{2}$ solubility. A typical absorbent used for physical absorption technology is Selexol. Selexol process has been commercially applied since 1969 to remove both ${\mathrm{{CO}}}_{2}$ and ${\mathrm{H}}_{2}\mathrm{\;S}$ from natural gas (Olajire,2010). The absorption process take place at $0 - {5}^{ \circ }\mathrm{C}$ . And Selexol solvent can be recycled via decreasing the pressure or bubbling air through the solution. The advantages of Selexol technology include: (1) low operation cost; (2) low heat rise; (3) gas is dry after selexaol treatment; (4) low energy required for solvent regeneration; (5) absorption can be conducted under low pressure. The main weakness of Selexol process include: (1) solvent degradation due to hydrocarbon loss; (2) the process is more efficient under high pressure.
2.1.3 Membranes Capture Technology
Membranes are selective barriers that act as filters to isolate specific gas molecules from the feed matrix (Favre, 2011; Merkel et al., 2010). Membrane technology is a relatively new approach that can be used to separate ${\mathrm{{CO}}}_{2}$ from flue gas, natural gas or hydrogen. It could also serve as another option besides cryogenic method to obtain pure oxygen from nitrogen (Mondal et al., 2012; Olajire, 2010). There are three main possible mechanisms for membrane separation: the Knudsen diffusion mechanism, the molecular sieving mechanism, and the solution diffusion mechanism (Giorno et al., 2015; Inagaki & Kang, 2014). Knudsen mechanism is based on the phenomenon that the gas molecules have more interactions with the pore wall than with each other if the pore diameter is smaller than the mean free path length of the diffusing gas molecules (Giorno et al., 2015). This method can be used to separate gases with different molecular weights. When a mixture of heavy gases and light gases enter the pore, the heavy gases will have more collision with the pore wall and lose more energy than the light gases. As a result, the heavy gases will pass through the membrane slower the light gasses. In this way, gas isolation can be achieved. Molecular sieving method separates gases on the basis of size. Molecular sieves are materials with very small pores. If the size of gas molecule is smaller than the pore size of molecular sieves, the gas can permeate, otherwise, the gas is stopped. The adsorption rate of gases highly depends on the pore size of molecular sieves. In addition, temperature also plays an important role in determining the adsorption rate of gas molecules (Inagaki & Kang, 2014). The solution diffusion mechanism is mainly applied to polymer membranes (Ismail et al., 2005). In solution diffusion model, gases are dissolved in membrane material and diffuse through the membrane, forming a concentration gradient. A separation is achieved owing to the differences in the solubility of gases in the membrane material and the diffusion rate of gas molecules.
Membranes can be made of either organic (polymeric) or inorganic (metallic, ceramic, zeolite, carbon) materials (Olajire, 2010). Generally, polymeric membranes are primarily based on the solution-diffusion mechanism. Some of the polymers that have been studied and applied in membrane technology include polysulfones, polyamides, polyacetylenes, polyanilines, etc. (Lee & Park, 2015; Olajire, 2010). Inorganic membranes mainly rely on the Knudsen diffusion and molecular sieving mechanisms. Inorganic membranes can be divided into two categories: nonporous (dense) inorganic and porous inorganic membranes (Seoane et al., 2015). Nonporous inorganic membranes are generally utilized for selective separation of hydrogen (through palladium alloys) or oxygen (through perovskite materials). Porous inorganic membranes such as carbon and zeolites can be functionalized with a layer of ${\mathrm{{CO}}}_{2}$ -philic compound to improve their affinities towards ${\mathrm{{CO}}}_{2}$ . Membrane technology benefits from its process simplicity, high flexibility, low energy use, and low requirements for chemical addition (Lee & Park, 2015). However, membrane is not suitable for large-scale filtration. And the durability of membrane material is relatively low. Therefore, a multistage configuration is usually applied in membranes-based system to achieve continuous separation and obtain ${\mathrm{{CO}}}_{2}$ with desired purity (Faruque Hasan et al.,2014).
2.1.4 Cryogenics Capture Technology
Cryogenic distillation method is another commercially available approach for ${\mathrm{{CO}}}_{2}$ separation (Mondal et al., 2012; Olajire, 2010). It is a process that involves cooling and compression of gases, and is commonly used to produce liquid phase ${\mathrm{{CO}}}_{2}$ . Cryogenic technology is suitable for capture ${\mathrm{{CO}}}_{2}$ with relatively high concentration. During cryogenic process, ${\mathrm{{CO}}}_{2}$ gas is cooled at a very low temperature and desublimates to solid phase. The solid ${\mathrm{{CO}}}_{2}$ is isolated from the gaseous matrix and the separation is achieved. The frozen ${\mathrm{{CO}}}_{2}$ is then melted with lifting temperature to obtain purified liquid ${\mathrm{{CO}}}_{2}$ .
Cryogenic process is a method with high reliability and low investigation cost. It can be applied as an alternative to chemical scrubbing method because it requires less water during operation and generates fewer chemical pollutions. In addition, the cost for cryogenic distillation is relatively low and the device for cryogenic system is more corrosion resistant (Lee & Park, 2015; Wilberforce et al.,2019). As the obtained ${\mathrm{{CO}}}_{2}$ is a cryogenic liquid, they can be easily transported. In fact, in terms of transporting ${\mathrm{{CO}}}_{2}$ by ship, it is most convenient and economically friendly to transport ${\mathrm{{CO}}}_{2}$ in a liquid form (Boot-Handford et al., 2014). Although cryogenic technology offers many advantages, it also suffers from several drawbacks (Olajire, 2010). First, the cooling and heating processes of cryogenic distillation need to consume a great amount of energy, which creates significant energy penalty for carbon capture. Second, impurities such as ${\mathrm{{SO}}}_{\mathrm{X}}$ , ${\mathrm{{NO}}}_{\mathrm{x}}$ , and ${\mathrm{H}}_{2}\mathrm{O}$ can have negative impact on the distillation process. These impurities can also cause corrosion and plugging to the equipment. The formation of ice from water molecules can block pipes and result in severe safety problems. Therefore, it is important to remove trace moisture from feed gas prior to the cryogenic approach, which increases the cost.
2.1.5 Gas Hydrate-Based Capture Technology
Hydrate-based ${\mathrm{{CO}}}_{2}$ capture (HBCC) technology is a relatively novel ${\mathrm{{CO}}}_{2}$ capture process. Due to numerous advantages over conventional capture technologies, HBCC has drawn lots of attention from academia and industry. Advantages include mild operational temperature, easy recycling of aqueous solution, allowance of large-scale operation and most importantly, economic advantage (Dashti et al.,2015). The capture mechanism is rather simple. When ${\mathrm{{CO}}}_{2}$ contacts with water under certain condition (below equilibrium temperature and above equilibrium pressure), it forms gas hydrate in which ${\mathrm{{CO}}}_{2}$ concentration is much higher than the gas phase. Subsequently, gas hydrate is separated from the gas and ${\mathrm{{CO}}}_{2}$ is collected from the hydrates in a dissociation reactor, either by heating or depres-surization. The water remained is recycled and used in the gas hydrate formation process again. In practice, the whole process is repeated several times to increase the purity of ${\mathrm{{CO}}}_{2}$ . Also, chemical additives are needed to reduce the equilibrium pressure (thermodynamic promoters) and increase the hydrate formation rate (kinetic promoters). The chemical additives receive lots of research interests. Propane, cyclopentane, tetrahydrofuran and tetra-n-butyl ammonium bromide are most investigated thermodynamic promoters while dodecyl-trimethyl-ammonium chloride, sodium dodecyl sulphate, and Tween-80 are commonly used kinetic promoters.
2.1.6 Mineral Carbonation Capture Technology
Slags are by-products produced after desired metal has been separated from its own ore. In iron and steel making process, slags are composed of silicates, free lime and other minerals and thus are capable of reacting with ${\mathrm{{CO}}}_{2}$ . For example, calcium oxide in the slags could react with ${\mathrm{{CO}}}_{2}$ to form calcite. Such reaction is called mineral carbonation by which ${\mathrm{{CO}}}_{2}$ is captured and permanently stored. Generally, two types of carbonation processes are developing (Baciocchi et al., 2010). The direct carbonation involves ${\mathrm{{CO}}}_{2}$ reacting with slags directly, either in the aqueous phase or at the gas-solid interface. However, in the indirect carbonation process, the metal in slags is firstly extracted with hydrochloric acid (Kunzler et al., 2011), acetic acid (Eloneva et al., 2008; Teir et al., 2007), nitric acid (Doucet, 2010), hydroxides or ammonium salts (Fogelholm et al., 2009). Then ${\mathrm{{CO}}}_{2}$ reacts with extracted metal to form precipitate.
Capturing ${\mathrm{{CO}}}_{2}$ with mineral carbonation has its limitations. First of all, the process has large energy consumption and the solvent regeneration is expensive (Doucet, 2010). Additionally, the whole process itself generates large quantities of ${\mathrm{{CO}}}_{2}$ which makes the capture less efficient. However, the process has numerous advantages. Economically, produced products of the carbonation are profitable. For instance, the carbonates are highly demanded in agricultural and construction applications. Carbonates with high quality would enable its sale to the paper industry (Fogelholm et al., 2009). On the other hand, the process has environmental benefits. Carbonated slag blocks can be put into the ocean to promote the algae growth which will transform ${\mathrm{{CO}}}_{2}$ into ${\mathrm{O}}_{2}$ through photosynthesis (Baoshan Iron & Steel, 2008). The blocks can also be used in endangered reef areas to buffer the ocean acidification.
2.1.7 Emerging Carbon Capture Technologies
In recent years, a great number of emerging carbon capture technologies have been reported as promising solutions to reduce ${\mathrm{{CO}}}_{2}$ emission. Some of the innovative low-carbon technologies have already been applied in demonstration scale or are in early commercialization stage (ADB, 2020). For example, solid sorbent technology, as a new ${\mathrm{{CO}}}_{2}$ capture process that can isolate over ${90}\%$ of ${\mathrm{{CO}}}_{2}$ from the post-combustion flue gas stream, has been commercialized through the ViennaGree ${\mathrm{{CO}}}_{2}$ project, and will be used in pilot plants in Netherlands. A following TuilpGreen ${\mathrm{{CO}}}_{2}$ demonstration project is also in progress to upscale this technology to full commercial stage. A ${\mathrm{{CO}}}_{2}$ capture system proposed by Francois Marechal team aims to separate ${\mathrm{{CO}}}_{2}$ from internal combustion engine. This proposed system is still in research stage, but it shows great potential to be applied in Asia and other regions. Another ${\mathrm{{CO}}}_{2}$ capture technology that is highly relevant for implementation in Asia is called the Compact Carbon Capture system. The size of this system can be up to ${75}\%$ smaller than conversional amine capture systems, which means that the Compact Carbon Capture system can be built in many of the existing power plants where CCS model was not designed in advance. Recently, Carbon Infinity, a company that was founded by research experts at Shanghai Jiao Tong University, developed a direct air capture (DAC) system that enables the removal of ${\mathrm{{CO}}}_{2}$ from gas mixture and convert ${\mathrm{{CO}}}_{2}$ to value-added carbon-based industrial products. DAC system has attracted the attention of the Abu Dhabi government, and there has been increasing interests across Asia in bringing this system to market.
2.1.8 Carbon Capture Recommendation
Carbon capture face some limitations. As can be seen, many capture technologies suffer from high energy consumption and, where used, steam consumption. A potential solution is to utilize waste heat from other on-site processes to regenerate the capture solvents. Another limitation is economical. By far, ${\mathrm{{CO}}}_{2}$ capture is expensive which will hinder its widespread commercial deployment. There are two solutions towards this problem. First of all, promoting large CCS projects could be helpful in cutting costs since large-scale ${\mathrm{{CO}}}_{2}$ capture costs less. Furthermore, developing new technologies is another way forward. For example, HIsarna process, which is designed to generate a nitrogen-free and ${\mathrm{{CO}}}_{2}$ -rich off gas which will make ${\mathrm{{CO}}}_{2}$ capture easier and cheaper. If these two limitations are overcome, then CCS projects could be more widely deployed.
3 Carbon Utilization Technology
Millions of tonnes of ${\mathrm{{CO}}}_{2}$ are used in industry each year, and the idea that combining ${\mathrm{{CO}}}_{2}$ utilization with $\mathrm{{CCS}}$ is quite appealing. Instead of disposing ${\mathrm{{CO}}}_{2}$ as a waste, delivering it to willing buyers is a better way on an economic analysis. However, ${\mathrm{{CO}}}_{2}$ utilization could only act as a driving force to develop CCS but cannot replace geological storage. The reason is that the uses are rather limited when considered to be applied to CCS. For instance, the global beverage industry consumes nearly 8 million tonnes ${\mathrm{{CO}}}_{2}$ per year, which is only ${0.5}\%$ of the ${\mathrm{{CO}}}_{2}$ need to be captured and stored by 2030. Therefore, the ${\mathrm{{CO}}}_{2}$ demand of different approaches should be considered in order to match the capture capacity. The emission reductions and financial contribution should also be analyzed.
3.1 CO2 Used for Enhanced Oil Recovery
Enhanced oil recovery is the major source of ${\mathrm{{CO}}}_{2}$ utilization, with ${70}\mathrm{{Mt}}{\mathrm{{CO}}}_{2}$ used annually, which is also called tertiary oil recovery. ${\mathrm{{CO}}}_{2}$ -EOR technology is injecting ${\mathrm{{CO}}}_{2}$ into an underground geologic zone that contains hydrocarbons to produce the oil. The ${\mathrm{{CO}}}_{2}$ is produced together with oil and then recycled back to recover more oil.
The United States began to conduct relevant projects decades ago and has sequestrated millions of tonnes of ${\mathrm{{CO}}}_{2}$ underground. However, only around one-third of quantities of ${\mathrm{{CO}}}_{2}$ are from anthropogenic sources. Additionally, at present the main concern of ${\mathrm{{CO}}}_{2}$ -EOR is to enhance oil recovery. Therefore, EOR technology should be improved when used either primarily or secondarily for CCS. For example, incorporating monitoring and validation systems into EOR could help ensure the long-term retention of ${\mathrm{{CO}}}_{2}$ .
Sequestrating ${\mathrm{{CO}}}_{2}$ in reservoirs can not only enhance oil and gas recovery, but could have the added benefit of reducing ${\mathrm{{CO}}}_{2}$ emission. However, when we use numerical models to simulate the process of ${\mathrm{{CO}}}_{2}$ -EOR, a problem arises when ${\mathrm{{CO}}}_{2}$ sequestration and EOR should be co-optimized at the same time. Jahangiri and Zhang (2012) proposed the ensemble-based optimization (EnOpt) method to optimize ${\mathrm{{CO}}}_{2}$ storage and oil recovery process simultaneously.
This study takes both ${\mathrm{{CO}}}_{2}$ storage and oil production into account and uses net present value of the CCS project as the optimization objective function. The proposed methodology presented in this work can be achieved with most reservoir simulators and thus designing and co-optimizing the coupled ${\mathrm{{CO}}}_{2}$ sequestration and EOR is possible.
3.2 CO2 Used in Iron Making Process
Hong (2012) from Northeastern University China applied ${\mathrm{{CO}}}_{2}$ as a desiliconizing agent for hot metal. The experiments were carried out in a laboratory induction furnace, with 1 kg of material prepared using a pig iron with iron silicide with silicon content around ${0.745}\mathrm{{wt}}\% .{\mathrm{{CO}}}_{2}$ is injected into hot metal through a quartz tube for desiliconizing under different temperatures ranging from 1300 to ${1500}{}^{ \circ }\mathrm{C}$ , and different gas flow rates ranging between 0.2 and ${0.6}\mathrm{\;L}{\mathrm{\;{min}}}^{-1}$ . The results showed that the mass transfer of gas is the rate-limiting step of desi-liconizing reaction with ${\mathrm{{CO}}}_{2}$ . Under constant temperature, higher gas flow rate will give better desilication. On the contrary, at certain gas flow rate, higher temperature leads to lesser desilication. This is in conformity with thermodynamic analysis since desilication is an exothermic reaction and lower temperature would favour desilication.
Guo et al. (2010) patented the use ${\mathrm{{CO}}}_{2}$ as the transmission medium for pulverized coal injection into a blast furnace instead of ${\mathrm{N}}_{2}$ or compressed air. Pulverized coal was first transferred by ${\mathrm{{CO}}}_{2}$ from bins to pipes then injected into BF with ${\mathrm{{CO}}}_{2}$ as the carrier. This was expected to enhance the proportion of $\mathrm{{CO}}$ in the BF gas, hence increase the quality and reducing the coke rate. This is in part due to ${\mathrm{{CO}}}_{2}$ concentrations around tuyeres being very high, and the reaction $\mathrm{C}\left( \mathrm{s}\right) + \; {\mathrm{O}}_{2}\left( \mathrm{\;g}\right) = {\mathrm{{CO}}}_{2}\left( \mathrm{\;g}\right)$ will be restrained while the reaction ${\mathrm{{CO}}}_{2}\left( \mathrm{\;g}\right) + \mathrm{C}\left( \mathrm{s}\right) = 2\mathrm{{CO}}\left( \mathrm{g}\right)$ will be promoted. One should notice that it is essential to control the ${\mathrm{{CO}}}_{2}$ proportion in the mixed gas, because higher ${\mathrm{{CO}}}_{2}$ will increase the potential energy of the coke reaction. This will result in large amounts of cracks and pores within the coke, decreasing the coke strength. In this case, it will deteriorate the permeability of stock column during the descending process.
Almost at the same time in 2010, Fu et al. (2010) invented a method of injecting carbon dioxide into BF with the aim to reduce the coke ratio. ${\mathrm{{CO}}}_{2}$ is produced from the exhaust gas of the hot blast stove or other exhaust gases which contain ${\mathrm{{CO}}}_{2}$ . Replacing the ${\mathrm{O}}_{2}$ -rich gas stream with ${\mathrm{{CO}}}_{2}$ will result in drastic decreases in temperature, hence the temperature of the injecting gas needs to be increased when introducing ${\mathrm{{CO}}}_{2}$ into the BF. There is no industrial application being reported for the above two patents, maybe because it is difficult to operate.
3.3 CO2 Used in Steel Making Process
3.3.1 CO2 Used in Converter Process
Decarburization
The use of ${\mathrm{{CO}}}_{2}$ for decarburization has a history of around 30 years in China. Back in 1985, Jin (1985), an industrial researcher from Shanghai’s No. 1 steel plant, reported the positive effects of ${\mathrm{N}}_{2} - {\mathrm{{CO}}}_{2}$ bottom blowing in a ${15}\mathrm{t}$ converter. It was reported that this application can enhance the decarburization efficiency and decrease the total iron oxide concentrations $\left( {\sum }^{\mathrm{{FeO}}}\right)$ in the final slag. However, the corrosion of the refractory around tuyere was found to be severe.
Wang (1986, 1989) carried out a series studies during 1986-1989 on the bottom blowing of ${\mathrm{{CO}}}_{2}$ bearing gases. The high temperature experiments were carried out and the result showed that with ${\mathrm{{CO}}}_{2}$ bottom blowing, the decarburization rate is larger than other gases in the middle period of decarburization. Similar work was carried out elsewhere (Hara et al., 1986; Paules, 1987), aiming to investigate the effect of ${\mathrm{{CO}}}_{2}$ during bottom blowing. The results of these studies showed that ${\mathrm{{CO}}}_{2}$ is an effective alternative for ${\mathrm{N}}_{2}/\mathrm{{Ar}}$ bottom blowing, since it will not increase the nitrogen content in liquid steel. This would also be a superior alternative to bottom blowing ${\mathrm{O}}_{2}/{\mathrm{C}}_{x}{\mathrm{H}}_{y}$ in converter as the dissolved hydrogen content would not increase during the operation. The mechanism of bottom blown ${\mathrm{{CO}}}_{2}$ in the bath of combined blown converter was investigated in later stage (Guo & Chen,1993) by Chinese researchers and the industrial test of ${\mathrm{{CO}}}_{2}$ bottom blowing was carried out in a 180 t converter in Anshan Steel Plant (Li & Han, 1996). However, this technology could not be applied in the industry initially due to the short lifetime of the purge plug.
During the experiment, it is found that the corrosion of the tuyere is severe just as Shanghai No. 1 steel’s practice (Jin, 1985). It was suggested that, during the progress of decarburization, the carbon content in the melt would be very low and, consequently, the carbon in refractory around tuyere will dissolve into the melt.
Anshan Steel Plant carried out further research to solve the refractory problem and increase the lifetime of tuyere to 1500-2000 times of use. ${\mathrm{{CO}}}_{2}$ bottom blowing in converter had been used widely in this plant until the paper of (Li & Han,1996) was published. Sodium carbonate $\left( {{\mathrm{{Na}}}_{2}{\mathrm{{CO}}}_{3}}\right)$ solution absorption method was adopted by Anshan Steel Plant for ${\mathrm{{CO}}}_{2}$ production but the cost of ${\mathrm{{CO}}}_{2}$ preparation has not been reported.
Utilization of ${\mathrm{{CO}}}_{2}$ in metallurgical processes in China has been studied by Jin et al. (2007) and Yi et al. (2009). They started the work around 2004-2005 and named the new process the COMI $\left( {\mathrm{{CO}}}_{2}\right.$ and ${\mathrm{O}}_{2}$ Mixed Injection) process. In 2007, experimental study of steelmaking with ${\mathrm{{CO}}}_{2} - {\mathrm{O}}_{2}$ mixture was carried out by a ${10}\mathrm{\;{kg}}$ induction furnace, with the initial carbon content of around ${2.5}\mathrm{{wt}}\%$ . The result showed that it is feasible to decarburize the melt with ${\mathrm{{CO}}}_{2} - {\mathrm{O}}_{2}$ , and they pointed out that the maximum amount of ${\mathrm{{CO}}}_{2}$ introduction in converter is 13% (Jin et al., 2007).
The process was implemented in 2009 in industrial experiments (Yi et al., 2009) with ${\mathrm{{CO}}}_{2}$ addition ratio of around $7\%$ , and the results were very positive. The consumptions of lime, iron ore as well as oxygen with COMI process were all lower than that with conventional process. Additionally, the Total iron $\left( {\mathrm{T}}_{\mathrm{{Fe}}}\right)$ content in slag was decreased by 1.79 wt% compared to the conventional method.
Dust Reduction
One of the important achievements in Chinese research with regards to the benefit of using ${\mathrm{{CO}}}_{2}$ in the converter process is that it can reduce the generated amount of converter dust. The characteristics and mechanism of dust generation was also investigated by Bi et al. (2010). Both laboratory and industrial experiments have been carried out in China (Ning et al., 2009; Yin et al., 2009; Zhu et al., 2010) and the results showed that, with an increase in the ${\mathrm{{CO}}}_{2}$ ratio in the mixture gas, the dust generation is decreased.
Evaporation was considered as the main reason for fine (micro size) dust formation, which constitutes more than 60% of converter dust. The main content of the converter dust is ${\mathrm{{FeO}}}_{x}$ (around ${50}\%$ of total dust). With the oxygen injecting into hot metal, a fire zone forms with temperature higher than ${2500}{}^{ \circ }\mathrm{C}$ (maximum ${3000}{}^{ \circ }\mathrm{C}$ ). As the boiling point of iron is ${2750}{}^{ \circ }\mathrm{C}$ , iron will be oxidized and evaporate to form dust at lower temperatures. If one can decrease the temperature of the oxygen jet fire zone, dust generation is expected to decrease. Based on the endothermic nature of the Boudouard reaction, namely the reaction of ${\mathrm{{CO}}}_{2}$ and C, if ${\mathrm{{CO}}}_{2}$ is mixed with ${\mathrm{O}}_{2}$ to form the oxidizer gas mixture, the temperature of the fire zone will be lowered so as to decrease the oxidation evaporation of Fe.
The result obtained by Yin et al. (2009) has shown that, compared to the conventional steelmaking process, when ${\mathrm{{CO}}}_{2}$ volume ratio is $5\%$ , the dust amount is decreased by ${25}\%$ , while at the same time, the ${\mathrm{T}}_{\mathrm{{Fe}}}$ content in the dust is reduced by about 15.3 wt%.
Dephosphorization
The dephosphorization of BOF with the introduction of ${\mathrm{{CO}}}_{2}$ has been widely studied (Lv et al., ; Zhu et al., 2012). The dephosphorization of hot metal with high-Si and high-P in the converter is a serious technical problem during the steelmaking process. Normally, in order to enhance the dephosphorization efficiency, solid coolant is added during dephosphorization with the aim to control the temperature increase rate. However, solid coolant will lead to a partial-cooling of the bath. Consequently, the cooling effect would be non-uniform. Additionally, the impurity in solid coolant will affect the quality of steel production. In this case, ${\mathrm{{CO}}}_{2}$ could be a better choice as a temperature controlling agent. A ${30}\mathrm{t}$ converter was adopted for carrying out the ${\mathrm{{CO}}}_{2}$ cooling experiments (Yi et al.,2009).
The industrial trials showed that, with the introduction of ${\mathrm{{CO}}}_{2}$ (namely COMI process), the temperature of the dephosphorization period has been controlled better compared to the conventional process and ${\mathrm{{CO}}}_{2}$ bottom blowing is found to be beneficial for dephosphorization. The temperature of semisteel is around 1330- ${1350}^{ \circ }\mathrm{C}$ , and the phosphorous content in semisteel is lower than ${0.050}\mathrm{{wt}}\%$ . The average dephosphorization efficiency for semisteel using conventional processes is 53.10%, while it is 66.49% with COMI process. The P content for the first tapping is also decreased by ${23}\%$ , from 0.030 to 0.023 wt%.
To summarize the effects of ${\mathrm{{CO}}}_{2}$ used in converter process, the introduction of ${\mathrm{{CO}}}_{2}$ in the proper amount will be favourable to decarburization, dust reduction, reduction of materials consumption and dephosphorization. However, the amount or ratio of ${\mathrm{{CO}}}_{2}$ mixing must be calculated carefully, as too much ${\mathrm{{CO}}}_{2}$ can lead to skull of slag because of the endothermic reaction between ${\mathrm{{CO}}}_{2}$ and $\mathrm{C}$ .
3.3.2 CO2 Used in AOD Process
The application of ${\mathrm{{CO}}}_{2}$ in stainless steel making is extremely interesting. Currently, stainless steel is mostly produced through the argon oxygen decarburization (AOD) process. For ordinary stainless steel production, the Ar consumption is ${11} - {12}{\mathrm{\;m}}^{3}/\mathrm{t},{\mathrm{O}}^{2}$ consumption is ${14} - {24}{\mathrm{\;m}}^{3}/\mathrm{t}$ , while, $\operatorname{Ar}$ consumption is ${18} - {23}{\mathrm{\;m}}^{3}/\mathrm{t}$ in the case of smelting extra-low carbon stainless steel (Chen et al., 2008). It has economical profit if Ar could be replaced by cheaper gases, like ${\mathrm{N}}_{2}$ , steam, ${\mathrm{{CO}}}_{2}$ , etc. However, ${\mathrm{N}}_{2}$ will bring $\mathrm{N}$ and steam and will take $\mathrm{H}$ into the melt, both of which are harmful for certain steel grades. The use of ${\mathrm{{CO}}}_{2}$ could be ideal considering this aspect. The present authors have investigated the feasibility of ${\mathrm{{CO}}}_{2}$ application in the stainless steel making process, both in Sweden and in China.
Wang et al. (2009, 2010) have carried out induction furnace experiments at the Royal Institute of Technology Sweden (KTH) during 2007-2010 and the results show that ${\mathrm{{CO}}}_{2}$ is effective for decarburization without the loss of chromium. After that, Zhu et al. (Li et al., 2015a) have carried out basic study of thermodynamics of ${\mathrm{{CO}}}_{2}$ applied for stainless steel smelting, and pointed out the maximum ${\mathrm{{CO}}}_{2}$ used in AOD process is ${9.13}\%$ . They stated that for carbon content over ${0.5}\mathrm{{wt}}\%$ , it is possible to use ${\mathrm{{CO}}}_{2} + {\mathrm{O}}_{2}$ mixture, while, at carbon level lower than ${0.5}\mathrm{{wt}}\%$ , it is better to use Ar to decrease partial pressure of $\mathrm{{CO}}\left( {\mathrm{P}}_{\mathrm{{CO}}}\right)$ . They also implemented experiments in China (Bi et al.,2012) and found when the ratio of ${\mathrm{{CO}}}_{2}$ increased from 0 to ${50}\%$ , the carbon content will decrease by ${12}\%$ while $\mathrm{{Cr}}$ content will increase by 19.93%. These authors have suggested the use of $5 - {11}{\mathrm{\;m}}^{3} \; {\mathrm{{CO}}}_{2}$ for one ton stainless steel production. The price of Ar is around 5-8 times that of ${\mathrm{{CO}}}_{2}$ . Consequently, the production cost will be decreased by 3-7 US$/t.
Anderson et al. (1990) have shown, from their corresponding trials at a steel plant in U.S. with production capacity of 1.0 million tonnes per year, that adopting a similar practice as proposed in Bi et al. (2012), 20 Million to 45 Million RMB could be saved per year. In 2011, Anshan Iron and Steel Co., Ltd. (Tang et al., 2011) invented an AOD process with injection of ${\mathrm{{CO}}}_{2}$ to produce stainless steel and they found it is suitable for smelting steel with carbon content from 0.001 to 0.3 wt% using the new process. They also found with ${\mathrm{{CO}}}_{2}$ injection, oxygen lance can be cooled and its life improved by ${20}\%$ .
3.3.3 CO2 Used in EAF Process
Electric arc furnace (EAF) steel takes up around ${10.1}\%$ of the steel production in China in 2012, which is far lower than the international average and it is related to the lack of scrap and energy in China. However, with the development of the country, the ratio of scrap is expected to increase and the EAF process would be comparable to developed countries. The use of ${\mathrm{{CO}}}_{2}$ in EAF would have a great impact in future steel production in China. ${\mathrm{{CO}}}_{2}$ was introduced as the bottom blowing gas instead of Ar in the EAF process, in order to enhance the stirring ability of the bath for promoting the slag-metal reaction, homogenize the bath temperature and composition, and increase the yield of valuable metal (Gulyaev & Filippov, 2001; He et al., 1992; Van Wijngaar den & Pieterse, 1994; Zhao, 1995). The materials and heat balances were calculated by Wang et al. (2012) for the introduction of ${\mathrm{{CO}}}_{2}$ in EAF process with hot metal charging.
These authors concluded that, with the ${\mathrm{{CO}}}_{2}$ addition in the oxidization gas, the hot metal ratio charged into EAF could be enhanced, resulting in energy savings. Recently, the industrial experiments for ${\mathrm{{CO}}}_{2}$ application in the EAF process were carried out in a 65t EAF with the product of 45# steel (Wang et al., 2014) compared to Ar bottom stirring. The results show that with ${\mathrm{{CO}}}_{2}$ bottom blowing, the stirring effect was reinforced and the FeO content in slag was lowered, which offers good desulphurization conditions. The desulphurization ratio could be increased by 7% compared to that with Ar bottom blowing. However, with ${\mathrm{{CO}}}_{2}$ bottom blowing, the end point carbon content will increase slightly, and a small amount of $\mathrm{{Cr}}$ will be oxidized because ${\mathrm{{CO}}}_{2}$ oxidizes $\mathrm{{Cr}}$ in the melt, while Ar has no effect on $\mathrm{{Cr}}$ oxidation.
To conclude, with ${\mathrm{{CO}}}_{2}$ bottom blowing in EAF instead of $\mathrm{{Ar}}$ , the production cost will be decreased because the expensive Ar is replaced and the quality of the steel will not be affected, even enhanced at times.
3.3.4 ${\mathrm{{CO}}}_{2}$ Used in Secondary Refining Process
The use of ${\mathrm{{CO}}}_{2}$ as protection gas in a ladle furnace (LF) during heating can be traced back to 1986, with the aim to form a ${\mathrm{{CO}}}_{2}$ gas layer. This could reduce the possibility of steel melt absorbing nitrogen as well as re-oxidation. American and French plants have applied this technology successfully to decease the N content in the liquid steel by 63-75% (Hara et al., 1986). The research work by Bruce et al. (1987a) suggested that the quality of molten steel is not affected by bottom blowing ${\mathrm{{CO}}}_{2}$ in LF operation.
Unfortunately, because of weak oxidation of ${\mathrm{{CO}}}_{2}$ , few researches are focused on applying ${\mathrm{{CO}}}_{2}$ as a bottom stirring gas in LF operation. Because of this background, the current group, Gu et al. (2014) and Dong et al. (2014) have studied the ${\mathrm{{CO}}}_{2}$ application in LF both experimentally and theoretically. The experiments were performed in a 70 ton LF with ${\mathrm{{CO}}}_{2}$ as bottom blowing gas for 45# grade steel production. The results showed that neither types nor compositions of inclusions have significantly changed in steel compared with bottom blowing Ar.
On the other hand, it is observed that the process decreases inclusion yield density and improves steel cleanness. But one should also take note of the fact that ${\mathrm{{CO}}}_{2}$ is a weak oxidizer, and its use may lead to the increase of oxygen content in the liquid steel. A slight increase of oxygen in steel has been observed by Gu et al. (2014) and Dong et al. (2014) when blowing $1/3$ and $2/3{\mathrm{{CO}}}_{2}$ compared with pure Ar blowing.
Further evidence is obtained by experiments conducted by Paules et al. (1987) and Bruce et al. (1987b), who demonstrated that, when the carbon content is less than ${0.20}\mathrm{{wt}}\%$ in the melt, the dissolved oxygen in liquid steel is higher with ${\mathrm{{CO}}}_{2}$ stirring than with Ar stirring, but for steel grades with higher carbon content, there is no difference of dissolved oxygen content by blowing these two gases.
3.4 CO2 Used in Continuous Casting Process
${\mathrm{{CO}}}_{2}$ was applied in casting as shield gas, replacing Ar for special steel rod production in America 1989 (Anderson et al., 1989). Almost at the same period, researchers from UK (Normanton & Wang 1990) also tested the utilization of ${\mathrm{{CO}}}_{2}$ on ladle slide gate as shield gas during 1986-1988. The conclusion from these experiences was that, with the protection of ${\mathrm{{CO}}}_{2}$ , the steel quality was similar to that when $\mathrm{{Ar}}$ is used. The utilization of ${\mathrm{{CO}}}_{2}$ in the casting process came into popularity rather late in China. Until 2015, Li et al. (2015b) have carried out the industrial experiments on ${\mathrm{{CO}}}_{2}$ applied as a protective gas during continuous casting process instead of $\mathrm{{Ar}}/{\mathrm{N}}_{2}$ .
When ${\mathrm{{CO}}}_{2}$ is used as stirring gas or shielding gas for production, the quality of steel is similar or even the same to that using Ar gas. The nitrogen content in the melt is slightly lower with ${\mathrm{{CO}}}_{2}$ blowing than with Ar blowing since 1 volume ${\mathrm{{CO}}}_{2}$ reacting with $\mathrm{C}$ will generate 2 volumes of $\mathrm{{CO}}$ and large amounts of gas benefit from removing nitrogen. The oxygen content, hydrogen content and the content of oxide inclusions in the liquid steel are comparable with that stirred by Ar.
3.5 CO2 Used in Ferroalloy Production
Converter refining for ferrochrome (FeCr) and ferro manganese (FeMn) production is the trend of medium and low carbon (MLC) product smelting in China. Because the submerged arc furnace used for high carbon ferroalloy production is getting larger in size and the tapping size is very large. The conventional way for medium and low carbon ferroalloy production is not suitable because of its limited size and very high energy consumption. But the current converter technology used for M-LCFeCr and M-LCFeMn production has defects of a short lifetime of linings and low yield of $\mathrm{{Cr}}/\mathrm{{Mn}}$ . In this case, current authors (Yu, 2015; Yu et al.,2015) introduced ${\mathrm{{CO}}}_{2}$ into the converter process for M-LCFeCr and M-LCFeMn production. Laboratory scale experiments show that it is feasible to use ${\mathrm{{CO}}}_{2}$ for producing these two alloys and it can enhance the yield of $\mathrm{{Cr}}/\mathrm{{Mn}}$ by using ${\mathrm{{CO}}}_{2} + {\mathrm{O}}_{2}$ mixtures, especially when the carbon content in product is higher than 3.0wt%. However, calculations indicate that it is not beneficial to produce ferrochrome with carbon content lower than 1.0wt% with the introduction of ${\mathrm{{CO}}}_{2}$ .
Additionally, the refining of silicon and ferrosilicon with the outfurnace method has also considered using ${\mathrm{{CO}}}_{2}$ as a medium; the results, however, are not very encouraging (Suzuki et al., 1992; Wu et al., 2009, 2014) and would require further study.
3.6 CO2 Used in Other Areas in Steel Process
${\mathrm{{CO}}}_{2}$ was also used as the protection media, as a substitute for hydrocarbon, for side-blown oxygen lance in a converter to successfully limit dissolved hydrogen in liquid steel (Liu, 1983). As an acidic gas, ${\mathrm{{CO}}}_{2}$ could also be used to fix active basic substances in slag to get stable carbonate. Dong (2008) have used ${\mathrm{{CO}}}_{2}$ to stabilize the converter slag and found that the best reaction temperature was ${700}{}^{ \circ }\mathrm{C}$ . Slag splashing in a converter is widely used in China and ${\mathrm{{CO}}}_{2}$ is being tested as a replacement for ${\mathrm{N}}_{2}$ by researchers at the Chinese Academy of Sciences (Yuan et al., 2007; Zhao et al., 2010). During these trials with slag splashing, coke fines or pulverized coal with additives were added into the converter. The basic idea was that ${\mathrm{{CO}}}_{2}$ would react with $\mathrm{C}$ to form $\mathrm{{CO}}$ . In this case, $\mathrm{{CO}} + {\mathrm{{CO}}}_{2}$ mixed gas will be recycled using this process. After separation, the ${\mathrm{{CO}}}_{2}$ could be utilized for slag splashing again, while CO could be reused in other places in plant.
3.7 CO2 Used in Microalgae Cultivation
${\mathrm{{CO}}}_{2}$ used in microalgae cultivation is another promising way of sequestering ${\mathrm{{CO}}}_{2}$ . On one hand, microalgae could fix carbon in a very efficient way with zero carbon emissions. On the other hand, it helps to realize the transformation of solar energy to biomass energy. Microalgae has broad applications. It can be used to produce biodiesel which has many advantages over traditional fuels. Advantages include better combustion and safety behavior, and higher environmental performance. Another microalgae application is in food industry. Microalgae is used to produce products with high industrial added value, like docosahexaenoic acid and eicosapentaenoic acid.
Biofuels and methanol, which are emerging class of carbon-neutral drop-in replacement fuels, offer strongly viable alternatives for providing carbon neutral fuels to large and very large vessels. At the moment, through biotechnology utilization creates a carbon neutral loop as the ${\mathrm{{CO}}}_{2}$ released from burning the biofuels and methanol are captured and offset from industrial activities in the production of biofuels and methanol. Energy need for the reaction is in the renewable form. Utilization biological carbon capture there will convert ${70},{000}\mathrm{t}$ per year of ${\mathrm{{CO}}}_{2}$ into 50,000 t per year of methanol (ADB, 2020).
The broad geographical distribution of microalgae and its extraordinary environmental tolerance make large-scale microalgae cultivation possible. China is the biggest microalgae breeding country worldwide and has great potential for microalgae development. Therefore, microalgae technology should be perceived as an important development direction of carbon fixation and should receive more attention. Currently, technical challenges include the low quality of microalgae, less efficiency of large-scale cultivation, and high energy cost.
3.8 Econic Catalyst Technology for Utilization of Carbon Dioxide as a Feedstock for the Polyurethane Industry
The proprietary catalyst technology of Econic allows for recycled carbon dioxide $\left( {\mathrm{{CO}}}_{2}\right)$ emissions to be used as a feedstock in polyol manufacture. In the frst market application, recycled ${\mathrm{{CO}}}_{2}$ is incorporated into a range of polyols-the building blocks of polyurethanes-substituting up to ${50}\%$ of the conventional fossil-based feedstocks, propylene oxide and/or ethylene oxide. Econic technology produces polyols with tunable amounts of incorporated ${\mathrm{{CO}}}_{2}$ , which have enhanced performances that are tailored for specifc applications. Beyond polyols,
Econic technology has been proven to deliver the same ${\mathrm{{CO}}}_{2}$ benefts in the surfactant, lubricant, and high molecular weight polymer sectors. Its frst target market is in the manufacture of polyols, the building blocks of polyurethane materials. Life-cycle assessment studies indicate that polyols produced with average ${\mathrm{{CO}}}_{2}$ contents $\left( {{25}\% - {35}\% }\right)$ will have reduced ${\mathrm{{CO}}}_{2}$ emissions footprints in the order of 25-40%. Across the global polyurethanes market, a 30% adoption of Econic catalyst technology could result in the consumption and prevention of 5 million tonnes per annum of ${\mathrm{{CO}}}_{2}$ emissions. Polyols created by the Econic system can be utilized in all aspects of the polyurethane market, from housing insulation to car interiors to running shoes and refrigerators. The Econic system incorporates ${\mathrm{{CO}}}_{2}$ into polyols using less energy than the existing industrial process, and-compared to competing technologies-is the only system that facilitates bespoke incorporation of ${\mathrm{{CO}}}_{2}$ into products, thereby optimizing production and end-product performance. Furthermore, it does so under the same equipment and processing conditions of existing production facilities, allowing fast, simple, and low-cost adoption by retrofit.
Beyond polyols, the same utilization of ${\mathrm{{CO}}}_{2}$ has been demonstrated in the surfactant, lubricant, and high molecular weight polymer sectors, dramatically increasing the scale of carbon beneft the Econic technology can deliver.
3.9 Carbon Utilization Recommendation
Significant research efforts have been made on ${\mathrm{{CO}}}_{2}$ used as stirring gas, reacting medium as well as protecting source in metallurgical processes. This covers almost all the fields of ferrous metallurgy. In most cases, positive results are obtained through observation. However, despite the positive impacts, the negative effects of ${\mathrm{{CO}}}_{2}$ also need to be considered. For example, when it is used in converter and EAF processes, it may prolong the tap-to-tap time hence increase the production cost somehow, and it is difficult to decide the proper introduction amount. While, when it is used in LF (ladle furnace) and CC (continuous casting) processes, it may lead to re-oxidation of the melt for clean steel production.
Till now, the experiments on application of ${\mathrm{{CO}}}_{2}$ in the metallurgical processes in China are limited to laboratory scale and pilot scale. The lack of enthusiasm in industrial implementation could be attributed to (1) method of ${\mathrm{{CO}}}_{2}$ preparation leads to the cost of ${\mathrm{{CO}}}_{2}$ currently is not low, and it is not economical to use ${\mathrm{{CO}}}_{2}$ ; (2) there is lack of sufficient research results with regard to the optimal amount of ${\mathrm{{CO}}}_{2}$ to be used. These problems need to be solved by researchers as soon as possible. Recently, the new methods for ${\mathrm{{CO}}}_{2}$ separation from the flue gas in steel industry reported by researchers from South Korea (Kim et al., 2015) provided an economic solution of ${\mathrm{{CO}}}_{2}$ preparation (62 USD/t ${\mathrm{{CO}}}_{2}$ separated), which will make ${\mathrm{{CO}}}_{2}$ cyclic utilization in the metallurgical processes closer to the industrial production.
4 Review of Appropriate CO2 Transport and Storage Options
4.1 Options for ${\mathrm{{CO}}}_{2}$ Transport
Generally, a CCS system has three separate elements: capture, transport and storage. As the intermediate process in the CCS chain, ${\mathrm{{CO}}}_{2}$ transport is needed to link ${\mathrm{{CO}}}_{2}$ sources and storage sites and thus plays a significant role in the successful deployment of CCS. Hence, it is important to have a thorough consideration of ${\mathrm{{CO}}}_{2}$ transportation approaches and corresponding cost. However, transport is considered as the least challenging element of CCS and has been less studied (Aspelund & Jordal, 2007).
In industry, ${\mathrm{{CO}}}_{2}$ is transported by pipelines, ships, railway tankers, and tanker trucks. Svensson et al. (2004) performed an economic analysis on these four alternatives and concluded that water carriers (offshore), pipelines (offshore and onshore) and a combination of these are appropriate transport options for CCS. Figure 2 shows the cost and capacity for transportation alternatives at a distance of ${250}\mathrm{\;{km}}$ . It clearly shows that pipeline and water carriers have a large capacity and low cost. Nevertheless, other options still have the potential to be applied to small-scale CCS projects. For example, Yanchang integrated a CCS demonstration project in China that adopts tanker trucks and pipelines as its ${\mathrm{{CO}}}_{2}$ transport method (GCCSI, 2017a). For large-scale CCS projects, due to the low capacity and high transportation fares, railway tankers and tanker trucks are not cost effective. Therefore, this portion of the review will focus on pipeline and shipment transport and gives a brief introduction of transport technology as well as cost analysis.
Fig. 2 Cost and capacity for transportation alternatives at ${250}\mathrm{\;{km}}$ (Svensson et al., 2004)
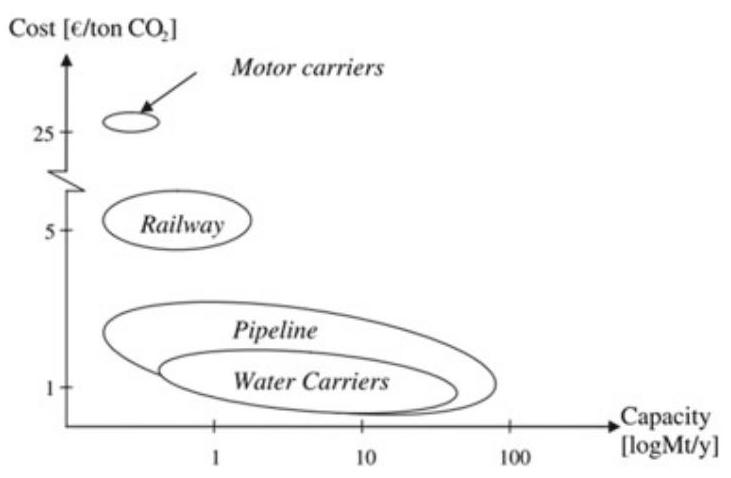
4.1.1 ${\mathrm{{CO}}}_{2}$ Pipeline Transport
The use of ${\mathrm{{CO}}}_{2}$ pipelines is well established to be the most economical way of transporting ${\mathrm{{CO}}}_{2}$ (Zhang et al.,2006). At present,14 of 16 global large-scale CCS projects use pipeline transport (Table 1). Carbon dioxide pipelines have extended over ${2500}\mathrm{\;{km}}$ in the western areas of United States, where they transport more than 50 million tonnes of ${\mathrm{{CO}}}_{2}$ per year from natural ${\mathrm{{CO}}}_{2}$ sources to enhanced oil recovery sites. By far, many problems associated with carbon dioxide pipelines are similar with those encountered by hydrocarbon pipelines in similar areas. Therefore, lots of learning and knowledge from the use of hydrocarbon pipelines, i.e. system design, construction, risk monitoring, can be borrowed to develop pipelines for ${\mathrm{{CO}}}_{2}$ transport.
Transport Technology and System Design
Broadly speaking, the ${\mathrm{{CO}}}_{2}$ pipeline transport chain includes gas conditioning, compression and pipeline transport (Fig. 3). Gas conditioning means the necessary processing of ${\mathrm{{CO}}}_{2}$ to achieve transport specification. Normally, it includes two steps: removing water and other liquids and then removing volatile gases. Liquids should be ensured not to enter ${\mathrm{{CO}}}_{2}$ compressors so that the formation of gas hydrates, the freezing of water and corrosion can be avoided. Transportation of volatile gases, like nitrogen, would increase the energy requirement and cost. Gas conditioning is often recognized as the interface between ${\mathrm{{CO}}}_{2}$ capture and transport.
The most economical way of transporting ${\mathrm{{CO}}}_{2}$ is as a dense phase (Van-deginste & Piessens, 2008). The dense phase pipeline was 20% cheaper than a low-pressure ${\mathrm{{CO}}}_{2}$ gas pipeline. Generally, the pressure should be kept above 9.6 MPa to remain in a dense phase state no matter the temperature change. In addition, high pressure ${\mathrm{{CO}}}_{2}$ is advantageous in the injection process. Compressors not only offer the pressure at the starting point, but also operate at some points along the pipeline, at areas called booster stations, to overcome the pressure loss caused by friction. These stations are not necessarily equally spaced. When pipeline length is short, they may lack compressor stations.
Table 1 Transportation of global large-scale CCS project in operation. Adapted from GCCSI (2017b)
| Project name | Capacity (Mtpa) | Operation date | Transport type | Length (km) |
| Val Verde Natural Gas Plants | 1.3 | 1972 | Pipeline | 316 |
| Enid Fertilizer ${\mathrm{{CO}}}_{2}$ -EOR Project | 0.7 | 1982 | Pipeline | 225 |
| Shute Creek Gas Processing Facility | 7.0 | 1986 | Pipeline | Multiple, maximum of 460 km |
| Sleipner ${\mathrm{{CO}}}_{2}$ Storage Project | 0.85 | 1996 | N/A | Not applicable |
| Great Plains Synfuel Plant and Weyburn-Midale Project | 3.0 | 2000 | Pipeline | 329 |
| Snohvit CO2 Storage Project | 0.7 | 2008 | Pipeline | 153 |
| Century Plant | 8.4 | 2010 | Pipeline | 64 to 240 |
| Air Products Steam Methane Reformer EOR Project | 1.0 | 2013 | Pipeline | 158 |
| Coffeyville Gasification Plant | 1.0 | 2013 | Pipeline | 112 |
| Lost Cabin Gas Plant | 0.9 | 2013 | Pipeline | 374 |
| Petrobras Santos Basin Pre-Salt Oil Field CCS Project | Approx. 1.0 | 2013 | N/A | Not applicable |
| Boundary Dam Carbon Capture and Storage Project | 1.0 | 2014 | Pipeline | 66 |
| Uthmaniyah ${\mathrm{{CO}}}_{2}$ -EOR Demonstration Project | 0.8 | 2015 | Pipeline | 85 |
| Quest | Approx. 1.0 | 2015 | Pipeline | 64 |
| Abu Dhabi CCS Project (Phase 1 being Emirates Steel Industries (ESI) CCS Project) | 0.8 | 2016 | Pipeline | 43 |
| Petra Nova Carbon Capture Project 1. | 1.4 | 2017 | Pipeline | 132 |
N/A means no transport required (direct injection)
The diameter of the pipeline is the crucial parameter in pipeline design. Based on the mechanical energy balance, a model was developed to calculate the pipeline diameter required for a given pressure drop (Mohitpour et al., 2003). The diameter is also influenced by mass flow rate, fanning friction factor and pipeline length. The solving process is iterative, so an initial guess is needed.
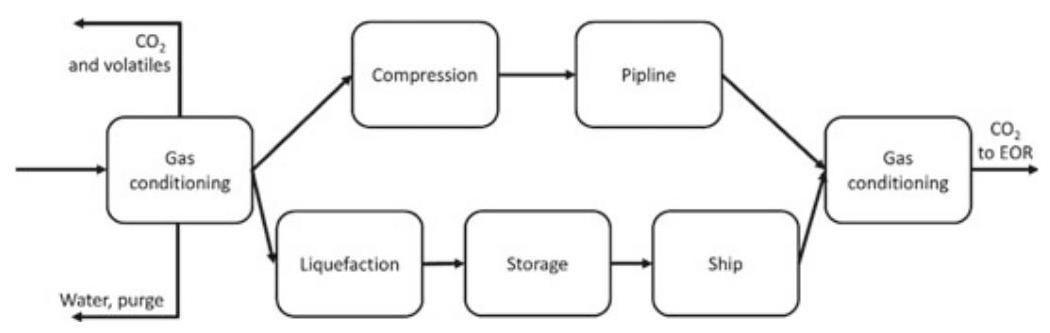
Fig. 3 The ${\mathrm{{CO}}}_{2}$ transport chain (Modified from Aspelund &Jordal,2007)
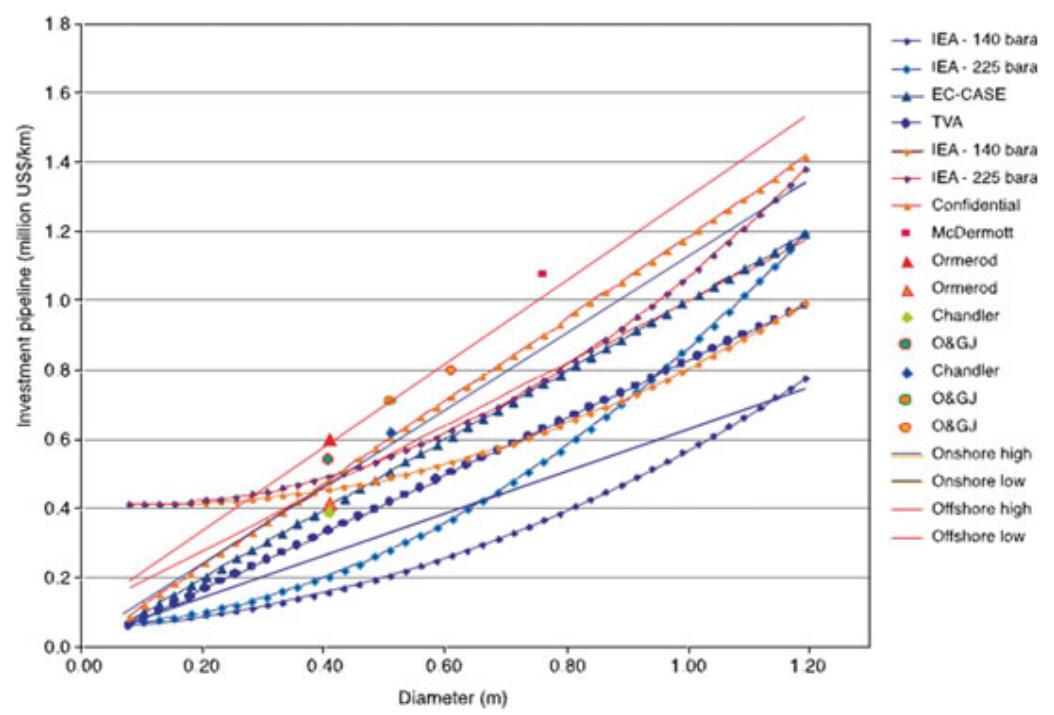
Fig. 4 Construction costs for pipelines from various information sources. Costs exclude booster stations (Metz, 2005)
A monitoring system is essential as high concentrations of ${\mathrm{{CO}}}_{2}$ can be fatal for humans and animals. Pipelines can be monitored internally by pigs, which are pressure-driven devices with piston shapes moved along the pipeline, and can be monitored externally by leak detection systems.
Economic Analysis of Pipeline Transport
The cost of ${\mathrm{{CO}}}_{2}$ transport includes three parts. Construction costs, also called capital costs, measure the initial investment costs. It contains material/equipment costs, and labor costs. Figure 4 shows construction costs for pipelines in different contexts. This data clearly shows the relationship between diameter and the capital cost. It is also obvious that booster stations increase the capital cost. Operation and maintenance costs include monitoring costs, maintenance costs and energy costs. Other costs are miscellaneous, including design, project management and right-of-way costs, etc. Levelized cost takes all the costs in the whole lifetime of a project into account (Fig. 5), and it represents the cost of per tonne ${\mathrm{{CO}}}_{2}$ transported by pipeline (McCollum & Ogden, 2006).
Based on natural gas pipelines experience, Mccoy and Rubin (2008) developed a model for prediction of the pipeline capital expense in United States. For an illustrative example (transport of five million tonnes of ${\mathrm{{CO}}}_{2}$ with distance larger than ${100}\mathrm{\;{km}}$ ), capital cost was US$1.16 per tonne of ${\mathrm{{CO}}}_{2}$ . Liu and Gallagher (2011) developed a model which considers both engineering and economic factors with the background of China. For five illustrative case studies with a pipeline length of ${100}\mathrm{\;{km}}$ , the levelized costs are US$1.84-3.06 per tonne of ${\mathrm{{CO}}}_{2}$ .
4.1.2 ${\mathrm{{CO}}}_{2}$ Transport by Ship
${\mathrm{{CO}}}_{2}$ transport by ship is more flexible compared to pipeline transport, and it is more competitive for ocean ${\mathrm{{CO}}}_{2}$ storage or marine oilfield EOR. ${\mathrm{{CO}}}_{2}$ transport by ship is very similar to liquefied petroleum gas (LPG) transport by ship. However, the number of ${\mathrm{{CO}}}_{2}$ marine tankers is rather limited because of the low demand. Currently, there are no existing experienced ${\mathrm{{CO}}}_{2}$ transport ships for CCS. Only four small-scale semi-pressurized ${\mathrm{{CO}}}_{2}$ ships operate in western Europe, the ${\mathrm{{CO}}}_{2}$ of which is used for the food industry. Korean-CCS 1 and 2 may become the first two projects using shipment transport for ${\mathrm{{CO}}}_{2}$ , as the storage site is offshore Korea. Now they are under evaluation and the operation date is in the 2020s.
Transport Technology and System Design
${\mathrm{{CO}}}_{2}$ transport process by ship is quite different compared to the process by pipeline. The ship transport chain of ${\mathrm{{CO}}}_{2}$ includes liquefaction and gas conditioning, an intermediate storage, a loading system, shipping and a loading system. At the onset of the transport process, ${\mathrm{{CO}}}_{2}$ is liquefied around its triple point. The density of ${\mathrm{{CO}}}_{2}$ is as high as ${1200}\mathrm{\;{kg}}/{\mathrm{m}}^{3}$ at its triple point and reduces to half at its critical point. Higher density means more ${\mathrm{{CO}}}_{2}$ can be transported for the same size ship. In addition, since ${\mathrm{{CO}}}_{2}$ is captured continuously but transported separately, the system must include an intermediate storage part. The ${\mathrm{{CO}}}_{2}$ is contained in semi-pressurized tanks before being loaded on board.
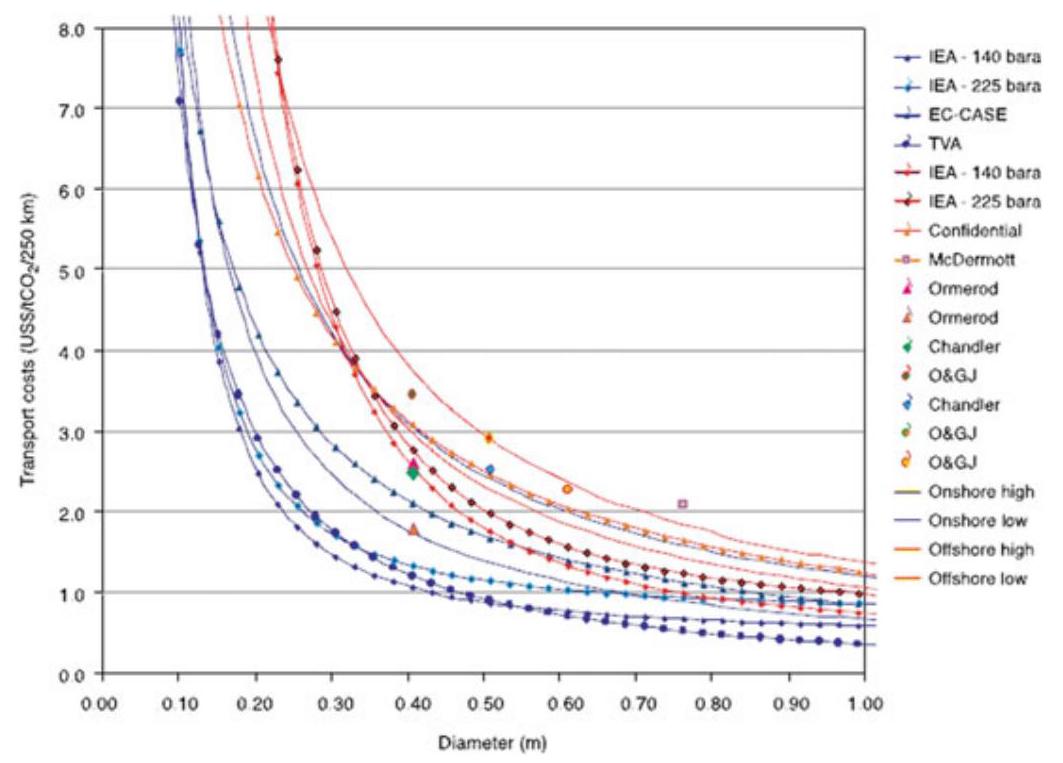
Fig. 5 Levelized cost of pipeline transport from various information sources (Metz, 2005)
There are three types of ships for transporting ${\mathrm{{CO}}}_{2}$ : fully pressurized ship, semi-pressurized ship and fully refrigerated ship. Semi-pressurized ships are recommended by ship designers and the best transport condition is at ${0.65}\mathrm{{MPa}}$ and $- {52}^{ \circ }\mathrm{C}$ (Bock et al.,2003). LPG ships can be rebuilt for ${\mathrm{{CO}}}_{2}$ transport. However, some difficulties may arise because the ${\mathrm{{CO}}}_{2}$ is transported at a little higher pressure and lower temperatures. It is noteworthy that ${\mathrm{{CO}}}_{2}$ leakage during ship transport is inevitable. The total loss is estimated between 3 and 4% per 1000 km (Metz, 2005).
Fig. 6 Comparison of costs of onshore and offshore pipelines, and ship transport (Metz, 2005)
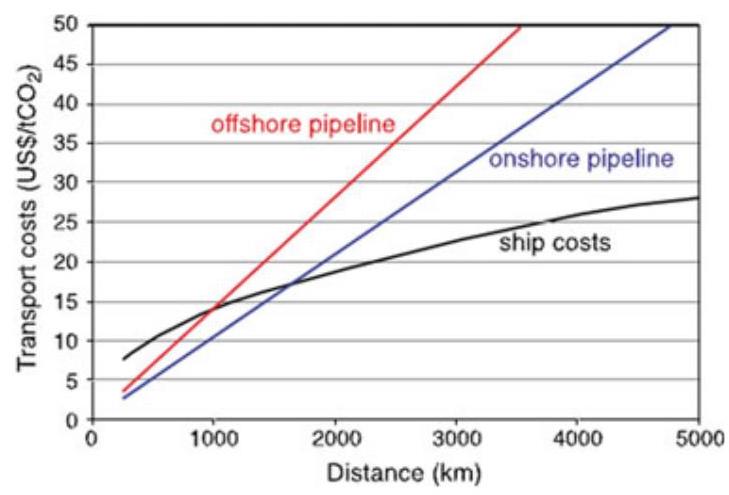
Economic Analysis of ${\mathrm{{CO}}}_{2}$ Transport by Ship
Costs of shipment system are composed of capital costs, operational and maintenance costs and miscellaneous costs. However, less is known on the costs of a ${\mathrm{{CO}}}_{2}$ shipment system since no large-scale CCS projects adopt this means of transportation by far. Therefore, the cost estimates from different literature vary widely.
Aspelund et al. (2006) performed a cost, energy and ${\mathrm{{CO}}}_{2}$ emission analysis on transport chain within the North Sea. The total cost is US$20-30 per tonne of ${\mathrm{{CO}}}_{2}$ for volumes larger than $2\mathrm{{Mt}}$ per year. The energy requirement is ${142}\mathrm{{KWh}}$ per tonne of ${\mathrm{{CO}}}_{2}$ , and the liquefaction process accounts for the major energy consumption with a proportion of ${77}\%$ . Total ${\mathrm{{CO}}}_{2}$ emissions are estimated to be 1.4% of the inlet ${\mathrm{{CO}}}_{2}$ . By comparison, a case study in China gives the levelized cost of shipment transport as US$7.09 per tonne of ${\mathrm{{CO}}}_{2}$ with a ship transport distance of ${300}\mathrm{\;{km}}$ and pipeline length of ${25}\mathrm{\;{km}}$ (Gao et al.,2011). The ship capacity and travel distance are sensitive factors and will have large impact on cost. The relationship between travel distance and the levelized cost is non-linear. Therefore, ${\mathrm{{CO}}}_{2}$ transport by ship is a more economical solution when the distance is greater than ${1000}\mathrm{\;{km}}$ (Aspelund et al.,2006). Figure 6 clearly shows as distance increases, ship will be the cheapest way to transport ${\mathrm{{CO}}}_{2}$ .
4.1.3 Proximity Study
Broadly speaking, any place that releases ${\mathrm{{CO}}}_{2}$ into the atmosphere is a ${\mathrm{{CO}}}_{2}$ source. In contrast, any place that sequestrates ${\mathrm{{CO}}}_{2}$ from the atmosphere is a ${\mathrm{{CO}}}_{2}$ sink. However, in this context sources and sinks refer to those related to CCS project. Therefore, ${\mathrm{{CO}}}_{2}$ sources include power plants, steel mills, cement factories, etc. ${\mathrm{{CO}}}_{2}$ sinks include oil reservoirs, deep saline aquifers, coal beds and the ocean.
Proximity study is indispensable in CCS system. It is necessary to spot the geo-location of ${\mathrm{{CO}}}_{2}$ sources and sinks and specify their capacity so as to evaluate the CCS potential in an area. In addition, the geological information can be used to calculate the transportation cost. The availability of ${\mathrm{{CO}}}_{2}$ sources data is relatively easy, but things are not easy for sinks. The sinks are always underground which means geological exploration method should be used. In this case, the accuracy is compromised. In most cases, ${\mathrm{{CO}}}_{2}$ sources and sinks do not coincide. So proximity study is needed to deploy CCS transport lines wisely to optimize the NPV.
Proximity study of China is at an early stage, though several studies have estimated CCS potential of China. Bai et al. (2006) performed a research on ${\mathrm{{CO}}}_{2}$ point sources in industry and studied how they distribute across China. Liu et al. (2005) made estimation on ${\mathrm{{CO}}}_{2}$ storage capacity of coalbeds in China. Li et al. (2006) studied domestic deep saline aquifers and ranked their potential for CCS application. At present, proximity study of China is at national scale which is not meaningful considering a specific CCS project. Also the lack of integrated study of sources and sinks undermines the integrity of CCS system. Therefore, proximity should be performed at regional scale and be more holistic in future.
4.1.4 ${\mathrm{{CO}}}_{2}$ Transport Recommendation
${\mathrm{{CO}}}_{2}$ transport approaches should be determined based on proximity study and the quantity of ${\mathrm{{CO}}}_{2}$ to be sequestrated. For the existing alternatives, pipeline transport is the most economical and stable method for terrestrial storage. However, for some special cases, i.e. ${\mathrm{{CO}}}_{2}$ capture from marine natural gas production, ship transport can be an alternative option. In summary, pipeline transport is our recommendation for ${\mathrm{{CO}}}_{2}$ transport. We should focus on building of pipeline networks.
4.2 Trapping Mechanisms of Geological Storage of ${\mathrm{{CO}}}_{2}$
Trapping mechanisms of ${\mathrm{{CO}}}_{2}$ can be classified into five types: structural, capillary, solubility, mineral and hydrodynamic trapping (Fig. 7). Contribution of different mechanisms is dynamic and the dominant mechanism is changing at different phases as ${\mathrm{{CO}}}_{2}$ migrates and reacts with rocks and fluids (Benson & Cole,2008). With the extension of time, the storage security of ${\mathrm{{CO}}}_{2}$ sequestration increases. The trapping mechanism determines the contribution of each trapping approach. At the beginning, structural trapping and hydrodynamic trapping play an important role. After hundreds of years, the effect of capillary, solubility and mineral trapping increases in importance. All the mechanisms will be introduced in detail in following sections.
Fig. 7 Trapping mechanisms evolution with time (Modified from Metz et al., 2005)
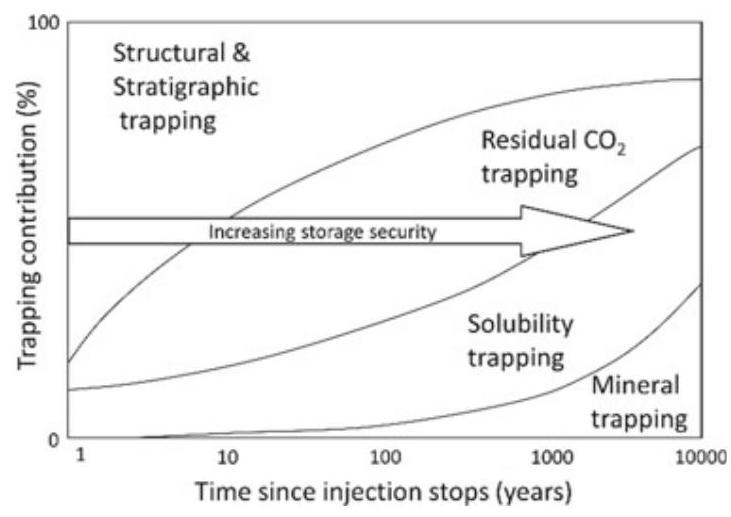
For scientific research on caprock-sealing mechanisms of ${\mathrm{{CO}}}_{2}$ sequestration, Song and Zhang (2013) presented a comprehensive overview of the ${\mathrm{{CO}}}_{2}$ caprock-sealing mechanisms, where the problems related to ${\mathrm{{CO}}}_{2}$ leakage are defined, and major research gaps and additional study areas are identified.
4.2.1 Structural Trapping
Structural trapping is of great significance in early stages of ${\mathrm{{CO}}}_{2}$ injection. A thick and fine-textured rock, such as shale, can serve as a caprock above the sequestration reservoir and prevent ${\mathrm{{CO}}}_{2}$ from migrating freely. Though the buoyance of ${\mathrm{{CO}}}_{2}$ is large, the block effect of the impermeable layer impedes the vertical migration of ${\mathrm{{CO}}}_{2}$ . Furthermore, the caprock could prevent ${\mathrm{{CO}}}_{2}$ from migrating upwards due to its low permeability and high capillary entry pressure (Benson & Cole, 2008). The geological structure apt to such trap includes anticline, fault block, and pinch. In most cases, the structure originally contains oil and gas, or groundwater.
4.2.2 Capillary Trapping
After injection when ${\mathrm{{CO}}}_{2}$ migrates into the formation, ${\mathrm{{CO}}}_{2}$ can be immobilized in pores within rocks because of the gas-liquid interface tension (IFT), which is called residual trapping. When large quantities of ${\mathrm{{CO}}}_{2}$ pass across porous media, ${\mathrm{{CO}}}_{2}$ is usually trapped in the pore as spherical drops. Therefore, the more the amount of ${\mathrm{{CO}}}_{2}$ passing the porous media, the more the ${\mathrm{{CO}}}_{2}$ is trapped in the rock pore. Normally, this process can last for several decades from the time ${\mathrm{{CO}}}_{2}$ once being injected into the formation.
4.2.3 Solubility Trapping
Another trapping mechanism, solubility trapping, starts to function when ${\mathrm{{CO}}}_{2}$ migrates in the pore of rocks. ${\mathrm{{CO}}}_{2}$ will contact with water and crude oil in which ${\mathrm{{CO}}}_{2}$ can dissolve. The solubility of ${\mathrm{{CO}}}_{2}$ is influenced by several elements, including temperature, pressure and fluid salinity. Other influencing elements that could affect the solubility of ${\mathrm{{CO}}}_{2}$ include the chemical components of formation fluids, and the contact rate between ${\mathrm{{CO}}}_{2}$ and formation fluids. Because of the gravity, ${\mathrm{{CO}}}_{2}$ -saturated formation fluids will move towards the center of the basin over time. Therefore, solubility trapping has more storage potential compared with structural trapping. The time-scale of solubility trapping is from 100 to 1000 years.
4.2.4 Mineral Trapping
Mineral trapping mechanism happens once ${\mathrm{{CO}}}_{2}$ , either in dissolved state or supercritical state, reacts in a direct or indirect way with formation rocks, which in most cases promotes carbonate mineral precipitation (Oelkers et al., 2008). Although mineral trapping is considered as the most reliable for the reason that it can last for very long periods, the reaction happens very slowly. The overall efficiency is usually achieved in a timescale of hundreds of years, or maybe longer. The main factors which can influence the speed of mineral trapping include chemical reaction process, fluid type and mineral composition. For example, the chemical reaction rate is high when the formation is carbonate. In contrast, the chemical reaction rate is low or even no reaction happens when the formation is sandstone.
Besides geologic formation, concrete may be another choice when considering mineral trapping. A novel technology from CarbonCure injects ${\mathrm{{CO}}}_{2}$ into fresh concrete during production (ADB,2020). The injected ${\mathrm{{CO}}}_{2}$ has been proved to strengthen concrete mechanical properties, which can reduce cement requirement and optimize the mix designs. Most importantly, ${\mathrm{{CO}}}_{2}$ can be permanently trapped in concrete due to mineralization. This technology provides a new approach to storing and reusing waste ${\mathrm{{CO}}}_{2}$ .
4.2.5 Hydrodynamic Trapping
The groundwater flow pressure will impede and accumulate ${\mathrm{{CO}}}_{2}$ when its direction is opposite to that of ${\mathrm{{CO}}}_{2}$ buoyancy and of approximately equal force. This mechanism works when the ${\mathrm{{CO}}}_{2}$ is injected into the deep saline aquifers within a closed formation. Like the structural trapping, hydrodynamic trapping works immediately after the injection. The difference is that the lateral movement of ${\mathrm{{CO}}}_{2}$ is not blocked in hydrodynamic trapping. The groundwater migration velocity is measured in centimeters per year, whereas the ${\mathrm{{CO}}}_{2}$ migration distance is measured in kilometers. So it will take thousands of years for the injected ${\mathrm{{CO}}}_{2}$ to migrate to the shallower geologic sections. Other trapping mechanisms will likely also contribute and, consequently, no free ${\mathrm{{CO}}}_{2}$ will reach the surface. Thus the integrity of the ${\mathrm{{CO}}}_{2}$ storage is guaranteed.
4.3 Options for ${\mathrm{{CO}}}_{2}$ Storage
Generally speaking, optimal ${\mathrm{{CO}}}_{2}$ storage sites need to be located at the edge or inside a stable plate, such as a craton basin. The size and effectiveness of the basin storage space directly determine the amount of ${\mathrm{{CO}}}_{2}$ stored, and finally, the pressure and fluid system of the formation water in the basin are also crucial. important. According to the current research level, three basin geological bodies are appropriate to ${\mathrm{{CO}}}_{2}$ underground burial: depleted oil and gas reservoirs, saline aquifers, and coal seams (Fig. 8). Each structure type has a certain storage capacity, but due to different storage media, its storage conditions also have certain differences. Different options for ${\mathrm{{CO}}}_{2}$ storage have their advantages and disadvantage as discussed below.
4.3.1 Depleted Oil and Gas Reservoirs
Oil and gas reservoirs, especially depleted oil and gas reservoirs, are preferred for underground geological storage of ${\mathrm{{CO}}}_{2}$ due to following advantages: (1) Good trapping conditions (structural and stratigraphic), gas can be sealed for a long time with a small risk of leakage; (2) High degree of exploration, including the geological structure and physical properties; (3) Well-developed computer simulation technology and models for the prediction of trapping and displacement of hydrocarbons; (4) More than 80% of oil and gas reservoirs lie in deep formations. Pressure and temperature conditions are relatively easier to store ${\mathrm{{CO}}}_{2}$ in the supercritical state; (5) Complete infrastructure and wells constructions.
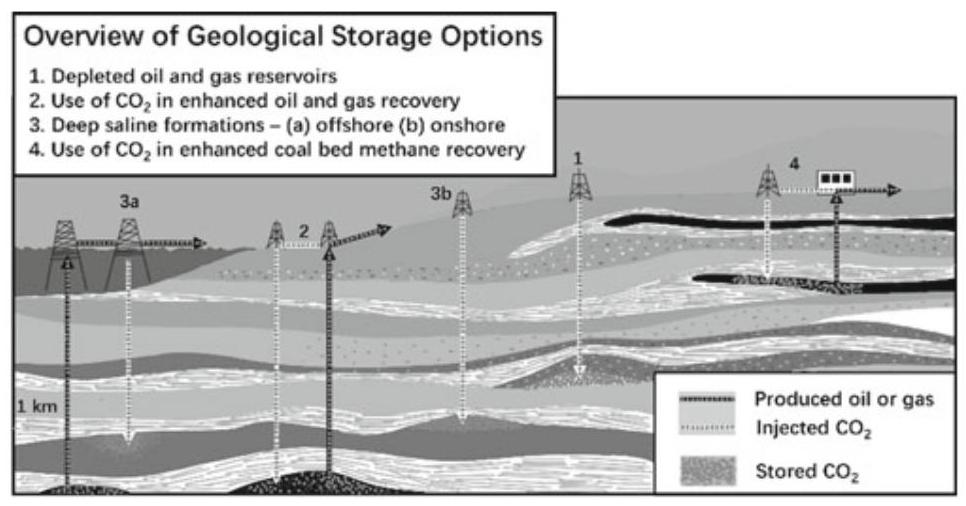
Fig. 8 Different kinds of appropriate ${\mathrm{{CO}}}_{2}$ storage sites (Modified from Benson &Cole, 2008)
These conditions are the main- criteria for measuring whether a depleted oil field is capable of underground ${\mathrm{{CO}}}_{2}$ storage. However, care should be taken to avoid exceeding the pressure that the caprock can withstand, and the reservoir is not easily affected by permeability reduction induced by plugging near injection well and fluctuations in reservoir stress, which will cause the reservoir capacity to face certain limitations (Bossie-Codreanu et al., 2003; Kovscek, 2002). In addition, ${\mathrm{{CO}}}_{2}$ injection can also increase oil recovery rate, enhance oil and gas production and protect environment.
4.3.2 Saline Aquifers
The underground saline aquifer suitable for geological storage of ${\mathrm{{CO}}}_{2}$ generally refers to a rock formation with high porosity and permeability that is filled with formation waters or brines, and the salt concentration of which is pretty high at a certain depth (at least 800 m) (Gunter et al., 1993). These filled salt waters (with a mass concentration of $\mathrm{{NaCl}}$ of ${32} \times {10}^{-3}\mathrm{{mg}}/\mathrm{L}$ ) are unsuitable for industrial or agricultural use. These saline aquifers can be found in most sedimentary basins in the world. Around 2 percent of the available space can be used to storage ${\mathrm{{CO}}}_{2}$ (Metz et al.,2005). The reservoir property directly affects the effectiveness, safety, and durability of storage.
The stratum depth of the top interface of the saline aquifer must be at least ${800}\mathrm{\;m}$ or more to guarantee the supercritical state of ${\mathrm{{CO}}}_{2}$ . If the top and bottom of the saline aquifer are blocked or enclosed by shale or gypsum-salt layers, the formation water will have a high salinity due to slow flow, which will be very conducive to the storage of ${\mathrm{{CO}}}_{2}$ , which can stay for millions of years.
Because of the density difference between ${\mathrm{{CO}}}_{2}$ and formation water, the ${\mathrm{{CO}}}_{2}$ injected into the saltwater layer will move upward under the action of buoyancy. This movement appears irregular due to being blocked by low permeability rock formations or lenses. If it encounters a suitable stratigraphic or structural trap, it will be stored; while if there are no such blocking or enclosure conditions, ${\mathrm{{CO}}}_{2}$ may continue to move upwards and cannot be buried in deep saline aquifers. In addition, in general sandstone or carbonate rock, pores or cracks are relatively developed, and most of them are easily filled by water to form saline aquifers. On the contrary, crystalline and metamorphic rocks, like granite, are not applicable to the formation of saline aquifers and therefore to ${\mathrm{{CO}}}_{2}$ storage.
The ${\mathrm{{CO}}}_{2}$ injected into the stable saltwater layer is mainly dissolved in the early stage of the chemical reaction. Under normal circumstances, the solubility of ${\mathrm{{CO}}}_{2}$ in saline aquifers will increase with pressure, temperature, and salinity, and it is also related to the contact with formation water. Experiments show that under certain salinity and depth conditions, assuming that the saline aquifer is more homogeneous and given sufficient dissolution time, $1{\mathrm{\;m}}^{3}$ of formation water can dissolve about ${20} - {60}\mathrm{\;{kg}}$ of ${\mathrm{{CO}}}_{2}$ ; if the injection continues for 25 years, then 10-25% of ${\mathrm{{CO}}}_{2}$ will be dissolved by formation water (Gale,2003).
4.3.3 Coal Seams
In coal beds, the storage of ${\mathrm{{CO}}}_{2}$ is mainly realized by the ${\mathrm{{CO}}}_{2}$ adsorption process. Injected plume of ${\mathrm{{CO}}}_{2}$ is mainly within the cleat between the coal blocks and inside the coal block (Rice et al., 1993). There are many tiny pores developed in the coal block sandwiched between the endogenous fissures, which can fully and firmly absorb the gas molecules from the fissures, thus the endogenous fissures between the coal blocks are important in the coal seam. The pore system is very important in the process of gas transport between different seams. Therefore, this transport effect directly affects ${\mathrm{{CO}}}_{2}$ injection and storage prospects. At present, the majority of coal seams worldwide suffer from low permeability, the average of which is only $1 - 5 \times {10}^{-3}\mu {\mathrm{m}}^{2}$ . In addition, the formation thickness is relatively thin, the average is only $1 - 5\mathrm{\;m}$ or part of $> 5\mathrm{\;m}$ (Larsen,2004). This unfavorable condition directly restricts the storage capacity of ${\mathrm{{CO}}}_{2}$ in coal seams and specific storage projects implementation.
4.3.4 Deep-Sea Sediments
Although the above-mentioned storage method has good application prospects, there is still a risk of leakage because of the pressure rise induced by ${\mathrm{{CO}}}_{2}$ . Scientists from many countries have begun to pay attention to deep-sea sediments.
The latest research (Teng & Zhang, 2018) studied the long-term evolution process of carbon dioxide injected into the seabed sediments, carried out numerical studies in a computer, and evaluated the effect of storage. Studies have found that in a high-pressure and low-temperature environment, the high density of liquid carbon dioxide will cause “negative buoyancy” in a sinking state. Coupled with the reaction of carbon dioxide with water to form carbon dioxide hydrate and block the flow channel, it can affect the carbon dioxide in the formation. The floating situation plays a very good role in hindering, so as to realize the safe, stable, and permanent storage of ${\mathrm{{CO}}}_{2}$ . On the other hand, the ${\mathrm{{CO}}}_{2}$ stored by this method will not come into contact with seawater, which avoids the negative impact on the marine ecological environment that may be caused by conventional deep-sea ${\mathrm{{CO}}}_{2}$ storage.
This research provides a novel solution for geological storage of ${\mathrm{{CO}}}_{2}$ in addition to land, expanding the storage sites to a wide range of marine sediments, and has important significance and application prospects for the future global carbon dioxide emissions reduction and storage options.
Since the operating facilities required for deep-sea geological storage are similar to the semi-submersible offshore platforms designed for combustible ice mining in the sea, and the injection of carbon dioxide is conducive to the mining of combustible ice, the two can be carried out simultaneously. The next step of research may try to actively seek opportunities to combine with field experiments on the combustible ice mining.
4.3.5 CO2 Storage Recommendation
In light of the large quantities of coalbeds and oilfields in China, ECBM and EOR are recommended. On the one hand, the ${\mathrm{{CO}}}_{2}$ storage potential is large. On the other hand, the increase in coal gas and oil production could be profitable. It is also necessary to improve the techniques for ${\mathrm{{CO}}}_{2}$ storage to lower the cost and leakage risk. For example, a new monitoring system is needed. Finally, we should attract more and more enterprises to participate in the CCS projects. It is very beneficial to expand the scale of CCS and increase the public awareness.
4.4 Case Studies
4.4.1 CCS Projects in the World
As the world’s first commercial ${\mathrm{{CO}}}_{2}$ storage project, Sleipner operated at 1996 and millions of tonnes of ${\mathrm{{CO}}}_{2}$ were injected underground in the middle of the Central North Sea ever since. Covering an area of about ${26},{000}{\mathrm{\;{km}}}^{2}$ , the shallow sands in Utsira Formation act as an ideal site for ${\mathrm{{CO}}}_{2}$ storage. The thickness of the formation is between 200 to ${300}\mathrm{\;m}$ and porosity is up to ${40}\%$ and permeability is above 1 Darcy. High porosity and large permeability enable Utsira Formation to storage large quantities of ${\mathrm{{CO}}}_{2}$ . The estimated storing capability of Utsira Formation is up to 600 billion tonnes.
From Table 2, we can see that most of world’s massive CCS projects utilize ${\mathrm{{CO}}}_{2}$ to increase oil production rate. The other three projects inject ${\mathrm{{CO}}}_{2}$ into deep saline aquifers for storage.
4.4.2 CCS Projects in China
Many Chinese energy-related companies have made efforts on CCS development and a series of CCS projects and many demonstration CCS projects have been implemented. In 2011, Shenhua Group picked Ordos Basin to demonstrate their CCS project and began to sequestrate ${\mathrm{{CO}}}_{2}$ in saline aquifers. Two largest oil companies in China, CNPC and Sinopec, have launched numerous ${\mathrm{{CO}}}_{2}$ -EOR operations in many plays, and many academic achievements are made (Wu et al., 2014). Huaneng Group has also attempted to build devices to collect ${\mathrm{{CO}}}_{2}$ from flue gas in large Chinese cities. China United Coalbed Methane Co., Ltd. has been carrying out ${\mathrm{{CO}}}_{2}$ -ECBM projects in two wells. The CCS project in Yanchang, Shanxi Province has also come into the implementation stage. Every year, around half a million tonnes of ${\mathrm{{CO}}}_{2}$ is collected from local chemical plants, and the ${\mathrm{{CO}}}_{2}$ was then transported to the storage site.
4.4.3 The Next Wave of Projects
The Paris Agreement sets a plan of keeping global temperature increase below $2{}^{ \circ }\mathrm{C}$ by 2050, and CCS plays a key role for achieving this target. However, the overall trend of CCS is not promising. Around two thirds of CCS projects are unable to reach a financial investment decision. By 2016 the large-scale CCS projects had shrunk to 38 from 77 large-scale CCS projects in 2010. It is clear to see that the pace of global CCS project development is stagnated and even goes backwards. (IEA, 2016) concludes that CCS is off track for Paris Agreement goals and picking up the pace of CCS deployment is urgent. Accelerating the pace of CCS deployment needs more policy support, economic investment, advanced technology, and global cooperation.
Table 2 Primary capture and storage type of global large-scale CCS project in operation. Adapted from GCCSI (2017b)
| Project name | Country | Operation date | Industry | Capture type | Primary storage type |
| Val Verde Natural Gas Plants | United States | 1972 | Natural gas processing | Pre-combustion capture | Enhanced oil recovery |
| Enid Fertilizer ${\mathrm{{CO}}}_{2}$ -EOR Project | United States | 1982 | Fertiliser production | Industrial separation | Enhanced oil recovery |
| Shute Creek Gas Processing Facility | United States | 1986 | Natural gas processing | Pre-combustion capture | Enhanced oil recovery |
| Sleipner ${\mathrm{{CO}}}_{2}$ Storage Project | NORWAY | 1996 | Natural gas processing | Pre-combustion capture | offshore deep saline formations |
| Great Plains Synfuel Plant and Weyburn-Midale Project | CANADA | 2000 | Synthetic natural gas | Pre-combustion capture | Enhanced oil recovery |
| Snohvit CO2 Storage Project | NORWAY | 2008 | Natural gas processing | Pre-combustion capture | offshore deep saline formations |
| Century Plant | United States | 2010 | Natural gas processing | Pre-combustion capture | Enhanced oil recovery |
| Air Products Steam Methane Reformer EOR Project | United States | 2013 | Hydrogen production | Industrial separation | Enhanced oil recovery |
| Coffeyville Gasification Plant | United States | 2013 | Fertiliser production | Industrial separation | Enhanced oil recovery |
| Lost Cabin Gas Plant | United States | 2013 | Natural gas processing | Pre-combustion capture | Enhanced oil recovery |
(continued)
Table 2 (continued)
| Project name | Country | Operation date | Industry | Capture type | Primary storage type |
| Petrobras Santos Basin Pre-Salt Oil Field CCS Project | Brazil | 2013 | Natural gas processing | Pre-combustion capture | Enhanced oil recovery |
| Boundary Dam Carbon Capture and Storage Project | Canada | 2014 | Power generation | Post-combustion capture | Enhanced oil recovery |
| Uthmaniyah ${\mathrm{{CO}}}_{2}$ -EOR Demonstration Project | Saudi Arabia | 2015 | Natural gas processing | Pre-combustion capture | Enhanced oil recovery |
| Quest | Canada | 2015 | Hydrogen production | Industrial separation | onshore deep saline formations |
| Abu Dhabi CCS Project (Phase 1 being Emirates Steel Industries (ESI) CCS Project) | United Arab Emirates | 2016 | Iron and steel production | Industrial separation | Enhanced oil recovery |
| Petra Nova Carbon Capture Project | United States | 2017 | Power generation | Post-combustion capture | Enhanced oil recovery |
Acronym Full spelling
ADB Asian Development Bank
AOD Argon Oxygen Decarburization
BECCS Bio-Energy CCS
BOF Basic Oxygen Furnace
CC Continuous Casting
CCS Carbon Capture, Utilization and Storage
${\mathrm{{CO}}}_{2}$ -EOR ${\mathrm{{CO}}}_{2}$ Enhanced Oil Recovery
CP Cyclopentane
CNPC China’s National Petroleum Corporation
DAC Direct Air Capture
DTAC Dodecyl-trimethyl-ammonium Chloride
EAF Electric Arc Furnace
ECBM Enhanced Coal Bed Methane
EnOpt Ensemble-based Optimization
EOR Enhance Oil Recovery
ESI Emirates Steel Industries
GCCSI Global CCS Institute
HBCC Hydrate-based ${\mathrm{{CO}}}_{2}$ Capture
IEA International Energy Agency
IPCC Intergovernmental Panel on Climate Change
KTH Royal Institute of Technology Sweden
LF Ladle Furnace
LPG Liquefied Petroleum Gas
MEA Monoethanolamine
MLC Medium and Low Carbon
PSA Pressure Swing Adsorption
SDS Sodium Dodecyl Sulphate
TBAB Tetra-n-butyl Ammonium Bromide
THF Tetrahydrofuran
TRT Top-Pressure Recovery Turbine Plant
TSA Temperature Swing Adsorption
VPSA Vacuum Pressure Swing Adsorption
References
ADB. (2020). Carbon capture, utilization, and storage game changers in Asia.
Anderson S. H., Doulas C. L., & Bermel, C. L. (1990). Use of ${\mathrm{{CO}}}_{2}$ in the AOD. In 47th Electric Furnace Conference Proceedings; ISS-AIME (pp. 297-304).
Anderson, Foulard, J., & Lutgen, V. (1989). Inert gas technology for the production of low nitrogen steels. In Electric Furnace Proceeding (pp. 365-375).
Aspelund, A.,& Jordal, K. (2007). Gas conditioning-The interface between ${\mathrm{{CO}}}_{2}$ capture and transport. International Journal of Greenhouse Gas Control, 1(3), 343-354.
Aspelund, A., Molnvik, M. J., & Dekoeijer, G. (2006). Ship transport of ${\mathrm{{CO}}}_{2}$ technical solutions and analysis of costs, energy utilization, exergy efficiency and ${\mathrm{{CO}}}_{2}$ emissions. Chemical Engineering Research & Design, 84(9), 847-855.
Baciocchi, R., Costa G., & Polettini, A., Pomi, R. (2010). Accelerated mineral carbonation of steel slags. In Proceedings of the first International Slag Valorisation Symposium, Leuven, Belgium, April 6-7, 2009 (pp. 51-63). Leuven, Belgium: Katholieke Universiteit Leuven.
Bai, B., Xiaochun, L. I., Liu, Y., & Zhang, Y. (2006). Preliminary study on ${\mathrm{{CO}}}_{2}$ industrial point sources and their distribution in china. Chinese Journal of Rock Mechanics & Engineering, 25(2), 2918-2923.
Baoshan Iron and Steel. (2008). Sustainability report 2007 (116 pp). Shanghai, China: Baoshan Iron and Steel Co. www.baosteel.com
Benson, S. M., & Cole, D. R. (2008). ${\mathrm{{CO}}}_{2}$ sequestration in deep sedimentary formations. Elements, 4(5), 325-331.
Bi, X. R., Zhu, R., & Liu, R. Z. (2012). Fundamental study on stainless steel making through ${\mathrm{{CO}}}_{2} - {\mathrm{O}}_{2}$ mixture blowing. Steelmaking, ${28}\left( 2\right) ,{67} - {70}$ . (in Chinese).
Bi, X. R., Zhu, R., & Lv, M. (2010). Research on mechanism of dust generation in converter. Industrial Heating, 06, 13-16. (in Chinese).
Birat, J.-P. (2010). Carbon dioxide $\left( {\mathrm{{CO}}}_{2}\right)$ capture and storage technology in the iron and steel industry. In Developments and innovation in carbon dioxide $\left( {\mathrm{{CO}}}_{2}\right)$ capture and storage technology Vol. 1: carbon dioxide $\left( {\mathrm{{CO}}}_{2}\right)$ capture, transport and industrial applications (pp. 492-521). Woodhead Publishing Ltd.
Bock, B., Rhudy, R., Herzog, H., Klett, M., Davison, J., & Ugarte, D. G. D. L. T., et al. (2003). Economic evaluation of ${\mathrm{{CO}}}_{2}$ storage and sink enhancement options. Office of Scientific & Technical Information Technical Reports.
Boot-Handford, M. E., Abanades, J. C., Anthony, E. J., Blunt, M. J., Brandani, S., Mac Dowell, N., Fernández, J. R., Ferrari, M.-C., Gross, R., Hallett, J. P., et al. (2014). Carbon capture and storage update. Energy & Environmental Science, 7(1), 130-189.
Bossie-Codreanu, D., Le-Gallo, Y., Duquerroix, J., Doerler, N., & Le Thiez, P. (2003). CO2 sequestration in depleted oil reservoirs. In Paper presented at the Greenhouse Gas Control Technologies-6th International Conference.
Bruce, E. T, Weisang, F., Allibert, M., & Fruehan, R. (1987a). In Electric Furnace Conference Proceedings (p. 293). Chicago: ISS-AIME.
Bruce, E. T, Weisang, F., Allibert, M., Fruehan, R. (1987b). Effects of ${\mathrm{{CO}}}_{2}$ stirring in a ladle. In 45th Electric Furnace Proceedings (pp. 293-297), December 8-11, 1987, Chicago, USA.
Bui, M., Adjiman, C. S., Bardow, A., Anthony, E. J., Boston, A., Brown, S., Fennell, P. S., Fuss, S., Galindo, A., Hackett, L. A., et al. (2018). Carbon capture and storage (CCS): The way forward. Energy & Environmental Science, 11(5), 1062-1176.
Carpenter, A. (2012). CO2abatement in the iron and steel industry (pp. 83-94). IEA Clean Coal Centre.
Chen, J.B., Yang, Z.L, & He D. Z. (2008). Treatment outside the furnace. Metallurgical Industry Press (in Chinese).
Dashti, H., Yew, L. Z., & Lou, X. (2015). Recent advances in gas hydrate-based ${\mathrm{{CO}}}_{2}$ capture. Journal of Natural Gas Science and Engineering, 23, 195-207.
Davidson, R. M. (2007). Post-combustion carbon capture from coal fired plant-solvent scrubbing. CCC/125 (58 pp), London, UK: IEA Clean Coal Centre
Dong, K., Zhu, R., & Liu, R. Z. (2014). Influence of bottom blowing ${\mathrm{{CO}}}_{2}$ in LF on molten steel quality and erosion of ventilated bricks. Journal of University of Science and Technology Beijing, 36(s1), 226-229. (in Chinese).
Dong, X. D. (2008). Experimental study on converter slag quickly absorbing ${\mathrm{{CO}}}_{2}$ . Steelmaking., 24, 29-32. (in Chinese).
Doucet, F. J. (2010). Effective ${\mathrm{{CO}}}_{2}$ -specific sequestration capacity of steel slags and variability in their leaching behaviour in view of industrial mineral carbonation. Minerals Engineering, 23(3), 262-269.
Duc, N. H., Chauvy, F., & Herri, J.-M. (2007). CO2 capture by hydrate crystallization-a potential solution for gas emission of steelmaking industry. Energy Conversion and Management, 48(4), 1313-1322.
Eloneva, S., Teir, S., Salminen, J., Fogelholm, C.-J., & Zevenhoven, R. (2008). Fixation of ${\mathrm{{CO}}}_{2}$ by carbonating calcium derived from blast furnace slag. Energy, ${33}\left( 9\right) ,{1461} - {1467}$ .
Faruque Hasan, M. M., First, E. L., Boukouvala, F., & Floudas, C. A. (2014). A novel framework for carbon capture, utilization, and sequestration, CCUS. In Proceedings of the 8th International Conference on Foundations of Computer-Aided Process Design (pp. 98-107).
Favre, E. (2011). Membrane processes and postcombustion carbon dioxide capture: Challenges and prospects. Chemical Engineering Journal, 171(3), 782-793.
Figueroa, J. D., Fout, T., Plasynski, S., McIlvried, H., & Srivastava, R. D. (2008). Advances in ${\mathrm{{CO}}}_{2}$ capture technology—The U.S. department of energy’s carbon sequestration program. International Journal of Greenhouse Gas Control, 2(1), 9-20.
Fogelholm, C. J., Tveit, T. M., Eloneva, S., Said, A., Revitzer, H., Zevenhoven, R., … & Fält, M. (2009). Reduction of ${\mathrm{{CO}}}_{2}$ emissions and utilization of slag products by producing calcium-based products from carbonate-free slag products (Slag2PCC Plus) (pp. 314- 323). Helsinki, Finland.
Fu ZX, Liu SJ, Fu X. 2010. A method of carbon dioxide injec- tion to Blast Furnace. Chinese Patent, CN101871026 (in Chinese).
Gale, J. (2003). Geological storage of ${\mathrm{{CO}}}_{2}$ : What’s known, where are the gaps and what more needs to be done. In aper presented at the Greenhouse Gas Control Technologies-6th International Conference.
Gao, L., Fang, M., Li, H., & Hetland, J. (2011). Cost analysis of ${\mathrm{{CO}}}_{2}$ , transportation: Case study in china. Energy Procedia, 4(22), 5974-5981.
GCCSI (Global CCS Institue). (2017a). Yanchang integrated carbon capture and storage demonstration project.
GCCSI (Global CCS Institue). (2017b), Large scale CCS projects
Giorno, L., Drioli, E., & Strathmann, H. (2015). The principle of gas separation. In Encyclopedia of membranes (pp. 1-6).
Gu, Y. L., Wang, H. J., Zhu, R., Wang, J., Lv, M., & Wang, H. (2014). Study on experiment and mechanism of bottom blowing ${\mathrm{{CO}}}_{2}$ during the LF refining process. Steel Research International, 85(4), 589-598.
Gulyaev, M. P, & Filippov, V. V. (2001). The first systems of bottom blowing with inert-gas in electric arc furnace. Proceedings of the 6-th Congress of Steelmakers (p. 308).
Gunter, W. D., Perkins, E. H., & McCann, T. J. (1993). Aquifer disposal of ${\mathrm{{CO}}}_{2}$ -rich gases: reaction design for added capacity. Energy Conversion and Management, 34(9-11), 941- 948.
Guo, M. X., & Chen, X. W. (1993). Action mechanism of bottom- blown ${\mathrm{{CO}}}_{2}$ in the bath of combined-blown converter. Journal of Iron and Steel Research, 1, 9-14. (in Chinese).
Guo, X. Q, Yuan, L., Zhang, J., Wu, S. Q. (2010). A method of CO ${}_{2}$ utilization as the transmission medium of pulverized coal injection into BF (Chinese Patent, CN 102382915) (in Chinese).
Hao, G.-P., Li, W.-C., & Lu, A.-H. (2011). Novel porous solids for carbon dioxide capture. Journal of Materials Chemistry, 21(18).
Hara, R. D. O., Spence, A. G. R., & Eissenwasser, J. D. (1986). Carbon dioxide shrouding and purging at IPSCO Melt shop. Iron Steelmaker, 3, 24-28.
He, P., Zhang, D. M., & Deng, K. W. (1992). Gas stirring technology with bottom blowing in EAF. Iron Steel, 9, 65-70. (in Chinese).
Hong, Y. G. (2012). Experimental study on desilication of hot metal with carbon dioxide injection (Master thesis). Northeastern University (in Chinese).
IEA. (2016). 20 years of carbon capture and storage: Accelerating future deployment. France: International Energy Agency.
Inagaki, M., & Kang, F. (2014). Engineering and applications of carbon materials. In Materials science and engineering of carbon: Fundamentals (pp. 219-525).
Ismail, A. F., Kusworo, T. D., Mustafa, A., & Hasbullah, H. (2005). Understanding the solution-diffusion mechanism in gas separation membrane for engineering students. In Paper presented at the Regional Conference on Engineering Education RCEE.
Jahangiri, H. R., & Zhang, D. (2012). Ensemble based co-optimization of carbon dioxide sequestration and enhanced oil recovery. International Journal of Greenhouse Gas Control, 8(5), 22-33.
Jin, G. L. (1985). Application study of LD converter bottom blowing N2-CO2. Steelmaking., 3, 96-100. (in Chinese).
Jin, R. J., Zhu, R., Feng, L. X., & Yin, Z. J. (2007). Experimental study of steelmaking with ${\mathrm{{CO}}}_{2}$ and ${\mathrm{O}}_{2}$ mixed blowing. Journal of University of Science and Technology Beijing, 29(S1), 77-80. (in Chinese).
Kim, H., Lee, J., Lee, S., Lee, I.-B., Park, J.-H., & Han, J. (2015). Economic process design for separation of ${\mathrm{{CO}}}_{2}$ from the off-gas in ironmaking and steelmaking plants. Energy,88, 756-764.
Kovscek, A. R. (2002). Screening criteria for ${\mathrm{{CO}}}_{2}$ storage in oil reservoirs. Petroleum Science and Technology, 20(7-8), 841-866.
Kunzler, C., Alves, N., Pereira, E., Nienczewski, J., Ligabue, R., Einloft, S., & Dullius, J. (2011). ${\mathrm{{CO}}}_{2}$ storage with indirect carbonation using industrial waste. Energy Procedia,4, 1010-1017.
Larsen, J. W. (2004). The effects of dissolved ${\mathrm{{CO}}}_{2}$ on coal structure and properties. International Journal of Coal Geology, 57(1), 63-70.
Lee, S.-Y., & Park, S.-J. (2015). A review on solid adsorbents for carbon dioxide capture. Journal of Industrial and Engineering Chemistry, 23, 1-11.
Leung, D. Y., Caramanna, G., & Maroto-Valer, M. M. (2014). An overview of current status of carbon dioxide capture and storage technologies. Renewable and Sustainable Energy Reviews, 39, 426-443.
Li, C. B., & Han, Y. (1996). The application of the combined blowing technique with ${\mathrm{{CO}}}_{2}$ bottom blowing to the converters of Anshan Iron and Steel Company. Steelmaking., 4, 19-25. (in Chinese).
Li, Q., Liu, R. Z., & Zhu, R. (2015a). Research on decarburization and chromium conservation by blowing carbon dioxide. Industrial Heating, 44(4), 24-26. (in Chinese).
Li, Q., Wang, H., & Zhu, R. (2015b). Experimental study on ${\mathrm{{CO}}}_{2}$ as shield gas of continuous casting. Continuous Casting, 40(2), 5-9. (in Chinese).
Li, X., Liu, Y., Bai, B., & Fang, Z. (2006). Ranking and screening of ${\mathrm{{CO}}}_{2}$ saline aquifer storage zones in china. Chinese Journal of Rock Mechanics & Engineering, 25(5), 963-968.
Liu, L. S. (1983). Study on ${\mathrm{{CO}}}_{2}$ being protection media for side- blown oxygen lance in converter. Hebei Metall., 3, 80-81. (in Chinese).
Liu, H., & Gallagher, K. S. (2011). Preparing to ramp up large-scale CCS demonstrations: An engineering-economic assessment of ${\mathrm{{CO}}}_{2}$ , pipeline transportation in china. International Journal of Greenhouse Gas Control, 5(4), 798-804.
Liu, Y. F., Li, X. C., & Bai, B. (2005). Preliminary estimation of ${\mathrm{{CO}}}_{2}$ storage capacity of coalbeds in china. Chinese Journal of Rock Mechanics & Engineering, 24(16), 2947-2952.
Lv, M., Zhu, R., Bi, X. R., & Lin, T. C. (2011a). Research on ${\mathrm{{CO}}}_{2}$ application in BOF steelmaking process. Journal of University of Science and Technology Beijing, S1, 126- 130. (in Chinese).
Lv, M., Zhu, R., & Bi, X. R. (2011b). Fundamental research on dephosphorization of BOF by COMI steelmaking process. Iron Steel, 8, 31-35. (in Chinese).
Mccollum, D. L., & Ogden, J. M. (2006). Techno-economic models for carbon dioxide compression, transport, and storage & correlations for estimating carbon dioxide density and viscosity. In Working Paper Series. Institute of Transportation Studies.
McCoy, S. T., & Rubin, E. S. (2008). An engineering-economic model of pipeline transport of ${\mathrm{{CO}}}_{2}$ with application to carbon capture and storage. International Journal of Greenhouse Gas Control, 2(2), 219-229.
Merkel, T. C., Lin, H., Wei, X., & Baker, R. (2010). Power plant post-combustion carbon dioxide capture: An opportunity for membranes. Journal of Membrane Science, 359(1-2), 126-139.
Metz, B., (2005). “IPCC Special Report on Carbon Dioxide Capture and Storage.” Economics & Politics of Climate Change.
Metz, B., Davidson, O., & De Coninck, H. (Eds.). (2005). Carbon dioxide capture and storage: special report of the intergovernmental panel on climate change. Cambridge University Press.
Mohitpour, M., Golshan, H., Murray, A., (2003). In: Pipeline design & construction (1st ed.). ASME Press.
Mondal, M. K., Balsora, H. K., & Varshney, P. (2012). Progress and trends in ${\mathrm{{CO}}}_{2}$ capture/separation technologies: A review. Energy, 46(1), 431-441.
Ning, X. J., Yin, Z. J., Yi, C., Zhu, R., & Dong, K. (2009). Experimental research on dust reduction in steelmaking by ${\mathrm{{CO}}}_{2}$ . Steelmaking, 5, 32-34. (in Chinese).
Normanton, A. S. (Steel Times), Wang, X. C. (Translate). (1990). Application of ${\mathrm{{CO}}}_{2}$ in steelmaking process in English steel industry (Vol. 2, pp. 21-27). Wisco Technologies (in Chinese).
Oelkers, E. H., Gislason, S. R., & Matter, J. (2008). Mineral carbonation of ${\mathrm{{CO}}}_{2}$ . Elements, 4(5), 333-337.
Olajire, A. A. (2010). ${\mathrm{{CO}}}_{2}$ capture and separation technologies for end-of-pipe applications-A review. Energy, 35(6), 2610-2628.
Paules, J. R, Grieshaber, K. W, & Martines, M. L. (1987). Ladle stirring and stream shrouding with carbon diodide at Armeco’s Midwestern Steel Division. In 70th Steelmaking Conference Proceedings, Mar 29-Apr 1, 1987 (pp. 129-132), Pittsburgh, USA.
Paules, J. R. (1987). Ladle stirring and stream shrouding with ${\mathrm{{CO}}}_{2}$ at Armco’s Midwestern Steel Division. In The 70th Steelmaking Conference Proceedings Mar 29-Apr 1 1987, Pittsburgh, America.
Rawlins, C. H., Richards, V. L., Peaslee, K. D., Lekakh, S. N. (2006). Steelmaking slag as a permanent sequestration sink for carbon dioxide. Steel Times International, 30(7), 25-26, 28.
Rice, D. D., Law, B. E., & Clayton, J. L. (1993). Coalbed gas—An undeveloped resource. US Geological Survey Professional Paper, 1570, 389-404.
Richards, V. L., Peaslee, K., Smith, J. D. (2008). Geological sequestration of ${\mathrm{{CO}}}_{2}$ by hydrous carbonate formation with reclaimed slag. TRP 9955 (307 pp). Oak Ridge, TN, USA: Office of Scientific and Technical Information. www.osti.gov/bridge.
Seoane, B., Coronas, J., Gascon, I., Etxeberria Benavides, M., Karvan, O., Caro, J., Kapteijn, F., & Gascon, J. (2015). Metal-organic framework based mixed matrix membranes: A solution for highly efficient ${\mathrm{{CO}}}_{2}$ capture? Chemical Society Reviews,44(8),2421-2454.
Song, J., & Zhang, D. (2013). Comprehensive review of caprock-sealing mechanisms for geologic carbon sequestration. Environmental Science and Technology, 47, 9-22.
Spigarelli, B. P., & Kawatra, S. K. (2013). Opportunities and challenges in carbon dioxide capture. Journal of CO2 Utilization, 1, 69-87.
Suzuki, K., Kumagai, T., & Sano, N. (1992). Removal of boron from metallurgical-grade silicon by applying the plasma treatment. ISIJ International, 32(5), 630-634.
Svensson, R., Odenberger, M., Johnsson, F., & Strömberg, L. (2004). Transportation system for ${\mathrm{{CO}}}_{2}$ - application to carbon capture and storage.Energy Conversion and Management, 45(15-16), 2343-2353.
Tang, F. P, Zhao, G., Li, D. G., Cao, D., & Zhao, C. L. (2011). A smelting method for stainless steel production with ${\mathrm{{CO}}}_{2}$ blowing in AOD (Chinese patent, CN102146499) (in Chinese).
Teng, Y., & Zhang, D. (2018). Long-term viability of carbon sequestration in deep-sea sediments. Science Advances, 4.
Teir, S., Eloneva, S., Fogelholm, C.-J., & Zevenhoven, R. (2007). Dissolution of steelmaking slags in acetic acid for precipitated calcium carbonate production. Energy, 32(4), 528-539.
Uibu, M., Kuusik, R., Andreas, L., & Kirsimäe, K. (2011). The ${\mathrm{{CO}}}_{2}$ -binding by Ca-Mg-silicates in direct aqueous carbonation of oil shale ash and steel slag. Energy Procedia, 4, 925-932.
Van Wijngaarden, M. J., & Pieterse, A. T. (1994). Bottom-stirring in an electric-arc furnace: Performance results at Iscor Vereeniging Works. Journal of the Southern African Institute of Mining and Metallurgy, 1, 27-34.
Vandeginste, V., & Piessens, K. (2008). Pipeline design for a least-cost router application for ${\mathrm{{CO}}}_{2}$ , transport in the ${\mathrm{{CO}}}_{2}$ , sequestration cycle. International Journal of Greenhouse Gas Control, 2(4), 571-581.
Wang, H., Zhu, R., & Liu, R. Z. (2014). CO2 application on bottom blowing in EAF. Industrial Heating, 43(2), 12-14. (in Chinese).
Wang, H. J., Teng, L. D., Seetharaman, S. (2012). Heat and material balance calculations with introduction of ${\mathrm{{CO}}}_{2}$ during EAF processes. In: 5th International Congress on Steelmaking Technology, October 1-3, 2012, Dresden
Wang, H. J., Viswanathan, N. N., Ballal, N. B., & Seetharaman, S. (2009). Modelling of reactions between gas bubble and molten metal bath-experimental validation in the case of decar-burization of Fe-Cr-C melts. High Temp Mater Process, 28(6), 407-419.
Wang, H. J., Viswanathan, N. N., Ballal, N. B., & Seetharaman, S. (2010). Modelling of physico-chemical phenomena between gas inside a bubble and liquid metal. Journal of Chemical Reaction Engineering, 8, 45-54.
Wang, S. L. (1986). Metallurgical behaviours of gas bottom blowing in converter. Steelmaking, 3, 24-30. (in Chinese).
Wang, S. L. (1989). Gas supply model of bottom blowing ${\mathrm{{CO}}}_{2}$ in converter. Steelmaking., 4, 1-7. (in Chinese).
Wilberforce, T., Baroutaji, A., Soudan, B., Al-Alami, A. H., & Olabi, A. G. (2019). Outlook of carbon capture technology and challenges. Science of the Total Environment, 657, 56-72.
Wilcox, J., Haghpanah, R., Rupp, E. C., He, J., & Lee, K. (2014). Advancing adsorption and membrane separation processes for the gigaton carbon capture challenge. Annual Review of Chemical and Biomolecular Engineering, 5, 479-505.
Wu, J. J., Li, Y., Ma, W., Liu, K., Wei, K., Xie, K., Yang, B., & Dai, Y. (2014). Impurities removal from metallurgical grade silicon using gas blowing refining techniques. SILICON, 6(1), 79-85.
Wu, J.-J., Ma, W.-H., Yang, B., Dai, Y.-N., & Morita, K. (2009). Boron removal from metallurgical grade silicon by oxidizing refining. Transactions of Nonferrous Metals Society of China, 19(2), 463-467.
Xiuzhang, W. (2014). Shenhua Group’s carbon capture and storage (CCS) demonstration. Mining Report, 150(1-2), 81-84.
Yi, C., Zhu, R., Yin, Z. J., & Hou, N. N. (2009). Experimental study of COMI steel making process based on 30t converter. Chinese Journal of Proceeding Engineering, S1, 222-225. (in Chinese).
Yin, Z. J., Zhu, R., & Yi, C. (2009). Fundamental research on controlling BOF dust by COMI steelmaking process. Iron Steel, 10, 92-94. (in Chinese).
Yu, H. C, Wang, H. J., & Chu, S. J. (2015). Fundamental investigations on M-LCFeCr smelting by introducing ${\mathrm{{CO}}}_{2}$ . In The 6th International Congress on the Science and Technology of Steelmaking (ICS2015), May 12-14, 2015, Beijing.
Yu, H. C. (2015). Master thesis. Beijing: University of Science and Technology (in Chinese).
Yuan, Z. F, Zhao, H. X., Pan, Y. F. (2007). Method for CO2being applied in slag splashing in converter (Chinese patent). ZL200610165219.2 (in Chinese).
Zhang, Z. X., Wang, G. X., Massarotto, P., & Rudolph, V. (2006). Optimization of pipeline transport for ${\mathrm{{CO}}}_{2}$ sequestration. Energy Conversion and Management,47(6),702-715.
Zhao, H.-X., Yuan, Z.-F., Wang, W.-J., Pan, Y.-F., & Li, S.-Q. (2010). A novel method of recycling ${\mathrm{{CO}}}_{2}$ for slag splashing in converter. Journal of Iron and Steel Research International, 17, 11-16.
Zhao, X. J. (1995). Development of bottom blowing technology of EAF abroad. Steeltubes, 5, 12-15. (in Chinese).
Zhu, R., Lv, M., Lin, T. C. (2012). Application research of carbon dioxide during the steelmaking process. In 5th International Congress on Steelmaking Technology, October 1-3, 2012, Dresden.
Zhu, R., Yi, C., Chen, B. Y., & Wang, C. Y. (2010). Research on inner circulation control of steelmaking dust by COMI process. Energy Metall Industries, 1, 48-51. (in Chinese).
CCUS: What is It? How Does It Cost? Techno-Economic Analysis
Qianguo Lin, Xi Liang, Ming Lei, Y. M. Zhang, Y. R. Pan, and N. Wang
${\mathrm{{CO}}}_{2}$ capture, utilization and storage technology (CCUS) is one of the few technologies that can help industry achieve large-scale ${\mathrm{{CO}}}_{2}$ emission reductions. Currently, huge investment and operating costs, as well as lack of financially viable business models are generally seen as the main obstacles to the development of CCUS. According to IEA estimates, currently for CCS project to sequester one ton of ${\mathrm{{CO}}}_{2}$ emissions, it would cost as high as $\$ {200} - {300}$ on average, and that cost varies greatly, depending on local and project-specific engineering conditions. A full-chain CCUS project is particularly complex, involving multiple interactions between carbon capture, transportation, utilization and storage activities. Even within an iron or steel plant, CCUS involves not only multiple gas sources in the capture process, but also different capture technologies for different gas sources. That being the case, cost estimates in connection with tech-performance of CCUS are all the more important, because they can help decision-makers understand and identify cost-effective pathways, when making decisions about deploying CCUS projects.
The original version of this chapter was revised: A sentence has been added on page 109. The correction to this chapter can be found at https://doi.org/10.1007/978-981-16-4310-1_8.
M. Lei (★)
Guanghua School of Management, Peking University, Beijing, China
Q. Lin $\cdot$ X. Liang
University of Edinburgh Business School, Edinburgh, U.K.
Y. M. Zhang · Y. R. Pan · N. Wang
North-China Electric Power University, Beijing, China
Thus, building upon the previous chapter, in Chapter 4, we attempt a systematic techno-economic analysis of the efficacy of different carbon capture technologies for major sources of carbon emissions in the steel sector.
Chapter 4 is organized into four sections. Section 1 identifies the main ${\mathrm{{CO}}}_{2}$ emission sources of a typical production process of China’s iron/steel industry. Section 2 discusses suitable carbon capture technologies for each emission source. Section 3 conducts a systematic techno-economic analysis of different capture methods for each emission source. Section 4 concludes with a caveat, calling for attention to local and firm-specific engineering conditions.
1 Section 1
1.1 Main ${\mathrm{{CO}}}_{2}$ Emission Sources from Iron/steel Industry
The steel/iron production process can be divided into a main process and an auxiliary process. The main process can be further categorized into long process (BF/BOF) and short process (EAF). The long process (BF/BOF) starts with raw materials such as iron ore, through the processes of mining, milling of ores, blast furnace, converter secondary metallurgy, continuous casting, steel rolling and other processes. The short process (EAF) refers to the use of scrap steel as raw materials to make steel product, though casting of electric furnace, ladle furnace, continuous rolling and other processes. The auxiliary process refers to the production process which has a great influence on the environmental, such as coking, boiler, oxygen production, fuel gas processing, energy discharge and internal transportation. At present, the long process is mainly adopted by China’s iron/steel industry; crude steel production accounts for 90% of total steel production in China (Cui, 2016); in addition, the per ton steel ${\mathrm{{CO}}}_{2}$ emission of crude steel produced by a short process is far less than that of crude steel produced by a long process $\left( {\mathrm{{CO}}}_{2}\right.$ emission associated with converter process is 5 times than that associated with electrical furnace process (Ran & Weng, 2006). Therefore, the ${\mathrm{{CO}}}_{2}$ produced by long process production process is the main ${\mathrm{{CO}}}_{2}$ emission source of China’s steel/iron industry.
The production processes of a long process steel/iron industry mainly include 5 processes: coking, sintering, iron-making, steel-making and steel rolling. The iron-making process has three types: blast furnace iron-making, direct-reduction iron-making and molten reduction technology. The steel-making process has two types, which is converter steel-making and electric furnace steel-making. In the process of coking, sintering, iron-making, steel-making and rolling steel, fuel coal, coking coal, coke, natural gas and fuel oil are not only the source of energy, but also raw materials. Some part of carbon in these energy and material sources is converted and released in the form of ${\mathrm{{CO}}}_{2}$ by the way of reduction or oxidation reaction in the whole production process. The main ${\mathrm{{CO}}}_{2}$ emission sources are released from units include lime kiln, coke oven, hot blast furnace, blast furnace, converter and self-provided power plant.
1.2 ${\mathrm{{CO}}}_{2}$ Emission from Lime Kiln
In iron-making process, lime kiln is used to produce lime as flux and slag materials to be used in blast furnace iron-making and converter iron-making processes to remove harmful elements from smelting, such as sulphur, silicon, phosphorus other impurities. Lime is formed by the limestone calcination, the main component of limestone is calcium carbonate. The basic principle of burning limestone can be expressed by the following chemical reaction equation (Eq. 1):
$$ {\mathrm{{CaCO}}}_{3}\xrightarrow[]{ > {900}^{ \circ }\mathrm{C}}\mathrm{{CaO}} + \mathrm{{CO}} \uparrow \tag{1} $$The limestone and air are preheated to about ${900}{}^{ \circ }\mathrm{C}$ in the lime kiln preheater. After lime produced, the lime (product) will be cooled to below about ${100}{}^{ \circ }\mathrm{C}$ by cooling gas. After the cooling gas enters a roast area to mix with the exhaust gas from combustion, the temperature of mixed gas will reach about ${900}{}^{ \circ }\mathrm{C}$ . The mixed gas is then recycled and reused for heating limestone and air in the subsequent limestone preheating process. After the preheating process, the temperature of flue gas is reduced to ${60} - {80}^{ \circ }\mathrm{C}$ . Although when the breakdown of limestone can release about ${40}\%$ of its weight in the form of ${\mathrm{{CO}}}_{2}$ , after mixing with exhaust gas from combustion and circulating, ${\mathrm{{CO}}}_{2}$ content in the flue gas will be significantly decreased. ${\mathrm{{CO}}}_{2}$ from different lime kiln unit may have different concentrations.
According to the report of Applying carbon capture and storage to a Chinese steel plant which is prepared for Global Carbon Capture and Storage Institute Ltd by Toshiba International Corp Pty Ltd/Toshiba Corporation in collaboration with Tongfang Environment Co. Ltd, China Shougang Caofeidian plant has 6 sets shaft lime kilns, used for production of lime needed by steel mill. The flue gas composition of #4 lime kiln from Caofeidian plant is given in Table 1, indicating 19.3% ${\mathrm{{CO}}}_{2}$ concentration. Shen (2008) reported that the ${\mathrm{{CO}}}_{2}$ concentration of flue gas of a typical limestone kilns outlet in the integrated iron and steel enterprise was 15-21%.
Table 1 Flue gas composition of #4 Lime Kiln in Shougang Jingtang
| Flow rate ${\mathrm{m}}^{3}\mathrm{\;N}/\mathrm{h}$ | Temperature ℃ | Concentration $\left( {\mathrm{{CO}}}_{2}\right)$ Vol.% | ${\mathrm{{CO}}}_{2}$ emission t/d | kt/year | |
| #4 lime kiln | 75,304 | 110 | 19.3 | 685 | 205 |
1.3 CO2 Emission from Coke Oven
The coke oven flue gas from steel/iron plant is the exhaust gas produced by combustion and discharged through a coke oven chimney. The mixture of coke oven gas and blast furnace gas is generally used for coke oven heating by integrated iron and steel enterprises. Accordingly, the ${\mathrm{{CO}}}_{2}$ concentration is mainly affected by the combustion condition and the composition of combustion feed gas. According to the report of Applying carbon capture and storage to a Chinese steel plant which is prepared for Global Carbon Capture and Storage Institute Ltd by Toshiba International Corp Pty Ltd/Toshiba Corporation in collaboration with Tongfang Environment Co. Ltd, the ${\mathrm{{CO}}}_{2}$ concentration of the combustion flue gas from coke oven in China Shougang Jingtang was ${11}\%$ . The report of Global Carbon Capture and Storage presented a concentration range of 10-15% (Global CCS Institute, 2016).
There is another gas source related to coking produced by coking process. It is called raw coke oven gas or raw coal gas. The raw coal gas can be purified though a coke oven gas purification system (Fig. 1). Coke oven gas purification process is differentiated mainly based on different desulphurization and deamination configurations. Generally, there are two kinds desulfurization system: dry desulfurization and wet desulfurization. Wet desulfurization process can be further categorized into two types: wet oxidation process and wet absorption process. The wet absorption process has the function of removing ${\mathrm{{CO}}}_{2}$ simultaneously, leading to a low ${\mathrm{{CO}}}_{2}$ concentration in the purified flue gas.
The Sulfiban method of wet absorption process was applied in the coal gas refining system in Baosteel phase II which was put into operation in May 1997. Through an intermediate cooling tower, the coal gas after naphthalene removed enters an ammonia absorption facility, where a 75% of ammonium dihydrogen phosphate is used as absorption solution. The rich solution is ammonium hydrogen phosphate. Ammonia solution with concentration of ${18}\%$ is obtained after desorption. Anhydrous ammonia with the concentration of 99.8% is finally obtained after further pressurized and concentrated. The absorbents can be recycled after desorption. The coal gas which absorbed ammonia enters a final cooling tower after dephenolization and decyanation. The coal gas without ammonia enters a benzol scrubber to remove crude benzene. The gas is then delivered to a gas cabinet for storage after desulfuration and decyanation processes. The sulfur enriched solution is desorbed in a desorption facility. The obtained ${\mathrm{H}}_{2}\mathrm{\;S},\mathrm{{HCN}}$ and ${\mathrm{{CO}}}_{2}$ are then sent to combustion furnace to generate ${\mathrm{{SO}}}_{2}$ and ${\mathrm{{NO}}}_{\mathrm{x}}$ .
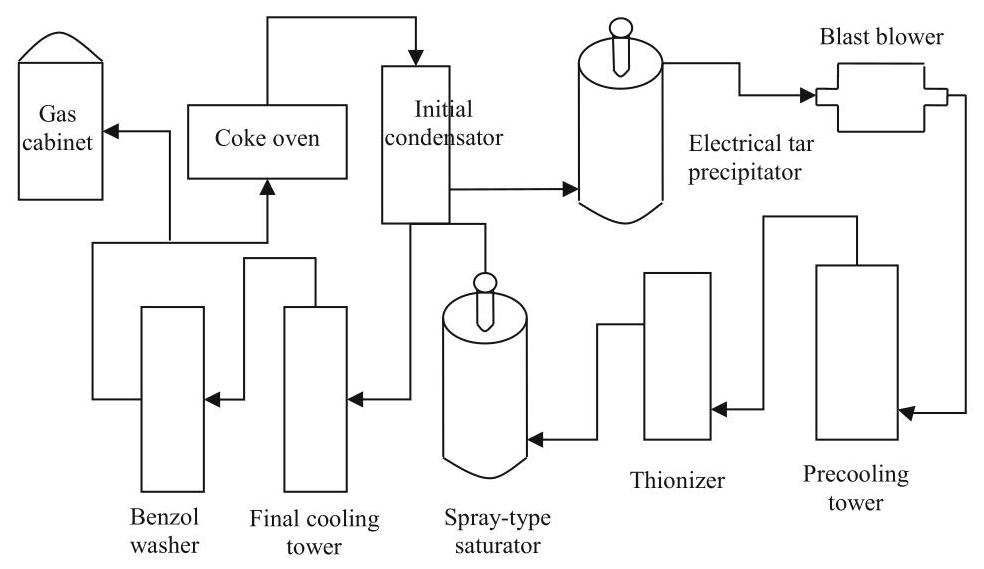
Fig. 1 Coke oven gas purification system
The composition of a typical purified coal gas is illustrated in Table 3. Because ${\mathrm{{CO}}}_{2}$ is partially removed by ammonia absorption process, the concentration of ${\mathrm{{CO}}}_{2}$ is as low as ${2.1}\%$ . Comparing coke oven flue gas and coke oven gas, the former is a combustion product discharged through a coke oven chimney, its ${\mathrm{{CO}}}_{2}$ concentration is relatively high; the latter is a direct product produced in the coking process of coal, its ${\mathrm{{CO}}}_{2}$ concentration is relatively low particularly after absorption of ammonia. Therefore, coke oven flue gas is more suitable for the application of carbon capture technology than the coke oven gas (Table 2).
Table 2 Composition of typical coke oven gas
| Composition | CO | ${\mathrm{{CO}}}_{2}$ | ${\mathrm{H}}_{2}$ | ${\mathrm{N}}_{2}$ | ${\mathrm{{CH}}}_{4}$ | ${\mathrm{C}}_{2}{\mathrm{H}}_{4}$ | ${\mathrm{C}}_{2}{\mathrm{H}}_{6}$ | ${\mathrm{C}}_{3}{\mathrm{H}}_{6}$ | ${\mathrm{O}}_{2}$ | ${\mathrm{H}}_{2}\mathrm{O}$ |
| Coke oven gas | 5.9 | 2.1 | 58.8 | 3.8 | 25.6 | 2.3 | 0.9 | 0.2 | 0.4 | saturation |
Table 3 Operating condition at TRT inlet and outlet
| Item | Numerical value |
| Blast furnace top pressure | 0.20 MPa |
| TRT inlet pressure | 0.17 MPa |
| TRT outlet pressure | 0.01 MPa |
| TRT inlet gas temperature | 100 °C |
| TRT outlet gas temperature | 50 ${}^{ \circ }\mathrm{C}$ |
1.4 ${\mathrm{{CO}}}_{2}$ Emission from Blast Furnace
An iron-making process makes use of iron ore, fuel (coke, sometimes it is supplemented by heavy oil, pulverized coal, natural gas etc.) and other auxiliary raw materials to produce molten iron and two by-products (slag and coal gas) through heating, decomposing, revivification slagging, desulfuration and other reactions in a blast furnace. In the production of blast furnace, iron ore, coke and limestone are put into the furnace from the top. After preheated through a hot blast furnace, air is blown into the furnace from the bottom by a blast blower. Under high temperature, carbon of coke, pulverized coal, heavy oil, natural gas and other fuels and blowing oxygen burn to generate carbon monoxide (CO). In the rising process of CO in a furnace, the oxygen in iron ore is removed, the iron ore is reduced to molten iron. The molten iron is released from a iron hole as the product of blast furnace; the non-reductive impurities in iron ore react with the fluxes such as limestone to generate slag, discharging from a slag hole; the generated gas (blast furnace gas) is released from the top of the furnace. After removal of dust, the gas can be used as the fuel of hot blast furnace, heating furnace, coke oven, boiler, etc. The pressure of blast furnace gas (BFG) mainly depends on the pressure of blowing air.
Blast furnace gas can be classified into coarse dust removal coal gas, semi-clean dust removal coal gas and fine dust removal coal gas. According to different purification methods, blast furnace gas can be purified by dry dust and wet dust removal methods. The coarse dust removal is usually conducted with dry method. The coarse dust removal is the first purification in a dust removal process. The semi-clean dust removal can adopt wet method or dry method. The fine dust removal is the final stage of BFG dust removal. The purified fine gas can be sent to a gas pipeline after energy recovered by a blast furnace top gas pressure recovery turbine system (TRT). Blast furnace top gas pressure recovery turbine (TRT) system makes use of pressure energy and sensible heat of BFG. Through the system, the blast furnace gas pressure energy and part of heat energy can be converted into mechanical energy and then drives a generator to generate electricity.
Table 4 BFG composition of typical iron/steel plant in China
| Composition | CO | ${\mathrm{{CO}}}_{2}$ | ${\mathrm{H}}_{2}$ | ${\mathrm{N}}_{2}$ | ${\mathrm{O}}_{2}$ |
| Vol% | 21.8 | 23.1 | 3.2 | 51.7 | 0.2 |
The capacity of TRT should be matched to the gas amount of a blast furnace and the furnace top pressure, while amount of blast furnace gas is associated with the capacity of blast furnace blower. Temperature and pressure will be mainly changed between the inlet and outlet of TRT. Table 3 illustrated a typical operating condition at TRT inlet and outlet. It is observed that pressure and temperature decrease significantly after TRT. The main composition of blast furnace gas after TRT is $\mathrm{{CO}},{\mathrm{{CO}}}_{2},{\mathrm{\;N}}_{2},{\mathrm{H}}_{2}$ and ${\mathrm{{CH}}}_{4}$ . Table 4 is the blast furnace gas composition of a typical steel/iron plant in China. The ${\mathrm{{CO}}}_{2}$ concentration is ${23.1}\%$ which is higher than that of flue gas from lime kiln.
1.5 CO2 Emission from Converter
In the Linz-Donawitz smelting process, the molten iron in the furnace reacts with the blown oxygen. The produced gas is called Linz-Donawitz gas (LDG), which is mainly from the oxidation of carbon in molten iron. Due to the high temperature in a converter furnace, the main oxide of carbon is CO, account for about 90% of total amount carbon oxides. A small portion of carbon reacts directly with oxygen to produce ${\mathrm{{CO}}}_{2}$ and some $\mathrm{{CO}}$ could escape from the surface of molten steel and react with oxygen to produce ${\mathrm{{CO}}}_{2}$ .
At the beginning of blowing oxygen process, the temperature of molten iron is low, the easily oxidized elements silicon and manganese in the molten iron are first oxidized, then phosphorus, sulfur and other elements; meanwhile, a small portion of iron is also oxidized. Because carbon has a lower oxidation rate, furnace gas volume produced is relatively small and the furnace gas temperature is relatively low. With huge heat released associated with the oxidation reaction of above elements, the temperature of the molten pool increases correspondingly. When the temperature of the molten pool exceeds ${1400}{}^{ \circ }\mathrm{C}$ , carbon and oxygen react violently, leading to CO content in the furnace gas gradually increased. The amount of furnace gas produced per unit time is related with the intensity of blowing oxygen and carbon reduction speed. The greater of the intensity of blowing oxygen and the faster of the carbon reduction speed, the more of the amount of furnace gas produced in unit time. In the later period of converting, with the decrease of carbon in molten iron, the amount of LDG production decreases, but the temperature of LDG rises with the rising temperature of molten pool.
The Linz-Donawitz steel-making is usually intermittent. One process may take about 40 min. In the time of beginning and end of converting, the amount of furnace gas is small and CO content is low, hence, the furnace gas is normally taken in the middle section. The former and latter periods are called pre-combustion period and post-combustion period. The middle period for capture furnace gas is called capture period. Due to the periodicity of a Linz-Donawitz steel-making process, the capture time is intermittent, resulting in furnace gas intermittently discharged.
In the process of converting, when adding auxiliary raw material to a converter, the amount of furnace gas will increase rapidly. The auxiliary raw materials are slagging flux and coolant. The slagging flux mainly uses lime and the coolant mainly uses steel scrap, iron ore and oxidized scale. After the gas leaves the furnace mouth of converter, it will burn when meets air. In addition, the gas contains highly toxic materials. Therefore, the high temperature flue gas needs to be captured at the furnace mouth of converter. When the high temperature flue gas pass through a evaporation cooling facility, the flue gas is initially cooled while some heat energy is recovered. The temperature at the outlet the evaporation cooling facility is about ${900}{}^{ \circ }\mathrm{C}$ (Zhang et al.,2017). After initially cooling and coarse dust removal, the flue gas needs to be further cooled and depressurization to meet operating conditions of fine dust removal units.
Dust removal purification methods have two types: wet method and dry method. ① The typical process of wet purification system is: after released from a converter, the gas is initially cooled to ${800} - {1000}{}^{ \circ }\mathrm{C}$ through a vaporizing cooler, then go through the first-degree venturi tube, the first elbow dehydrator, the second-grade venturi tube and the second elbow dehydrator successively. Spraying water at the throat of the venturi tube will decrease gas temperature to about ${35}^{ \circ }\mathrm{C}$ and reduce the dust content in the gas. The purified gas is then sent to a gas storage cabinet by an induced draft fan. ② A typical process of dry purification system is: the gas temperature is dropped to ${1000}{}^{ \circ }\mathrm{C}$ through vaporizing cooler, then further dropped to ${200}{}^{ \circ }\mathrm{C}$ by using an evaporative cooling tower. Through dust removal of dry-type electrostatic precipitator, the purified gas is fed into a gas storage cabinet by an induced draft fan. Compared to wet method, dry method purification system has the following advantages:
Table 5 Composition of typical LDG
| Composition | CO | ${\mathrm{{CO}}}_{2}$ | ${\mathrm{H}}_{2}$ | ${\mathrm{N}}_{2}$ | ${\mathrm{{CH}}}_{4}$ | ${\mathrm{C}}_{2}{\mathrm{H}}_{4}$ | ${\mathrm{C}}_{2}{\mathrm{H}}_{6}$ | ${\mathrm{C}}_{3}{\mathrm{H}}_{6}$ | ${\mathrm{O}}_{2}$ | ${\mathrm{H}}_{2}\mathrm{O}$ |
| Vol% | 58.5 | 15.1 | 3.7 | 21.5 | 1.0 | 0.1 | 0 | 0 | 0.1 | saturation |
The dust content of gas is low;
Because of well-developed automation system leading to a quick switch of gas capture system, gas capture rate is increased. Normally, the capture rate of dry method system is 15-30% more than that of wet method one.
The dust content of gas is low after purification, resulting in longer life of draught fan and less workload of maintenance s;
System resistance is small;
Water conservation;
Total power load of dry method system is much less than wet method;
Increase the recycled amount of dust containing iron and reduce the associated transportation cost;
Water treatment system is unnecessary, reduce land use;
Reduce secondary pollution of waste water and reduce dispersed gas amount.
The disadvantage is:
Complex system, high failure rate and high maintenance cost;
Requires high management and operational skills. More training for manager and operators be carried out.
Fixed investment cost is high (Wang et al., 2008).
Table 5 demonstrates the composition of a typical Linz-Donawitz gas (LDG) after dust removal. The temperature of the gas is about ${100}{}^{ \circ }\mathrm{C}$ and the pressure is slightly higher than the ambient pressure.
1.6 CO2 Emission from Hot Blast Furnace
An iron-making blast furnace is usually equipped with several hot blast furnaces, with each hot blast furnace consisting of a combustion chamber, a regenerative chamber, a wind mixing chamber, and a variety of valves and corresponding pipes. The air required for the combustion of a hot blast furnace is provided by a combustion fan. According to the regulations of a hot blast furnace operating instruction, in the normal operating process of a hot blast furnace, a smothered furnace state is necessary between blowing-in and combustion operations. There is no direct transfer between the blowing-in and the combustion state. In short, the production cycle of a hot blast furnace should be combustion—stop—blowing-in—stop—combustion (Liu, 2016).
The combustion stage is also called a burning furnace stage. The aim is to heat hot blast furnace lattice bricks to a certain temperature to reserve heat by lattice bricks. The combustion fuel is mainly of blast furnace gas, mixture of blast furnace gas and coke oven, gas or mixture of blast furnace gas and CFG as well as combustion air. Those fuels and air are fed into hot furnace through the burner with a certain ratio between the fuels and the air. The fuels burn in the burner aided with air. The resulting gas is discharged from a flue outlet. At combustion stage, cold air inlet and hot air outlet are both in a closure state. After the combustion process (i.e., lattice bricks storage heat sufficiently), and the operation moved to the next air blowing-in stage.
At the stage of blowing-in, cold air is heated when fed into the blast furnace. The burner and the flue outlet are kept off, while cold air inlet and hot blast air outlet are open. With the heat exchange between cold air and lattice bricks, the temperature of the lattice bricks decreases. Finally, the operation is ceased, waiting for the combustion in the next round.
Because the ratio of air and fuel in the hot blast furnace is different and the inlet pressure and temperature of gas and air are also different, the ${\mathrm{{CO}}}_{2}$ content would be different in the flue gas of hot blast furnace. The residual ${\mathrm{O}}_{2}$ is also affected by air-fuel ratio. The general composition of hot blast flue gas is shown in Table 6. Although the hot blast flue gas produced by a single hot blast furnace is continuous, in the actual production process, the emission of flue gas at outlet of a chimney is approximately continuous as multiple hot blast furnaces share a flue gas discharge chimney.
Table 6 Composition of typical hot blast furnace flue gas
| Composition | ${\mathrm{{CO}}}_{2}$ | ${\mathrm{N}}_{2}$ | ${\mathrm{O}}_{2}$ | ${\mathrm{H}}_{2}\mathrm{O}$ | Dust $/\left( {\mathrm{{mg}}{\mathrm{m}}^{-3}}\right)$ |
| Vol% | 28.52 | 65.15 | 2.51 | 3.82 | 5 |
1.7 CO2 Emission from Power Generation Unit
The power plant in a steel/iron enterprise is to supply heat and electricity to meet iron/steel making demand. The power plant normally consumes the combustible gases produced during iron/steel making processes, including coke oven gas and blast furnace gas, to improve power supply reliability, to reduce power generation cost, and to contribute to energy conservation and environmental protection of iron/steel industry. The ${\mathrm{{CO}}}_{2}$ concentration of flue gas produced by power and heat generation processes in the power plant is a little low, being about 10-15%.
1.8 Summary of main ${\mathrm{{CO}}}_{2}$ sources in iron/steel industry
There are multiple ${\mathrm{{CO}}}_{2}$ emission sources with huge emissions in an integrated steel/iron plant. The different emission sources correspond to different production processes, thus have different emission characteristics. Among them, the ${\mathrm{{CO}}}_{2}$ content of flue gas of lime kiln, hot blast furnace gas, blast furnace gas and converter furnace gas is higher than that of post-combustion flue gas generated from a typical coal-fired power plant; while, the ${\mathrm{{CO}}}_{2}$ concentration of coke oven flue gas and the self-provided power plant could be lower than that of post-combustion flue gas from coal-fired power plant.
In terms of pressure, except that there is a higher pressure in blast furnace gas before TRT, the pressure of other emission sources is close to an atmospheric pressure. Regarding temperature, the flue gas from hot blast furnace normally has high temperature than other emission sources, thus heat recovery is desired before ${\mathrm{{CO}}}_{2}$ capture. As for discharge way, the discharge of LDG is intermittent, while others are continuously or approximately continuously discharged. Among all gas sources, LDG and BFG are both combustible. Their calorific value can be increased accordingly by capturing ${\mathrm{{CO}}}_{2}$ . In general, the different emission characteristics of ${\mathrm{{CO}}}_{2}$ enriched gases from iron/steel industry have influence on the technical and economic performance of different capture technologies.
2 Section 2
2.1 Carbon Capture Technologies for Steel/iron Industry
The technology development in China’s steel/iron industry is unbalanced, although the overall energy consumption is much higher than that of the international community. With the implementation of energy conservation technologies in China’s steel/iron industry, the energy consumption level of China’s large steel/iron companies is already close to that of international iron/steel enterprises. Therefore, the indirect emission reduction through energy conservation is more and more limited for those large enterprises, resulting in the emission reduction cost through energy conservation is getting higher and higher. It is economically hard for those large steel/iron companies to meet their long-term emission reduction target. As a large-scale ${\mathrm{{CO}}}_{2}$ emission reduction technology with great potential, carbon capture technology can be a cost-effective option to the indirect emission reduction technology. It can benefit large-scale enterprise by achieving a sustainable emission reduction target without changing its already established energy balance system. Therefore, carbon capture technology is increasingly recognized by large steel/iron enterprises in the world.
According to different ${\mathrm{{CO}}}_{2}$ sources, carbon capture technologies are generally categorized into three types: post-combustion capture, pre-combustion capture and oxyfuel combustion capture. Among them, the post-combustion capture refers to the capture of ${\mathrm{{CO}}}_{2}$ from the flue gas of fossil fuel combustion. According to the analysis in Sect. 1, the most of ${\mathrm{{CO}}}_{2}$ associated with steel/iron production is mainly from post-combustion flue gas, hence, this study focuses on the post-combustion capture technology for iron/steel industry. Based on different separation principles, the post-combustion capture can be further typed into absorption capture technology, adsorption capture technology, membrane capture technology, cryogenic capture technology, hydrate capture technology and mineral carbonation capture technology.
2.2 Absorption Capture Technology
Absorption capture or separation technology is a technology that uses absorbent solution to separate ${\mathrm{{CO}}}_{2}$ from mixed gases containing ${\mathrm{{CO}}}_{2}$ . It can be divided into physical absorption method and chemical absorption method (Li, 2014). The absorption technology has been widely used in chemical industry, oil refining, natural gas processing and other fields, and it is proved that it has the application prospect in steel/iron industry (IEA, 2010) (Fig. 2).
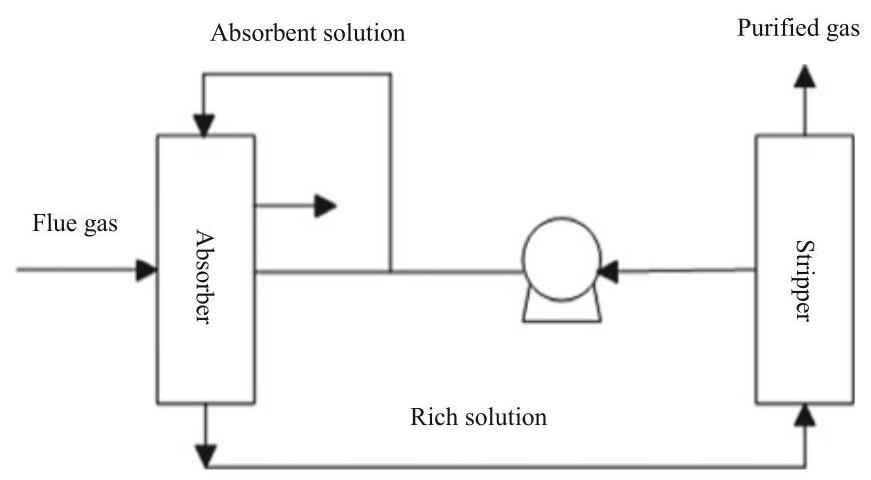
Fig. 2 Principle of chemical absorption method
The chemical absorption method refers to the use of alkaline chemical absorbent, such as ammonia, to absorb ${\mathrm{{CO}}}_{2}$ in a flue gas by chemical reaction and form unstable salt. Under a certain temperature and pressure condition, the salt can be decomposed in reverse to release ${\mathrm{{CO}}}_{2}$ , so as to achieve the aim that removing ${\mathrm{{CO}}}_{2}$ from the flue gas (Jiang,2015). At present, the typical chemical absorbents include mono ethanol amine (MEA), alkyl alcohol amine, ammonium hydroxide, hot potassium carbonate solution, etc. (Sun, 2009), the recovery rate of ${\mathrm{{CO}}}_{2}$ can reach 90%, the purity can reach above 99%.
The study of Gielen (2003) indicated that chemical absorption methods can be used to deal with blast furnace gas (BFG), Linz-Donawitz gas (LDG), and flue gas produced in the process of direct reduction and melting. Tseitlin et al. (1994) used a mono ethanol amine (MEA) solvent to separate ${\mathrm{{CO}}}_{2}$ from blast furnace gas. Tobiesen et al (2007) adopted different amine solvents to separate ${\mathrm{{CO}}}_{2}$ from blast furnace gas. In order to separate the ${\mathrm{{CO}}}_{2}$ with the concentration of 30% from hot blast furnace, Cheng et al (2010a) investigated the performance of different solvents. Yoon et al (2011) developed a potassium carbonate/cyclic diamine solvent to separate ${\mathrm{{CO}}}_{2}$ from the flue gas with concentration of 15-20% in the steel/iron industry.
In technology demonstration field, POSCO developed an ammonia absorption technology to separate ${\mathrm{{CO}}}_{2}$ form blast furnace gas. In order to reduce the cost of ${\mathrm{{CO}}}_{2}$ separation, a medium and low temperature waste heat from steel/iron mill was used as the desorption heat of ${\mathrm{{CO}}}_{2}$ (Kim et al.,2009). The first phase of a pilot project was completed in 2008 with processing capacity being ${50}{\mathrm{\;m}}^{3}/\mathrm{h}$ , ${\mathrm{{CO}}}_{2}$ recovery rate being above ${90}\%$ and ${\mathrm{{CO}}}_{2}$ volume fraction (concentration) being above ${95}\%$ . Base on phase one, the second phase of the pilot project was completed in 2011 with blast furnace gas processing capacity being expanded to ${1000}{\mathrm{\;m}}^{3}/\mathrm{h},{\mathrm{{CO}}}_{2}$ recovery rate being over ${90}\%$ , and the concentration of ${\mathrm{{CO}}}_{2}$ exceeding 99.5% (POSCO, 2013). In the project of COURSE50, in order to reach the target of 30% emission reduction, Japan New Energy Industrial Technology Development Organization (NEDO) commissioned the Nippon Steel & Sumitomo Metal and JEF to carry out relevant technology development under the support of the Japan Iron and Steel Federation (Li and Lu, 2009).
Nippon Steel & Sumitomo Metal developed ESCAP (energy conversation ${\mathrm{{CO}}}_{2}$ absorption process) low energy consumption ${\mathrm{{CO}}}_{2}$ separation process, which uses the developed new type of amine solvent (RN) to remove ${\mathrm{{CO}}}_{2}$ from blast furnace gas, the desorption heat is low temperature waste heat that has not been utilized in previous iron works (TNCSTEEL, 2015). The process required a low regeneration temperature, and the newly developed amine solvent is less corrosive to equipment and devices. For the combined use of the new type amine solvent RN and the waste heat recovery system, ${\mathrm{{CO}}}_{2}$ capture cost was expected to be almost 50% lower than that of MEA method (30%MEA) (Goto et al., 2013). Toshiba International Corp Pty Ltd/Toshiba Corporation in collaboration with Tongfang Environment Co. Ltd proposed an amine solvent absorption method to capture ${\mathrm{{CO}}}_{2}$ in the case of Shougang Jingtang steel plant in China.
The physical absorption method is the absorption of ${\mathrm{{CO}}}_{2}$ by means of physical dissolution. Its advantages include good absorption effect, low energy consumption and high separation recovery rate. Its disadvantages is that it is only suitable for flue gas with high ${\mathrm{{CO}}}_{2}$ content (Huang,2013). Therefore, for low ${\mathrm{{CO}}}_{2}$ content emission sources of steel/iron plant, the physical absorption method may not be technically feasible. The technologies developed by typical physical absorption method include Selexol™ system based on ethylene glycol and Rectisol® system based on methyl alcohol. The Selexol process can operate at an ambient temperature, while the Rectisol process operates as low as $- {60}^{ \circ }\mathrm{C}$ temperature condition. These systems have been applied in a large scale in the process of syngas purification and natural gas processing.
2.3 Adsorption Capture Technology
Adsorption capture technology is a technology that utilizes the selectivity of the solid adsorbent for ${\mathrm{{CO}}}_{2}$ and reversible adsorption to separate ${\mathrm{{CO}}}_{2}$ from mixed feed gases containing ${\mathrm{{CO}}}_{2}$ . The adsorbent adsorbs ${\mathrm{{CO}}}_{2}$ in a low temperature (or high pressure). The ${\mathrm{{CO}}}_{2}$ is de-adsorbed when temperature increasing (temperature swing adsorption, TSA), pressure reduction (pressure swing adsorption, PSA or vacuum pressure swing adsorption, VPSA) or imposing low voltage current (electricity swing adsorption, ESA). Through periodic changes of temperature (or pressure), the ${\mathrm{{CO}}}_{2}$ is separated from a gas stream (Han et al.,2009). Currently, pressure swing adsorption process (PSA and VPSA) is more widely applied than TSA (Kuramochi et al., 2011).
The basic principle of pressure swing adsorption (PSA) is that using the difference of adsorption properties of a kind of gas by a solid material and the characteristic that the adsorption capacity varies with pressure. Through a periodic pressure transformation process, the separation or capture of a kind of gas can be realized. The adsorbate adsorb a specific gas (such as ${\mathrm{{CO}}}_{2}$ ) at a higher pressure, then the desorbed by reducing pressure. The process of adsorption at high pressure and desorption at normal pressure is normally called pressure swing adsorption (PSA); the process of adsorption at normal pressure or slightly higher than normal pressure, and desorption through vacuum is called vacuum pressure swing adsorption (VPSA).
The performance of adsorbent determines the process and cost of pressure swing adsorption method. The pressure swing adsorption can use carbon-based adsorbent, zeolite and hydrotalcite-like compounds as the adsorbent and is widely applied in purification of hydrogen and ${\mathrm{{CO}}}_{2}$ . It can also be used to produce food grade ${\mathrm{{CO}}}_{2}$ , purification of $\mathrm{{CO}}$ , purification of natural gas, and oxygen and nitrogen separation.
In the project of COURSE50, JFE steel company developed a two-stage pressure swing adsorption method (zeolite adsorbents) to separate ${\mathrm{{CO}}}_{2}$ from blast furnace gas (Qi et al., 2013). The pilot system (ASCOA-3) was developed with ${\mathrm{{CO}}}_{2}$ processing capacity of $3\mathrm{t}/\mathrm{d}$ . The system separates the flue gas with ${\mathrm{{CO}}}_{2}$ concentration of ${33}\%$ , the recovery rate of ${\mathrm{{CO}}}_{2}$ reaching ${80}\%$ and the ${\mathrm{{CO}}}_{2}$ purity being 99%. In 2011, POSCO developed a pressure swing adsorption technology (PSA) technology to separate the mixture of $\mathrm{{CO}}$ and ${\mathrm{{CO}}}_{2}$ . A small pilot with processing capacity of $1{\mathrm{{Nm}}}^{3}/\mathrm{h}$ and the concentration of captured ${\mathrm{{CO}}}_{2}$ being over 99% was established (POSCO, 2013).
2.4 Membrane Capture Technology
Membrane capture technology can be typed into membrane separation method and membrane-absorption method (Guo et al., 2016). Membrane separation method separates mixed gases according to the difference in permeation selectivity of membrane materials for different gases. The driving force of membrane separation is the pressure difference on both sides of the membrane. The gas with high permeability preferentially passes through the membrane and form a permeating airflow. The gas with low permeability forms a residual airflow on the other side. Two streams are led respectively to achieve gases separation (Feron & Jansen, 2002). The ability of this method to separate ${\mathrm{{CO}}}_{2}$ mainly depends on the selectivity of membrane material for ${\mathrm{{CO}}}_{2}$ (Guo et al.,2016). The membrane materials for separation of ${\mathrm{{CO}}}_{2}$ are high polymer material, inorganic material, hybrid organic-inorganic materials etc. (Wang et al., 2016). The separation process can adopt a single-stage membrane separation or a multistage membrane separation process (Fig. 3).
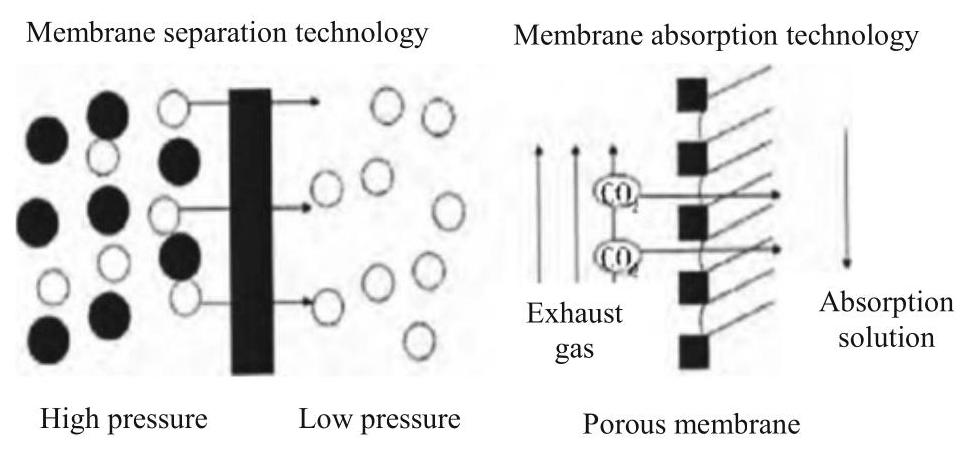
Fig. 3 Schematic principle of membrane separation ${\mathrm{{CO}}}_{2}$
The membrane absorption method is driven by the pressure difference on both sides of membrane, depending on adsorption capacity of each component of gas on the membrane surface and the differences in dissolution and diffusion in membrane (difference of permeation rate), to realize separation. There is no selectivity on the raw gas for membrane itself. The membrane only provides isolation for gas and absorption liquid. The gas and the liquid is not direct contact. They flow on both sides of the membrane (Gao et al., 2016). the absorbents play a key role in the selectivity for the composition. The membrane absorption method has overcome some weaknesses of traditional gas (or ${\mathrm{{CO}}}_{2}$ ) absorption methods. In the case of low ${\mathrm{{CO}}}_{2}$ partial pressure, this method has high selectivity and large separation driving force, which can be modularized for engineering design (Zhang & Shu, 2015).
Compared with a traditional tower absorber, membrane-absorption method can increase the contact area of gas and absorption solution, and overcome the entrainment phenomenon caused by the direct contact between two-phase of gas-liquid, it has the advantages, including stable mass transfer interface, large specific surface area, high mass transfer efficiency, low energy consumption, no bubble, no flooding, small equipment size, higher operation flexibility and easy maintenance (Gao et al., 2016).
Regarding the demonstration of membrane technologies, there was few demonstration projects had been carried out. Lie J. A. et al. tested the performance of three different types of membranes in capturing ${\mathrm{{CO}}}_{2}$ from the blast furnace gas (BFG). Australia ${\mathrm{{CO}}}_{2}\mathrm{{CRC}}$ project developed a new membrane separation technology, which is applied to separate ${\mathrm{{CO}}}_{2}$ for industry gases $\left( {{\mathrm{{CO}}}_{2}\mathrm{{CRC}}}\right)$ .
2.5 Cryogenic Distillation Capture Technology
Cryogenic separation technology refers to compression, liquefaction and distillation of a gas mixture at a low temperature and high pressure operating condition, according to different gas composition with different boiling points. ${\mathrm{{CO}}}_{2}$ could be removed and purified from a mixture gas under a certain temperature and pressure condition. The purity of extracted ${\mathrm{{CO}}}_{2}$ by this method is high, but it takes a lot of extra energy in the liquefaction and compression process (Xiao et al., 2012). In nature, the technology is mainly a gas liquefaction process. Normally, a flue gas is compressed and cooled until a phase change of ${\mathrm{{CO}}}_{2}$ , to achieve distillation purpose of separating ${\mathrm{{CO}}}_{2}$ from the flue gas. The advantage of cryogenic separation technology is that the technology can produce liquid ${\mathrm{{CO}}}_{2}$ directly for further transport by truck vehicle, thus avoid further compression and liquefaction of gaseous ${\mathrm{{CO}}}_{2}$ product; the disadvantage of such a technology are in two aspects: one is large energy consumption for cryogenic process, especially for low ${\mathrm{{CO}}}_{2}$ concentration gas stream; the second is blocking issue by water, which will become solid under low temperature. The technology could be more economical for high concentration of ${\mathrm{{CO}}}_{2}$ (above 60%) (Wang,2007).
The process flow of a cryogenic distillation capture unit is mainly divided into three parts: compression and cooling of feed gas, rectification separation and cryogenic distillation. Practically, a ${\mathrm{{CO}}}_{2}$ enriched feed gas stream is firstly compressed and cooled to about ${4.4}\mathrm{{Mpa}}$ and ${40}^{ \circ }\mathrm{C}$ , then sent to a cold tank for rectification purification. In the rectification tower, the light component is gradually gathered at the top of the tower, ${\mathrm{{CO}}}_{2}$ is gradually gathered in the tower bottom at high concentration. Finally, the high concentration ${\mathrm{{CO}}}_{2}$ is super cooled to $- {25}^{ \circ }\mathrm{C}$ and put into storage tanks with a liquid phase after throttling. The liquid ${\mathrm{{CO}}}_{2}$ is then delivered to a ${\mathrm{{CO}}}_{2}$ tank by charging pump, and transported to storage sites or utilization facilities by a vehicle. In the project of top gas recycle of blast furnace (TGRBF) under ULCOS program, ${\mathrm{{CO}}}_{2}$ was captured by pressure swing adsorption (PSA) method, followed by a cryogenic distillation technology to generate liquefied ${\mathrm{{CO}}}_{2}$ (Birat,2010).
2.6 Summary
For steel/iron industry, carbon capture technology is not only a large-scale ${\mathrm{{CO}}}_{2}$ emission reduction technology with great potential, but also the only technology that can facilitate a large-scale direct emission reduction for steel/iron. It can build the capacity of large-scale enterprises in dealing with sustainable emission reduction without changing their own energy balance system.
A large portion of ${\mathrm{{CO}}}_{2}$ associated with steel/iron production can be sourced from post-combustion flue gas. Correspondingly, post-combustion capture technologies, including absorption separation technology, adsorption separation technology, membrane separation technology, and cryogenic distillation technology can be suitable. Overall, among these technologies, the absorption method is the most mature. In particular, chemical absorption method has already been demonstrated by two large-scale commercial demonstration projects with capacity of one million tons per annum ${\mathrm{{CO}}}_{2}$ for each in coal-fired power generation industry.
The physical absorption method is demonstrated by commercial application in chemical industry very early. It is relatively mature in carbon capture applications. The membrane separation method is also widely used in gas separation industry. In a steel/iron production process, different kinds of capture technologies have different technical applicability and economic performance for different gas sources, as different emission sources have different characteristics. It is necessary to provide an insightful analysis on the technical applicability and economic performance of each capture method for each gas source based on different capture requirements.
3 Section 3
3.1 Techno-Economic Analysis of ${\mathrm{{CO}}}_{2}$ Capture from Different Sources
Absorption separation, adsorption separation, membrane separation, cryogenic distillation separation and other capture technologies all have their own features in terms of technology applicability and economic performance. Table 7 summarized the overall strength and weakness of each technology (Li, 2014; Han, 2009; Wang, 2016; Huang, 2008). In general, the ${\mathrm{{CO}}}_{2}$ concentration of each emission source in a steel/iron production process is low, thus physical absorption method is obviously unsuitable for its own use. a temperature swing adsorption method may not be suitable for large scale carbon capture because of a slow temperature change. As indicated in Sect. 3, because the composition, pressure and temperature properties of different emission sources in a steel production process are different, the technical and economic may be different when applied to different emission sources.
Table 7 Characteristics of ${\mathrm{{CO}}}_{2}$ separation technologies
| Technology | Suitable condition | Strength | Weakness | |
| Absorption | Chemical method | Low ${\mathrm{{CO}}}_{2}$ concentration gas source | High ${\mathrm{{CO}}}_{2}$ recovery rate; commercial demonstration available | Chemical process, produce secondary pollution |
| Physical method | High ${\mathrm{{CO}}}_{2}$ concentration gas source | High separation efficiency, low energy consumption | high content ${\mathrm{{CO}}}_{2}$ required | |
| Adsorption | Pressure swing adsorption | High ${\mathrm{{CO}}}_{2}$ concentration gas source | Less corrosion and environmental pollution, high ${\mathrm{{CO}}}_{2}$ recovery rate | Large land use, complex system |
| Temperature swing adsorption | High ${\mathrm{{CO}}}_{2}$ concentration gas source | Less corrosion and environmental pollution. high ${\mathrm{{CO}}}_{2}$ recovery rate | Slow temperature change, large land use, complex system |
(continued)
Table 7 (continued)
| Technology | Suitable condition | Strength | Weakness |
| Membrane separation | High ${\mathrm{{CO}}}_{2}$ concentration gas source | Small land use, simple system, easy operation and maintenance | High energy consumption, easy to be contaminated with particulate matter |
| Cryogenic distillation | High ${\mathrm{{CO}}}_{2}$ concentration gas source | Liquefaction ${\mathrm{{CO}}}_{2}$ can be obtained directly | High energy consumption, high investment, products can only be liquid |
In China, ${\mathrm{{CO}}}_{2}$ are classified into four different quality specifications, i.e. food grade, industrial grade, internal use, and storage grade. For a concise analysis in this study, industrial grade and food grade are grouped into an industrial grade above category, with ${\mathrm{{CO}}}_{2}$ concentration being greater than ${99.9}\%$ . The internal use require that ${\mathrm{{CO}}}_{2}$ concentration be greater than ${95}\%$ and ${\mathrm{O}}_{2},{\mathrm{H}}_{2}$ , and $\mathrm{{CO}}$ be less than ${0.5}\%$ ; while storage grade only expects the ${95}\%$ of ${\mathrm{{CO}}}_{2}$ . Capture scale can be divided into small scale (10,000 tons/year) and large scale (500,000 tons/year).
The captured ${\mathrm{{CO}}}_{2}$ has three different use purposes: internal use, large-scale external use by pipeline transportation and small-scale external use by tanker transportation. The internal use only needs to be pressurized to ${0.6}\mathrm{{Mpa}}$ to be delivered directly by an internal pipeline; the large-scale external use by pipeline transportation requires the ${\mathrm{{CO}}}_{2}$ be transported to designated locations on large scale in a supercritical/dense or a gaseous phase; the small scale external use by tanker requires the captured ${\mathrm{{CO}}}_{2}$ been transported in a liquid phase. Both different specification and different use requirements affect technical and economic assessment of carbon capture technologies.
In view of multiple options of capture methods, the technical assessment of a capture method is mainly measured from the perspective of applicability and maturity in ${\mathrm{{CO}}}_{2}$ capture field. The criterion can be benchmarked by three levels: good, average and bad. The economic assessment is mainly measured based on current capital cost and operating cost and potential capital cost and operating cost by year 2025, when is the end year of phase 1 of the Plan of China’s Coal Clean and High Efficiency Utilization Key Project in Facing 2030 Key Project Program (under developing). The operation time assumed to be ${8000}\mathrm{\;h}/$ year and the final ${\mathrm{{CO}}}_{2}$ product is in as gaseous at an atmospheric pressure and temperature of ${25}^{ \circ }\mathrm{C}$ .
3.2 Techno-Economic Analysis of ${\mathrm{{CO}}}_{2}$ Capture from Blast Furnace Gas
Taking a blast furnace gas (BFG) from a Chinese steel/iron mill as a case (Table 8), the content of combustible component CO accounts for about 21.8%, the content of ${\mathrm{{CO}}}_{2}$ and ${\mathrm{N}}_{2}$ are ${23.1}\%$ and 51.7% respectively. Pressure is ${206}\mathrm{{kPa}}$ (gauge pressure) and temperature is ${150}{}^{ \circ }\mathrm{C}$ . The particulate matter concentration in the gas stream is high containing saturated water moisture. The flue gas adopts a TRT system to recover energy in blast furnace gas. After TRT, pressure of the blast furnace gas is slightly higher than an atmospheric pressure, and the temperature is cooled to room temperature. The content of water is also reduced to a saturated level corresponding to the temperature and pressure. Therefore, there are two different gas sources for capture ${\mathrm{{CO}}}_{2}$ from the blast furnace gas, i.e., flue gases before TRT and after TRT, respectively.
3.2.1 Technical Performance
After dust removal and purification processes, the blast furnace gas before TRT still has a temperature of ${100}{}^{ \circ }\mathrm{C}$ and a pressure of 0.2-0.3 Mpa. If the purity of the captured ${\mathrm{{CO}}}_{2}$ is required to be industrial grade above for both internal and external uses, chemical absorption method is well technical suitable as it has advantages of high concentration of ${\mathrm{{CO}}}_{2}$ capture through selective absorption and desorption, easy removal of other impurities, and proved by large-scale demonstration project in power-generation industry. It is suitable for the capture of large-scale low concentration ${\mathrm{{CO}}}_{2}$ , but the capture process involves chemical process which is complex to iron/steel industry, and the safety and environmental protection requirements for use and storage of absorbent are high. For internal use of small-scale capture, the absorption method is also applicable.
The adsorption method can also be used to produce large-scale high concentration ${\mathrm{{CO}}}_{2}$ , however, requiring large land space. The small-scale capture by adsorption is more applicable, due to reduced land use space. In contrast, the cryogenic method is not applicable for ${\mathrm{{CO}}}_{2}$ capture for internal use, because the internal use ${\mathrm{{CO}}}_{2}$ can be delivered through an internal pipeline without liquefaction. With respect to the membrane separation method, it is difficult to guarantee a ${\mathrm{{CO}}}_{2}$ product quality of industrial grade above by membrane technology itself. hence, the applicability of technology only by membrane is poor. However, the combination of membrane separation method and adsorption method (PSA) can overcome the disadvantage of adsorption method (large land use), while ensuring a high quality product by adsorption method. Similarly, the integration of membrane separation with chemical absorption can also ensure a high quality ${\mathrm{{CO}}}_{2}$ product, but it is challenged by complex of membrane separation and chemical reaction process in one system.
Table 8 Composition of typical blast furnace gas in China
| Composition | ${\mathrm{{CO}}}_{2}$ | CO | ${\mathrm{H}}_{2}$ | ${\mathrm{N}}_{2}$ | ${\mathrm{O}}_{2}$ | ${\mathrm{H}}_{2}\mathrm{O}$ |
| Vol % | 23.1 | 21.8 | 3.2 | 51.7 | 0.2 | Saturation |
For external use of ${\mathrm{{CO}}}_{2}$ with industrial grade above, the demand is normally small. The captured ${\mathrm{{CO}}}_{2}$ needs to be pressurized and liquefied, and temporally stored in a high pressure and low-temperature storage tank. Then, it is transported to the designated site by a truck. Under this circumstance, except chemical absorption and pressure swing adsorption methods, cryogenic method can also be applied. The cryogenic method that combined with membrane separation or pressure swing adsorption can obtain liquefied ${\mathrm{{CO}}}_{2}$ products directly, leading to the improvement of applicability.
Overall, for internal use of food grade or industrial grade above ${\mathrm{{CO}}}_{2}$ , absorption method is a mature technology, thus more applicable than other methods without consideration of its environmental impacts; otherwise, the combination of membrane and adsorption technology is more suitable. For external use of food grade or industrial grade ${\mathrm{{CO}}}_{2}$ , the scale of project is usually small as market demand is limited. As truck transportation is preferred, membrane separation or pressure swing adsorption combined with cryogenic distillation is also applicable.
In the situation that the captured ${\mathrm{{CO}}}_{2}$ merely needs to meet requirements for general storage or internal use purposes ( ${\mathrm{{CO}}}_{2}$ concentration is greater than 95%) (Table 10), chemical absorption method is applicable, but the advantages are less obvious than other technologies. The applicability of pressure swing adsorption method will be improved due to the reduced requirements of ${\mathrm{{CO}}}_{2}$ product, especially for smaller scale, the disadvantage of land use is not so obvious. The use of cryogenic method depends mainly on whether the final ${\mathrm{{CO}}}_{2}$ product needs to be liquefied. Because the concentration requirement of ${\mathrm{{CO}}}_{2}$ product is low, membrane separation method becomes applicable. Through the integration of membrane separation and pressure swing adsorption methods, the weakness of large land use of pressure swing adsorption method will be overcome; integration of membrane and chemical absorption method can further enhance the applicability of absorption method, but the technology is still at early demonstration stage.
After the pressure energy of blast furnace gas is recovered by TRT, gas pressure drops slightly to environmental pressure level and temperature decreases to room temperature. Although the change of pressure will affect absorption, adsorption and membrane separation processes more or less. The effect on adsorption and membrane separation methods are slightly greater than that on absorption method, because the required pressure by adsorption and membrane separation is much higher than that of absorption method. Comparing before and after TRT, for membrane separation and pressure swing adsorption method, the main difference is that the investment of a compressor can be saved in the process as pressure of feed gas before TRT is high. Correspondingly, membrane separation and pressure swing adsorption methods are more suitable before TRT than after TRT.
To summarize, under low concentration requirement of ${\mathrm{{CO}}}_{2}$ products, the applicability of adsorption and membrane separation methods has been improved effectively, especially that of the membrane separation method as its weakness of producing high concentration ${\mathrm{{CO}}}_{2}$ is no longer exist. Further, if membrane separation and pressure swing adsorption are integrated, the applicability of the integrated technology may exceed the absorption method by year 2025, especially in the situation of small-scale ${\mathrm{{CO}}}_{2}$ capture project (Tables 9 and 10).
3.2.2 Economic Analysis
(a) Cost analysis
Because gas temperature and pressure are different before TRT and after TRT, the economic performance of each capture technology is also different before and after TRT. Under the case of capture rate of ${90}\%$ , Tables 11 and 12 respectively illustrate the economics performance of capture technologies for ${\mathrm{{CO}}}_{2}$ products with industrial grade above and storage grade from blast furnace gas before TRT.
For large-scale industrial grade ${\mathrm{{CO}}}_{2}$ before TRT, the economics of chemical absorption method is the best with current technology, especially the investment cost is significantly lower than that of other methods. However, investment cost of membrane separation method will decrease relatively quickly as it is under a quick development in China. It is estimated that by 2025, the investment cost of membrane-pressure swing adsorption integration method might be close to that of absorption method, due to a pressure of 0.2-0.3 Mpa before TRT can be utilized; meanwhile, its operating cost has obvious advantages over chemical absorption method. In the case of internal use only need 0.6 Mpa compression pressure for ${\mathrm{{CO}}}_{2}$ transportation, it is expected that by 2025, the cost of membrane-pressure swing adsorption method for blast furnace gas could be around $25-27. With the development of membrane absorption technology, its economic performance could keep up with that of chemical absorption method.
Table 9 Technical applicability of technologies for industrial grade ${\mathrm{{CO}}}_{2}$ from BFG prior to TRT
| Product requirement | Technology options | Applicability | Advantage | Disadvantage |
| Internal use | Chemical absorption | Good | Easy to produce high concentration of ${\mathrm{{CO}}}_{2}$ , mature technology, less energy loss in feed gas | Involves a chemical process, the system is complex, negative effect on environment |
| Pressure swing adsorption | Average | Can produce high concentration of ${\mathrm{{CO}}}_{2}$ , can use pressure of feed gas before TRT, easy to be modular developed | High pretreatment requirement, large land use and unit size, complex system | |
| Membrane separation | Bad | N/A | Difficult to obtain high purity ${\mathrm{{CO}}}_{2}$ products alone | |
| Cryogenic distillation | Bad | N/A | Product of is in liquid state, not suitable for internal use | |
| Membrane-absorption integration | Average | Can guarantee high concentration of ${\mathrm{{CO}}}_{2}$ ; can reduce land use | Involves integration of membrane and chemical absorption; complex system, and negative impacts on environment; immature technology | |
| Membrane-adsorption integration | Good | Can produce high concentration ${\mathrm{{CO}}}_{2}$ ; reduced land use and facility size; enhanced system stability | Involves two processes of membrane and PSA and their integration: system is complex | |
| Membrane—cryogenic integration | Bad | N/A | Product of is in liquid state, not suitable for internal use |
(continued)
Table 9 (continued)
| Product requirement | Technology options | Applicability | Advantage | Disadvantage |
| External use | Chemical absorption | Good | Easy to produce high concentration of ${\mathrm{{CO}}}_{2}$ , mature technology, less energy loss in feed gas | Involves a chemical process, the system is complex, negative effect on environment |
| Pressure swing adsorption | Average | Can produce high concentration of ${\mathrm{{CO}}}_{2}$ , can use pressure of BFG before TRT, easy to be modular developed; reduced land use and unit size | High pretreatment requirement, complex system | |
| Membrane separation | Bad | N/A | Difficult to obtain high purity ${\mathrm{{CO}}}_{2}$ products alone | |
| Cryogenic distillation | Average | Product in liquid state, it is suitable for tanker transportation | Large land use and unit size | |
| Membrane—absorption integration | Average | Can guarantee high concentration of ${\mathrm{{CO}}}_{2}$ ; can reduce land use | Involves integration of membrane and chemical absorption; complex system, and negative impacts on environment: immature technology | |
| Membrane—adsorption integration | Good | Can produce high concentration ${\mathrm{{CO}}}_{2}$ ; reduced land use and facility size; enhanced system stability | Involves two processes of membrane and PSA and their integration: system is complex | |
| Membrane—cryogenic integration | Good | Product in liquid state, suitable for truck transportation | Involves two processes of membrane and cryogenic separation and their integration: system is complex |
Table 10 Technical applicability of technologies for storage Grade ${\mathrm{{CO}}}_{2}$ from BFG prior to TRT
| Product requirement | Technology options | Applicability | Advantage | Disadvantage |
| Internal use | Chemical absorption | Good | Easy to produce high concentration of ${\mathrm{{CO}}}_{2}$ , mature technology, less energy loss in feed gas | Involves a chemical process, the system is complex, negative effect on environment |
| Pressure swing adsorption | Average | Can produce high concentration of ${\mathrm{{CO}}}_{2}$ , can use pressure of feed gas before TRT, easy to be modular developed | High pretreatment requirement. large land use and unit size, complex system | |
| Membrane separation | Good | Can produce storage grade ${\mathrm{{CO}}}_{2}$ , land use is small; system is simple; easy to modular development | Lack of project demonstration, rely on membrane development | |
| Cryogenic distillation | Bad | Product of is in liquid state, not suitable for internal use | N/A | |
| Membrane-absorption integration | Average | Can guarantee high concentration of ${\mathrm{{CO}}}_{2}$ ; can reduce land use | Involves integration of membrane and chemical absorption; complex system, and negative impacts on environment; immature technology | |
| Membrane-adsorption Good integration | Can produce high concentration ${\mathrm{{CO}}}_{2}$ ; reduced land use and facility size; enhanced system stability | Involves two processes of membrane and PSA and their integration; system is complex |
(continued)
Table 10 (continued)
| Product requirement | Technology options | Applicability | Advantage | Disadvantage |
| External use | Membrane—cryogenic integration | Bad | Product of is in liquid state, not suitable for internal use | N/A |
| Chemical absorption | Good | Easy to produce high concentration of ${\mathrm{{CO}}}_{2}$ , mature technology, less energy loss in feed gas | Involves a chemical process. the system is complex, negative effect on environment | |
| Pressure swing adsorption | Good | Can produce high concentration of ${\mathrm{{CO}}}_{2}$ , can use pressure of BFG before TRT, easy to be modular developed; reduced land use and unit size | High pretreatment requirement, complex system | |
| Membrane separation | Good | Can produce storage grade ${\mathrm{{CO}}}_{2}$ , land use is small; system is simple; easy to modular development | Lack of project demonstration, rely on membrane development | |
| Cryogenic distillation | Average | Product in liquid state, it is suitable for tanker transportation | Large land use and unit size | |
| Membrane-absorption integration | Average | Can guarantee high concentration of ${\mathrm{{CO}}}_{2}$ ; can reduce land use | Involves integration of membrane and chemical absorption; complex system, and negative impacts on environment; immature technology |
(continued)
Table 10 (continued)
| Product requirement | Technology options | Applicability | Advantage | Disadvantage |
| Membrane—adsorption integration | Good | Can produce high concentration ${\mathrm{{CO}}}_{2}$ ; reduced land use and facility size; enhanced system stability | Involves two processes of membrane and PSA and their integration; system is complex | |
| Membrane—cryogenic integration | Good | Product in liquid state, suitable for truck transportation | Involves two processes of membrane and cryogenic separation and their integration; system is complex |
Table 11 Economic performance of technologies for industrial grade above ${\mathrm{{CO}}}_{2}$ capture from BFG before TRT (at capture rate of 90%)
| Scale | Technology options | Investment cost (million \$) | Operating cost (\$/tonne) | Investment cost by 2025 (million \$) | Operating cost by 2025 (\$/tonne) |
| Large scale (1.0 mtpa) | Chemical absorption | 90-110 | 30-33 | 85–105 | 28-31 |
| PSA | 110-130 | 29-31 | 90–110 | 27-29 | |
| Membrane—absorption | 100-120 | 30-33 | 90-110 | 28-31 | |
| Membrane-PSAintegration | 120-140 | 28-30 | 90-110 | 25-27 | |
| Small scale (0.1 mtpa) | Chemical absorption | 11–13 | 30-33 | 10-12 | 28-31 |
| PSA | 12-14 | 29-31 | 11–13 | 27-29 | |
| Membrane-absorption | 11-13 | 30-33 | 10–12 | 28-31 | |
| Membrane-PSAintegration | 13-15 | 28-30 | 10–12 | 25-27 |
For storage grade ${\mathrm{{CO}}}_{2}$ , compare to other methods, the advantages of chemical absorption method will be lessened. ${\mathrm{{CO}}}_{2}$ purity requirement has little influence on chemical absorption method in terms of either investment cost or operating cost; while pressure swing adsorption method and membrane separation method are sensitive to product requirements. It is very difficult especially for membrane separation method to satisfy technical requirements of high concentration ${\mathrm{{CO}}}_{2}$ . When the purity requirement is reduced, it is technically feasible for membrane separation method. With the funding support of “membrane method capture ${\mathrm{{CO}}}_{2}$ technology and industrial demonstration project” under the “coal clean and efficient utilization and new energy conversation technology” by Ministry of Science and Technology of China in 2017, it is believed that R&D of membrane technology would be accelerated in the next 5 years. It is expected that by 2025, the investment cost of large-scale capture by membrane technology may be just a little bit higher than that of chemical absorption method. The investment cost and operating cost of membrane integrated with pressure swing adsorption technology would be highly possible less than that of chemical absorption method.
| Table 12 | ||||||
| Scale | Technology options | Investment cost (million \$) | Operating cost (\$/tonne) | Investment cost by 2025 (million \$) | Operating cost by 2025 (\$/tonne) | Main changes compared with industrial grade above before TRT |
| Large scale (1.0 mtpa) | Chemical absorption | 90-110 | 30-33 | 85–105 | 28-31 | Investment and operation costs of chemical absorption method are not sensitive to the requirement of ${\mathrm{{CO}}}_{2}$ products |
| PSA | 105-125 | 28-30 | 100-120 | 26-28 | Decrease of ${\mathrm{{CO}}}_{2}$ product concentration requirement, lead to the reduction of investment and operating costs | |
(continued)
Table 12 (continued)
| Scale | Technology options | Investment cost (million \$) | Operating cost (\$/tonne) | Investment cost by 2025 (million \$) | Operating cost by 2025 (\$/tonne) | Main changes compared with industrial grade above before TRT |
| Membrane separation | 115-135 | 30-32 | 100-125 | 26-28 | Membrane separation technology become feasible with reduced ${\mathrm{{CO}}}_{2}$ product requirement; investment cost and operating cost of the membrane reduce significantly | |
| Membrane absorption | 100-120 | 30-33 | 90-110 | 28-31 | Investment and operation costs of chemical absorption method are not sensitive to the requirement of ${\mathrm{{CO}}}_{2}$ products |
(continued)
Table 12 (continued)
| Scale | Technology options | Investment cost (million \$) | Operating cost (\$/tonne) | Investment cost by 2025 (million \$) | Operating cost by 2025 (\$/tonne) | Main changes compared with industrial grade above before TRT |
| Membrane—PSA integration | 110-130 | 27-29 | 80-100 | 24-26 | Decrease of ${\mathrm{{CO}}}_{2}$ product concentration requirement, lead to a significant reduction of investment and operating costs of membrane separation—PSA | |
| Small scale ( 0.1 mtpa) | Chemical absorption | 11-13 | 30-33 | 10-12 | 28-31 | Investment and operation costs of chemical absorption method are not sensitive to the requirement of ${\mathrm{{CO}}}_{2}$ products |
(continued)
Table 12 (continued)
| Scale | Technology options | Investment cost (million \$) | Operating cost (\$/tonne) | Investment cost by 2025 (million \$) | Operating cost by 2025 (\$/tonne) | Main changes compared with industrial grade above before TRT |
| Pressure swing adsorption | 11.5-13.5 | 28-30 | 10.5-12.5 | 26-28 | Decrease of ${\mathrm{{CO}}}_{2}$ product concentration requirement, lead to the reduction of investment and operating costs | |
| Membrane separation | 12-14 | 30-32 | 10.5-12.5 | 26-28 | Membrane separation technology become feasible with reduced ${\mathrm{{CO}}}_{2}$ product requirement; investment cost and operating cost of the membrane reduce significantly |
(continued)
Table 12 (continued)
| Scale | Technology options | Investment cost (million \$) | Operating cost (\$/tonne) | Investment cost by 2025 (million \$) | Operating cost by 2025 (\$/tonne) | Main changes compared with industrial grade above before TRT |
| Membrane absorption | 11-13 | 30-33 | 10-12 | 28-31 | Investment and operation costs of chemical absorption method are not sensitive to the requirement of ${\mathrm{{CO}}}_{2}$ products | |
| Membrane separation—pressure swing adsorption | 12-14 | 27-29 | 9.5-11.5 | 24-26 | Decrease of ${\mathrm{{CO}}}_{2}$ product concentration requirement, lead to a significant reduction of investment and operating costs of membrane separation—PSA |
Before TRT, as the feed gas contains high pressure, the advantage of this high pressure on membrane separation and pressure swing adsorption method is far superior to the chemical absorption method. One direct benefit is that a large-scale compressor for pressurized feed gas can be saved; in the case of after TRT, the investment of the compressor is necessary. The investment cost of a compressor is considerable due to the high volume of feed gas (Table 21).
Accordingly, the investment cost of pressure swing adsorption method, membrane separation method and membrane-pressure swing adsorption method after TRT is much higher than that of chemical absorption method. Even if after 2025, the investment cost of membrane separation and pressure swing adsorption methods after TRT is still significantly greater than that of chemical absorption method. Nevertheless, for the operating cost of membrane separation and pressure swing adsorption method, in view that the pressure energy in non- ${\mathrm{{CO}}}_{2}$ airflow can be recycled through the existing TRT system, their operating cost won’t be in disadvantageous position compared to chemical absorption method, especially after 2025.
For small scale capture of 100,000 tons/year, the investment cost of membrane separation and pressure swing adsorption technologies before and after TRT are different. The main reason is a high cost associated with a compressor after TRT. The difference of investment cost for chemical absorption method before and after TRT is very small. Hence, for small scale capture after TRT, the economic performance of membrane separation and pressure swing adsorption is far poorer than that of chemical absorption method; while the economics before TRT is just a little inferior to that of chemical absorption method (Tables 13 and 14).
Table 13 Economic performance of technologies for industrial grade ${\mathrm{{CO}}}_{2}$ capture from BFG after TRT (capture rate of 90%)
| Scale | Technology options | Investment cost (million \$) | Operating cost (\$/tonne) | Investment cost by 2025 (million \$) | Operating cost by 2025 (\$/tonne) | Main changes between prior to TRT and after TRT |
| Large scale (1.0 mtpa) | Chemical absorption | 90-110 | 30-33 | 85–105 | 28-31 | Investment and operating costs are unchanged |
| PSA | 125-145 | 30-32 | 105-115 | 28-30 | Compressor is added, leading to rise of investment and operating costs significantly | |
| Membrane-absorption | 90-110 | 30-33 | 85–105 | 28-31 | Investment and operating costs are unchanged | |
| Membrane-PSA integration | 135-155 | 29-31 | 115-135 | 26-28 | Compressor is added, leading to rise of investment and operating costs significantly | |
| Small scale (0.1 mtpa) | Chemical absorption | 11-13 | 30-33 | 10-12 | 28-31 | Investment and operating costs are unchanged |
(continued)
Table 13 (continued)
| Scale | Technology options | Investment cost (million \$) | Operating cost (\$/tonne) | Investment cost by 2025 (million \$) | Operating cost by 2025 (\$/tonne) | Main changes between prior to TRT and after TRT |
| PSA | 14.5-16.5 | 30-32 | 13.5-15.5 | 28-30 | Compressor is added, leading to rise of investment and operating costs significantly | |
| Membrane—absorption | 11-13 | 30-33 | 10-12 | 28-31 | Investment and operating costs are unchanged | |
| Membrane-PSA integration | 15.5-17.5 | 29-31 | 12.5-14.5 | 26-28 | Compressor is added, leading to rise of investment and operating costs significantly |
Table 14 Economic of capture ${\mathrm{{CO}}}_{2}$ of storage grade from BFG before TRT (90% capture rate)
| 0 | ||||||
| Scale | Technology options | Investment cost (million \$) | Operating cost (\$/ton) | Investment cost by 2025 (million \$) | Operating cost by 2025 (\$/ton) | Main changes between prior to and after TRT |
| Large scale (1.0 mtpa) | Chemical absorption | 90-110 | 30-33 | 85–105 | 28-31 | Investment and operating costs are unchanged |
| Pressure swing adsorption | 130-150 | 29-31 | 110-130 | 27-29 | Compressor is added, leading to rise of investment and operating costs significantly | |
| Membrane separation | 130-150 | 31-33 | 115-135 | 27-29 | Compressor is added, the investment cost and operating cost rise significantly | |
| Membrane absorption | 100-120 | 30-33 | 90-110 | 28-31 | Investment cost and operating cost are unchanged | |
| Membrane separation—pressure swing adsorption | 125-145 | 28-30 | 95-105 | 25-27 | Compressor is added, leading to rise of investment and operating costs significantly | |
(continued)
Table 14 (continued)
| Scale | Technology options | Investment cost (million \$) | Operating cost (\$/ton) | Investment cost by 2025 (million \$) | Operating cost by 2025 (\$/ton) | Main changes between prior to and after TRT |
| Small scale ( 0.1 mtpa) | Chemical absorption | 11-13 | 30-33 | 10-12 | 28-31 | Investment and operating costs are unchanged |
| Pressure swing adsorption | 14-16 | 29-31 | 13-15 | 27-29 | Compressor is added, leading to rise of investment and operating costs significantly | |
| Membrane separation | 14.5-16.5 | 31-33 | 12.5-14.5 | 27-29 | Compressor is added, leading to rise of investment and operating costs significantly | |
| Membrane absorption | 11-13 | 30-33 | 10-12 | 28-31 | Investment cost and operating cost are unchanged | |
| Membrane separation—pressure swing adsorption | 14.5-16.5 | 28-30 | 12-14 | 25-27 | Compressor is added, leading to rise of investment and operating costs significantly |
(b) Benefit analysis
On the one hand, capturing ${\mathrm{{CO}}}_{2}$ from blast furnace gas (BFG) can reduce emission ${\mathrm{{CO}}}_{2}$ , while the captured ${\mathrm{{CO}}}_{2}$ can be used to place nitrogen in iron/steel making processes; on the other hand, removal of ${\mathrm{{CO}}}_{2}$ from BFG will increase the calorific value of BFG. In case that ${\mathrm{{CO}}}_{2}$ is used to replace nitrogen. Supposing one cubic meter of ${\mathrm{{CO}}}_{2}$ is equivalent to one cubic meter of nitrogen, the benefit of one ton ${\mathrm{{CO}}}_{2}$ is about US$15.0/ton when internal price of nitrogen is US$0.03 $/{\mathrm{m}}^{3}$ . If the captured ${\mathrm{{CO}}}_{2}$ can be sold to oil companies for enhancing oil recovery, the price of ${\mathrm{{CO}}}_{2}$ can reach US$20/ton in China. In fact, when ${\mathrm{{CO}}}_{2}$ concentration meets industrial grade or food grade requirements, market sale price can be as high as US$60.0/ ton.
Because of its low calorific value of raw BFG, before ${\mathrm{{CO}}}_{2}$ removal, BFG needs to be mixed with coke oven gas which has high calorific value. Take a mixing ratio of 9:1 as an example, (i.e., nine blast furnace gases mix with one coke oven gas). Based on a case of Chinese iron/steel plant, the unit price of blast furnace gas (BFG) and coke oven gas (COG) is assumed to be US$0.02/Nm ${}^{3}$ , respectively. Consequently, the unit price of original gas mixture will be US$0.046/Nm3. The benefit of blast furnace gas with ${\mathrm{{CO}}}_{2}$ removal is mainly due to the rise of its calorific value in response to the reduced use of coke oven gas. Under different capture rate, the extent of ${\mathrm{{CO}}}_{2}$ removal is different, thus the extent of calorific value increase is also different. Accordingly, the ratio requirement between blast furnace gas and coke oven gas is also different, leading to the cost of mixed gas is also different. The unit cost and benefit of mixed gas with ${\mathrm{{CO}}}_{2}$ removal are shown in Table 15. It is indicated that the higher the capture rate, the more the calorific value increases, the higher the benefit.
Although more ${\mathrm{{CO}}}_{2}$ can be removed with high capture rate, resulting in the rise of the combustion calorific value of blast furnace gas, both investment cost and operating cost of capture technologies may be more expensive under high capture rate. For chemical absorption method, it is easy to achieve 90% capture rate, while for membrane separation and PSA methods, when capture rate reaches 90%, the investment cost and operating cost could be very high. In case that the capture rate is reduced to 85%, the investment cost and operating cost of membrane separation and PSA methods could be significantly reduced. Therefore, it is necessary to comprehensively justify the costs and the benefits of ${\mathrm{{CO}}}_{2}$ based on a real specific business case,
Table 15 Caloric value benefit of ${\mathrm{{CO}}}_{2}$ capture from BFG under different capture rate
| Item | Capture rate (%) | BFG proportion | COG proportion | Original cost of mixed gas at ratio of 9:1 of BFG and COG (US\$/Nm3) | Unit cost of mixed gas after ${\mathrm{{CO}}}_{2}$ removal (US\$/Nm3) | Benefit of ${\mathrm{{CO}}}_{2}$ capture from BFG (US\$/Nm3) |
| 1 | 100 | 0.988 | 0.012 | 0.046 | 0.023 | 0.023 |
| 2 | 95 | 0.984 | 0.016 | 0.046 | 0.024 | 0.022 |
| 3 | 90 | 0.98 | 0.02 | 0.046 | 0.025 | 0.021 |
| 4 | 85 | 0.976 | 0.024 | 0.046 | 0.026 | 0.020 |
| 5 | 80 | 0.973 | 0.027 | 0.046 | 0.027 | 0.019 |
| 6 | 70 | 0.966 | 0.034 | 0.046 | 0.029 | 0.017 |
| 7 | 60 | 0.959 | 0.041 | 0.046 | 0.031 | 0.15 |
3.3 Techno-Economic Analysis of ${\mathrm{{CO}}}_{2}$ Capture from Lime Kiln Flue Gas
3.3.1 Technical Performance
The ${\mathrm{{CO}}}_{2}$ in lime kiln flue gas is directly sourced from the calcination of lime. The composition of lime kiln flue gas is similar to that of coal-fired power generation flue gas. ${\mathrm{{CO}}}_{2}$ concentration is about ${15} - {20}\%$ in lime kiln flue gas, which is only a little higher than 11-15% concentration of flue gas of coal-fired power plant, therefore, most of the methods and processes of post-combustion ${\mathrm{{CO}}}_{2}$ capture used by coal-fired power plant basically can be used as a reference to ${\mathrm{{CO}}}_{2}$ capture from lime kiln flue gas by iron/steel industry.
Tables 16 and 17 show the technical performance of capture methods for lime kiln flue gas. Compared to blast furnace gas, the ${\mathrm{{CO}}}_{2}$ concentration of lime kiln flue gas is slightly lower; thus, applicability of chemical absorption method for capturing industrial grade above ${\mathrm{{CO}}}_{2}$ is further improved compared to PSA and membrane separation methods. For the capture of storage grade ${\mathrm{{CO}}}_{2}$ , due to the lack of hydrogen and other impurities in lime kiln flue gas, the applicability of membrane separation ${\mathrm{{CO}}}_{2}$ could also be improved, however, the applicability is still at an average level due to the low ${\mathrm{{CO}}}_{2}$ concentration in flue gas. The cryogenic method could be more applicable in case that ${\mathrm{{CO}}}_{2}$ product is required to be transported in liquid phase.
Table 16 Technical performance of capture methods for industrial grade ${\mathrm{{CO}}}_{2}$ from LKFG
| Product requirement | Technology options | Applicability | Advantage | Disadvantages |
| Internal use | Chemical absorption | Good | Capable of producing high concentration ${\mathrm{{CO}}}_{2}$ , mature technology | Involves chemical process, complex system and negative effect on environment |
| Pressure swing adsorption | Average | Can produce high concentration of ${\mathrm{{CO}}}_{2}$ ; can be modularly developed | High pretreatment requirement, large land use and unit size, complex system | |
| Membrane separation | Bad | N/A | Poor system reliability, lack of technology demonstration; difficulty to produce high concentration ${\mathrm{{CO}}}_{2}$ | |
| Cryogenic distillation | Bad | N/A | Product of is in liquid state, not suitable for internal use | |
| Membrane—absorption integration | Average | Can guarantee high concentration of ${\mathrm{{CO}}}_{2}$ ; can reduce land use | Involves integration of membrane and chemical absorption; complex system, and negative impacts on environment; immature technology | |
| Membrane-adsorption Go integration | Good | Can produce high concentration ${\mathrm{{CO}}}_{2}$ ; reduced land use and facility size; enhanced system reliability | Involves two processes of membrane and PSA and their integration; system is complex |
(continued)
Table 16 (continued)
| Product requirement | Technology options | Applicability | Advantage | Disadvantages |
| External use | Membrane—cryogenic integration | Bad | N/A | Product of is in liquid state, not suitable for internal use |
| Chemical absorption | Good | Capable of producing high concentration ${\mathrm{{CO}}}_{2}$ , mature technology | Involves a chemical process, the system is complex, negative effect on environment | |
| Pressure swing adsorption | Average | Can produce high concentration of ${\mathrm{{CO}}}_{2}$ ; can be modularly developed | High pretreatment requirement, large land use and unit size, complex system | |
| Membrane separation | Bad | N/A | Poor system reliability, difficult to obtain high purity ${\mathrm{{CO}}}_{2}$ products alone | |
| Cryogenic distillation | Bad | N/A | ${\mathrm{{CO}}}_{2}$ concentration is too low | |
| Membrane—absorption integration | Average | Can guarantee high concentration of ${\mathrm{{CO}}}_{2}$ ; can reduce land use | Involves integration of membrane and chemical absorption; complex system, and negative impacts on environment; immature technology | |
| Membrane-adsorption Goo integration | Can produce high concentration ${\mathrm{{CO}}}_{2}$ ; reduced land use and facility size; enhanced system stability | Involves two processes of membrane and PSA and their integration; system is complex |
(continued)
Table 16 (continued)
| Product requirement | Technology options | Applicability | Advantage | Disadvantages |
| Membrane—cryogenic integration | Good | Product of is in liquid state, suitable for external use by small scale | Not suitable for pipeline transportation in super-critical phase |
Compared to blast furnace gas, another difference is that the nitrogen composition in lime kiln feed gas is high. After the pressurized feed gas pass through membrane or adsorption adsorbents, the nitrogen content in the gas stream is increased due to removal of ${\mathrm{{CO}}}_{2}$ . Without further pressurized, the gas stream with higher nitrogen content can directly generate high purity nitrogen by other nitrogen separation technologies such as membrane and thus produce nitrogen byproduct with low costs. Regarding to chemical absorption method, the separation of nitrogen from gas stream still requires additional pressure and pretreatment. From the perspective of technical maturity, a 100 kilo tonnes per year demonstration project by PSA technology for capturing ${\mathrm{{CO}}}_{2}$ from lime kiln flue gas was carried out by Shougang Jingtang steel plant located in Tangshan, China.
Although there is no demonstration projected reported on chemical absorption method, it can be directly applied to lime kiln flue gas with no doubt as it plenty of experience of post-combustion capture demonstration in coal-fired power plant which can certainly referred. Currently membrane separation method lacks technical demonstration, so the maturity of this technology is poor. However, with the accomplishment of the MOST funded “membrane method capture ${\mathrm{{CO}}}_{2}$ technology and industrial demonstration project” under the “coal clean and efficient utilization and new energy conversation technology” by 2022. It can be reasonably estimated that the maturity of membrane method could have a significant improvement by year 2025.
3.3.2 Economic Analysis
Comparatively, because the ${\mathrm{{CO}}}_{2}$ concentration in lime kiln flue gas is slightly higher than in coal-fired power generation flue gas, investment and operating costs of the corresponding technology are slightly lower than post-combustion ${\mathrm{{CO}}}_{2}$ capture in the coal-fired power plant, while also lower than capture technologies applicable to blast furnace gas capture. When considering nitrogen recovery, the investment cost will increase more. Tables 18 and 19 give the economic performance of ${\mathrm{{CO}}}_{2}$ products by industrial above grade and storage grade, respectively.
Table 17 Technical performance of capture methods for storage grade ${\mathrm{{CO}}}_{2}$ from LKFG
| Product requirement | Technology options | Applicability | Advantage | Disadvantages |
| Internal use | Chemical absorption | Good | Capable of producing high concentration ${\mathrm{{CO}}}_{2}$ , mature technology | Involves chemical process, complex system and negative effect on environment |
| Pressure swing adsorption | Average | Can produce high concentration of ${\mathrm{{CO}}}_{2}$ and can be modularly developed | High pretreatment requirement, large land use and unit size, complex system | |
| Membrane separation | Average | Can produce storage grade ${\mathrm{{CO}}}_{2}$ and can be modularly developed | Poor system reliability, lack of technology demonstration | |
| Cryogenic distillation | Bad | N/A | Product of is in liquid state, not suitable for internal use | |
| Membrane—absorption integration | Average | Can guarantee high concentration of ${\mathrm{{CO}}}_{2}$ ; can reduce land use | Involves integration of membrane and chemical absorption; complex system, and negative impacts on environment; immature technology | |
| Membrane—adsorption integration | Good | Can produce high concentration ${\mathrm{{CO}}}_{2}$ ; reduced land use and facility size; enhanced system stability | Involves two processes of membrane and PSA and their integration; system is complex | |
| Membrane—cryogenic integration | Bad | N/A | Product of is in liquid state, not suitable for internal use |
(continued)
Table 17 (continued)
| Product requirement | Technology options | Applicability | Advantage | Disadvantages |
| External use | Chemical absorption | Good | Capable of producing high concentration ${\mathrm{{CO}}}_{2}$ , mature technology | Involves chemical process, complex system and negative effect on environment |
| Pressure swing adsorption | Average | Can produce high concentration of ${\mathrm{{CO}}}_{2}$ and can be modularly developed | High pretreatment requirement, large land use and unit size, complex system | |
| Membrane separation | Average | Can produce storage grade ${\mathrm{{CO}}}_{2}$ and can be modularly developed | Poor system reliability, lack of technology demonstration | |
| Cryogenic distillation | Bad | N/A | ${\mathrm{{CO}}}_{2}$ concentration is too low | |
| Membrane—absorption integration | Average | Can guarantee high concentration of ${\mathrm{{CO}}}_{2}$ ; can reduce land use | Involves integration of membrane and chemical absorption; complex system, and negative impacts on environment; immature technology | |
| Membrane—adsorption integration | Good | Can produce high concentration ${\mathrm{{CO}}}_{2}$ ; reduced land use and facility size; enhanced system stability | Involves two processes of membrane and PSA and their integration; system is complex | |
| Membrane—cryogenic integration | Good | Product of is in liquid state, suitable for external use by small scale | Not suitable for pipeline transportation in super-critical phase |
For the capture of industrial grade above ${\mathrm{{CO}}}_{2}$ , the investment cost of chemical absorption method is far below that of pressure swing adsorption and other methods; even by 2025, it is still the case. For operating cost, chemical absorption method is lower than that of other methods under current technical condition, however, it might be at the same level as other methods by 2025. Because membrane method and pressure swing adsorption method are easy to produce high purity nitrogen as a by-product, the economics of membrane and pressure swing adsorption methods can be greatly improved, and can probably be higher than chemical absorption method, when this nitrogen benefit is included, At an internal price of nitrogen being USD0.03/Nm ${}^{3}$ , the benefit of nitrogen product could be as high as USD22.0/tonne. Take a lime kiln flue gas with ${17}\% {\mathrm{{CO}}}_{2}$ and ${72}\%$ nitrogen as an example, capture one tonne ${\mathrm{{CO}}}_{2}$ can generate about $53 of nitrogen benefit under scenario of ${\mathrm{{CO}}}_{2}$ capture rate being ${90}\%$ , and nitrogen capture rate being 80%.
Table 18 Economic performance of technologies for industrial grade from LKFG (at capture rate of 90%)
| Scale | Technology options | Investment cost (million \$) | Operating cost (\$/ton) | Investment cost by 2025 (million \$) | Operating cost by 2025 (\$/ton) |
| Large scale (1.0 mtpa) | Chemical absorption | 100-120 | 32-35 | 95-115 | 30-33 |
| PSA | 140-160 | 33-35 | 120-140 | 30-33 | |
| PSA & ${\mathrm{N}}_{2}$ recovery | 150-170 | 36-38 | 140-160 | 33-35 | |
| Membrane absorption | 100-120 | 32-35 | 95-115 | 30-33 | |
| Membrane-PSA integration | 145-165 | 32-34 | 120-140 | 29-31 | |
| Membrane-PSA integration & ${\mathrm{N}}_{2}$ recovery | 155-175 | 35-37 | 130-150 | 32-34 | |
| Small scale ( 0.1 mtpa) | Chemical absorption | 13-15 | 32-35 | 13-15 | 30-33 |
| PSA | 16-18 | 33-35 | 14-16 | 30-33 | |
| PSA & ${\mathrm{N}}_{2}$ recovery | 17-19 | 36-38 | 16-18 | 33-35 | |
| Membrane absorption | 13-15 | 32-35 | 13–15 | 30-33 | |
| Membrane-PSA integration | 16–18 | 32-34 | 13–15 | 29-32 | |
| Membrane-PSA integration & ${\mathrm{N}}_{2}$ recovery | 18–20 | 35-37 | 16–18 | 32-35 |
Table 19 Economic performance of technologies for storage grade from LKFG (at capture rate of ${90}\%$ )
| Scale | Technology options | Investment cost (million \$) | Operating cost (\$/ton) | Investment cost by 2025 (million \$) | Operating cost by 2025 (\$/ton) |
| Large scale (1.0 mtpa) | Chemical absorption | 100-120 | 32-35 | 95-115 | 30-33 |
| PSA | 130-150 | 32-34 | 110-130 | 29-32 | |
| PSA & ${\mathrm{N}}_{2}$ recovery | 140-160 | 35-37 | 130-150 | 32-34 | |
| Membrane absorption | 100-120 | 32-35 | 95-115 | 30-33 | |
| Membrane separation | 135-155 | 33-35 | 105-125 | 29-32 | |
| Membrane-& ${\mathrm{N}}_{2}$ recovery | 145-165 | 36-38 | 105-125 | 32-35 | |
| Membrane-PSA integration | 135-155 | 31-33 | 110-130 | 28-30 | |
| Membrane-PSA integration & ${\mathrm{N}}_{2}$ recovery | 145-165 | 34-36 | 120-140 | 31-33 | |
| 100,000 tons/year | Chemical absorption | 13-15 | 32-35 | 13-15 | 30-33 |
| pressure swing adsorption | 15-17 | 32-34 | 13-15 | 29-32 | |
| Adsorption $+ {\mathrm{N}}_{2}$ recovery | 16-18 | 35-37 | 15-17 | 32-34 | |
| Membrane absorption | 13-15 | 32-35 | 13-15 | 30-33 | |
| Membrane separation | 15-17 | 33-35 | 13-15 | 29-32 | |
| Membrane separation $+ {\mathrm{N}}_{2}$ recovery | 16-18 | 36-38 | 15-17 | 32-34 | |
| Membrane separation—pressure swing adsorption | 15-17 | 31-33 | 12-14 | 28-31 | |
| Membrane separation—pressure swing adsorption + ${\mathrm{N}}_{2}$ recovery | 17-19 | 34-36 | 15-17 | 31-34 |
3.4 Techno-Economic Analysis of ${\mathrm{{CO}}}_{2}$ Capture from for Hot Blast Furnace Flue Gas
3.4.1 Technical Analysis
Hot blast furnace is one of the important facilities in the process of iron-making. Although the flue gas produced by a single hot blast furnace is generated intermittently, in the actual production process, multiple hot blast furnaces share one flue gas discharge pipeline; therefore, at the end of the pipeline, the discharge of flue gas is almost continuous. The temperature of hot blast furnace flue gas is usually high, being about ${250} - {300}{}^{ \circ }\mathrm{C}$ ; on the one hand, the high temperature has influence on some carbon capture technologies; on the other hand, the high temperature waste heat can also be recycled to offset the energy consumption of carbon capture.
The composition of a typical hot blast furnace flue gas in Chinese steel/iron plant is shown in Table 20. The ${\mathrm{{CO}}}_{2}$ concentration is ${28.52}\%$ , which is much higher than that of blast furnace gas, lime kiln flue gas and other major ${\mathrm{{CO}}}_{2}$ emission sources in a steel plant. This high concentration of hot blast flue gas can not only benefit the applicability of chemical absorption method, but also pressure swing adsorption method and membrane separation method (Tables 4, 5, 6,7,8,9,10,11,12,13,14and 15). However, the high temperature of flue gas could affect the chemical absorbent consumption and the use of pressure swing adsorption. The advantages of absorption method and pressure swing adsorption method are able to play well when the temperature is reduced; for the membrane separation method, by using high temperature resistant membrane materials, such as zeolite membrane, it can be operated at high temperature; while for pressure swing adsorption method, the high temperature has a negative effect.
Table 20 Composition of typical hot blast furnace flue gas in China
| Composition | ${\mathrm{{CO}}}_{2}$ | ${\mathrm{N}}_{2}$ | ${\mathrm{O}}_{2}$ | ${\mathrm{H}}_{2}\mathrm{O}$ | Ash/(mg m ${}^{-3}$ ) |
| Hot blast furnace flue gas | 28.52 | 65.15 | 2.51 | 3.82 | 5 |
Specifically, capture ${\mathrm{{CO}}}_{2}$ with industrial grade above by large scale for internal use, the chemical absorption method is more applicable, although there is a negative effect of high temperature. Due to the higher ${\mathrm{{CO}}}_{2}$ concentration in feed gas, the applicability of pressure swing adsorption method is improved. Similarly, the applicability of the pressure swing adsorption method integrated with membrane separation will also be more enhanced than that of a simple adsorption method. For the storage grade capture, both absorption and pressure swing adsorption methods can be applied when the temperature is reduced, compared to lime kiln flue gas and blast furnace gas, membrane separation method is more applicable. The applicability of pressure swing adsorption integrated with membrane separation will be further improved.
Similar to lime kiln flue gas, the nitrogen composition of hot blast furnace gas is high. After the pressurized feed gas passes through membrane material or pressure swing adsorption unit, the nitrogen content in the gas stream is increased due to removal of ${\mathrm{{CO}}}_{2}$ . Without further pressurized, the gas stream with higher nitrogen content can directly generate high purity nitrogen by other nitrogen separation technologies such as membrane and thus produce nitrogen by-product with low costs. While for the chemical absorption method, the gas stream rich in nitrogen still requires further high energy consumption to separate nitrogen. It is difficult for chemical absorption method itself to obtain high purity nitrogen as a by-product.
From the perspective of technology maturity, the maturity of chemical absorption method is higher than that of membrane separation and pressure swing adsorption. The composition of flue gas from a hot blast furnace contains high concentration ${\mathrm{{CO}}}_{2}$ , hence, the experience of industrial gases separation by membrane separation method and pressure swing adsorption method can be referred, although there is still lack of direct technical demonstrations of these two methods (Table 21).
3.4.2 Economic Analysis
The ${\mathrm{{CO}}}_{2}$ concentration in hot blast furnace flue gas is higher than that in blast furnace gas. It is nearly double the ${\mathrm{{CO}}}_{2}$ concentration in lime kiln flue gas. The investment and operating costs of the corresponding capture technologies are far less than that of hot blast furnace gas and blast furnace gas. When considering the recovery of nitrogen, the investment cost will increase. Tables 22 and 23 give the economics of ${\mathrm{{CO}}}_{2}$ product of industrial grade and storage grade, respectively.
Table 21 Technical performance of technologies for hot blast furnace flue gas
| Product requirement | Technology | Applicability | Disadvantages | |
| Industrial grade | Chemical absorption | Good | Capable of producing high concentration ${\mathrm{{CO}}}_{2}$ , mature technology | Involves chemical process, complex system and negative effect on environment |
| pressure swing adsorption | Average | Easy to be modularly developed, can produce by-product nitrogen | High pretreatment requirement, large land use and unit size, complex system | |
| Membrane separation | Bad | N/A | Poor system reliability, lack of technology demonstration | |
| Cryogenic distillation | Bad | N/A | Product of is in liquid state, not suitable for internal use | |
| Membrane—absorption integration | Average | Can guarantee high concentration of ${\mathrm{{CO}}}_{2}$ ; can reduce land use | Involves integration of membrane and chemical absorption; complex system, and negative impacts on environment; immature technology | |
| Membrane—adsorption integration | Good | Can produce high concentration ${\mathrm{{CO}}}_{2}$ ; reduced land use and facility size; enhanced system stability | Involves two processes of membrane and PSA and their integration; system is complex | |
| Membrane—cryogenic integration | Average | Product is in liquid state, suitable for external use by small scale | Product of is in liquid state, not suitable for internal use |
(continued)
Table 21 (continued)
| Product requirement | Technology | Applicability | Disadvantages | |
| Storage grade | Chemical absorption | Good | Capable of producing high concentration ${\mathrm{{CO}}}_{2}$ , mature technology | Involves chemical process, complex system and negative effect on environment |
| Pressure swing adsorption | Good | Easy to be modularly developed, can produce by-product nitrogen | High pretreatment requirement, large land use and unit size, complex system | |
| Membrane separation | Good | Can be modularly developed, can produce by-product nitrogen | Poor system reliability, lack of technology demonstration | |
| Cryogenic distillation | Bad | N/A | ${\mathrm{{CO}}}_{2}$ concentration is too low | |
| Membrane—absorption integration | Average | Can guarantee high concentration of ${\mathrm{{CO}}}_{2}$ ; can reduce land use | Involves integration of membrane and chemical absorption; complex system, and negative impacts on environment; immature technology | |
| Membrane—adsorption integration | Good | Can produce high concentration ${\mathrm{{CO}}}_{2}$ ; reduced land use and facility size; enhanced system stability | Involves two processes of membrane and PSA and their integration; system is complex | |
| Membrane—cryogenic integration | Average | Product is in liquid state, suitable for external use by small scale | Not suitable for pipeline transportation in super-critical phase |
Table 22 Economic performance of technologies for industrial grade from hot blast furnace flue gas (at capture rate of 90%)
| Scale | Technology options | Investment cost (million \$) | Operating cost (\$/tonne) | Investment cost by 2025 (million \$) | Operating cost by 2025 (\$/tonne) |
| Large scale (1.0 mtpa) | Chemical absorption | 80–100 | 28-30 | 75-95 | 27-29 |
| PSA | 110-130 | 28-30 | 100–120 | 26-28 | |
| PSA & ${\mathrm{N}}_{2}$ recovery | 125-145 | 31-33 | 115-135 | 29-31 | |
| Membrane absorption | 80-100 | 28-30 | 75-95 | 27-29 | |
| Membrane-PSA integration | 120-140 | 27-29 | 110-130 | 25-27 | |
| Membrane-PSA integration & ${\mathrm{N}}_{2}$ recovery | 135-155 | 33-35 | 120-140 | 30-32 | |
| Small scale (0.1 mtpa) | Chemical absorption | 11-13 | 28-30 | 10-11 | 27-29 |
| PSA | 13-15 | 28-30 | 12-14 | 26-28 | |
| PSA & ${\mathrm{N}}_{2}$ recovery | 15-17 | 31-33 | 14-16 | 29-32 | |
| Membrane absorption | 11-13 | 28-30 | 10-11 | 27-29 | |
| Membrane-PSA integration | 14-16 | 27-29 | 13–15 | 25-27 | |
| Membrane-PSA integration & ${\mathrm{N}}_{2}$ recovery | 16-18 | 33-35 | 16–18 | 30-32 |
For capture of industrial grade above ${\mathrm{{CO}}}_{2}$ , the investment cost of chemical absorption method is still lower than that of PSA and other methods, even by 2025. However, compared with blast furnace gas, this gap is much smaller. The operating cost of PSA method is low. By 2025, the operating cost of pressure swing adsorption method may be lower than that of absorption method. In particular, membrane-PSA integration method is very likely to be lower than absorption method. If considering the benefit of by-product nitrogen, the cost of membrane-PSA integration method can be greatly improved, and will be lower than that of chemical absorption method.
For ${\mathrm{{CO}}}_{2}$ capture of storage grade, the economics of chemical absorption method is slight lower than that of industrial grade capture. The investment cost and operating cost of PSA method will be further declined. The cost of membrane separation is also close to the cost of absorption method and PSA method. It may likely be lower than the cost of PSA method in 2025. The cost of membrane-PSA integration method could be further reduced than that of single membrane separation method and single PSA method. At an internal price of nitrogen being USD0.03/Nm ${}^{3}$ , the benefit of nitrogen product could be as high as USD22.0/tonne. Take a lime kiln flue gas with ${28}\% {\mathrm{{CO}}}_{2}$ and ${65}\%$ nitrogen as an example, capture one tonne ${\mathrm{{CO}}}_{2}$ can generate about $30 of nitrogen benefit under scenario of ${\mathrm{{CO}}}_{2}$ capture rate being ${90}\%$ , and nitrogen capture rate being 80%. Compared with the capture of lime kiln flue gas, although the cost of ${\mathrm{{CO}}}_{2}$ capture decreases, the benefit of nitrogen also decreases.
Table 23 Economic performance of technologies for storage grade from hot blast furnace flue gas (at capture rate of 90%)
| Scale | Technology options | Investment cost (million \$) | Operating cost (\$/ton) | Investment cost by 2025 (million \$) | Operating cost by 2025 (\$/ton) |
| Large scale (1.0 mtpa) | Chemical absorption | 80–100 | 28-30 | 75-95 | 27-29 |
| PSA | 100-120 | 27-29 | 90-110 | 25-27 | |
| PSA & ${\mathrm{N}}_{2}$ recovery | 110-130 | 30-32 | 100-120 | 28-30 | |
| Membrane absorption | 80–100 | 28-30 | 75-95 | 27-29 | |
| Membrane seperation | 105-125 | 28-30 | 90-110 | 25-27 | |
| Membrane-& ${\mathrm{N}}_{2}$ recovery | 115-135 | 31-33 | 100-120 | 28-30 | |
| Membrane-PSA integration | 110-130 | 28-30 | 95-115 | 25-27 | |
| Membrane-PSA integration & ${\mathrm{N}}_{2}$ recovery | 120-140 | 31-33 | 105-125 | 28-30 | |
| Small scale ( 0.1 mtpa) | Chemical absorption | 11-13 | 28-30 | 10-11 | 27-29 |
| PSA | 12-14 | 27-29 | 11-13 | 25-27 | |
| PSA & ${\mathrm{N}}_{2}$ recovery | 14-16 | 30-32 | 13-15 | 28-30 | |
| Membrane absorption | 11-13 | 28-30 | 10-11 | 27-29 | |
| Membrane seperation | 13-15 | 28-30 | 11-13 | 25-27 | |
| Membrane-& ${\mathrm{N}}_{2}$ recovery | 15-17 | 31-33 | 13-15 | 28-30 | |
| Membrane-PSA integration | 13-15 | 26-28 | 12-14 | 24-26 | |
| Membrane-PSA integration & ${\mathrm{N}}_{2}$ recovery | 15-17 | 29-31 | 14-16 | 27-29 |
3.5 Techno-Economic Analysis of ${\mathrm{{CO}}}_{2}$ Capture for Linz-Donawitz Gas
In a Linz-Donawitz steel-making process, under high temperature, carbon in molten iron reacts with blown oxygen to generate a mixture of carbon monoxide and a small amount of carbon dioxide. The recovered Linz-Donawitz gas (LDG) contains about ${60}\%$ of CO,15-20% of ${\mathrm{{CO}}}_{2}$ , as well as nitrogen, hydrogen and trace oxygen. Capturing ${\mathrm{{CO}}}_{2}$ from Linz-Donawitz gas is not only the need for carbon reduction, but also anti-corrosion of gas pipe caused by the presence of ${\mathrm{{CO}}}_{2}$ . Because the amount of Linz-Donawitz gas is not generated at a stable level in a smelting process, the gas usually needs to be stored in a gas cabinet temporarily after full dusting and cooling. The capacity of the gas cabinet determines the gas buffer time in the gas cabinet.
With the gas cabinet storage, “intermittent producing, continuous use” of the gas can be realized. ${\mathrm{{CO}}}_{2}$ in the gas stream can be captured either before the gas stream enters the cabinet or after the gas stream enters the cabinet. Capturing ${\mathrm{{CO}}}_{2}$ before the cabinet can reduce the volume of the gas stream, and increase the buffer efficiency of a cabinet; on the other hand, the dissolution of ${\mathrm{{CO}}}_{2}$ is reduced at a water sealing process through removing ${\mathrm{{CO}}}_{2}$ in the gas stream, thereby, the corrosivity of the gas stream is further undermined. When capturing ${\mathrm{{CO}}}_{2}$ after the gas cabinet, the corresponding gas volume can be continuous and stable which is particularly helpful to some capture technologies.
3.5.1 Technical Analysis
For capture ${\mathrm{{CO}}}_{2}$ from a LDG stream before a gas cabinet, whatever the captured ${\mathrm{{CO}}}_{2}$ product is at industrial above grade or storage grade, whatever it is by large scale or small scale, overall, the technical applicability of chemical absorption method and membrane-absorption method is obviously better than that of other methods. The main reason is that the intermittence of Linz-Donawitz gas before a cabinet storage has less influence on a chemical absorption process, while greater influence on membrane separation and pressure swing adsorption processes that require compression operation of a compressor. Especially for a centrifugal compressor, a gas stream without stable volume can result in many technical problems (Table 32).
However, when capture ${\mathrm{{CO}}}_{2}$ from LDG stream after a gas cabinet, if capturing ${\mathrm{{CO}}}_{2}$ for internal use, pressure swing adsorption method and membrane separation method can also be applicable since feed gas stream can be adjusted at stable level with the cabinet. Another technical advantage of membrane and PSA separation methods is that the ${\mathrm{{CO}}}_{2}$ removed gas stream can be directly transported through pipeline without further pressure because the feed gas has been pressurized for removal the ${\mathrm{{CO}}}_{2}$ . The integration of membrane separation and PSA can further enhance the advantage. If capturing ${\mathrm{{CO}}}_{2}$ for industrial grade above, absorption method is more applicable (Tables 24, 25 and 26).
3.5.2 Economic Analysis
Before a Linz-Donawitz gas enters a cabinet, chemical absorption is cost-effective to capture ${\mathrm{{CO}}}_{2}$ of industrial grade above and storage grade. For the project of million tonnes/year scale (large scale), because of the intermittency of feed gas, the investment cost of such a large-scale project will be greater than that of post-combustion capture project with the same concentration in a coal-fired power plant. The operating cost of a project is only slightly higher than that of the post-combustion capture project in coal-fired power plant, because the costs mostly depend on energy consumption of absorption and desorption processes, which are less affected by the intermittency of feed LDG stream. Removing ${\mathrm{{CO}}}_{2}$ from a Linz-Donawitz gas can not only increase the calorific value of the gas, but also increase the efficiency of gas storage cabinets and reduce the corrosive effect of the gas on the subsequent device and equipment. In addition, the capture process can also contribute partially to cool the gas, thus save the capital and operating costs of cooling equipment.
Regarding the ${\mathrm{{CO}}}_{2}$ from LDG stream after a gas cabinet, a chemical absorption method is also cost effective. The investment cost is further reduced significantly while the operating cost also reduces as the feed gas has a stable volume. However, the feed gas before cabinet has a high corrosivity to the cabinet, and the utilization efficiency of the cabinet is also poor. Currently, the investment cost of PSA and membrane separation methods that are applicable to storage grades are far higher than that of chemical absorption method, however, after 2025, the investment cost could decrease significantly. When considering the energy consumption saved in the subsequent compressing process that ensure the gas transported through a pipeline under high pressure, the operating cost may further decrease. Considering this cost saving, by 2025, the overall cost of the technology that integrates membrane separation with PSA is probably close to the cost of chemical absorption method (Tables 27 and 28).
Table 24 Technical performance of technologies for Linz-Donawitz gas before cabinet
| Technological options | Technical applicability | Main reasons | Disadvantages |
| Chemical absorption | Good | Capable of producing high concentration ${\mathrm{{CO}}}_{2}$ , mature technology | Involves chemical process, complex system and negative effect on environment |
| Pressured swing adsorption | Bad | Compressor is difficult to operate under an intermittent condition | High pretreatment requirement, large land use and unit size, complex system |
| Membrane separation | Bad | Compressor is difficult to operate under an intermittent condition | Poor system reliability, lack of technology demonstration |
| Cryogenic distillation | Bad | Compressor is difficult to pressurize the intermittent gas | N/A |
| Membrane—absorption integration | Average | Can guarantee high concentration of ${\mathrm{{CO}}}_{2}$ ; can reduce land use | Involves integration of membrane and chemical absorption; complex system, and negative impacts on environment; immature technology |
Table 25 Technical performance of technologies for industry grade ${\mathrm{{CO}}}_{2}$ from Linz-Donawitz gas after cabinet
| Product requirement | Technology options | Applicability | Advantage | Disadvantages |
| Internal use | Chemical absorption | Good | Capable of producing high concentration ${\mathrm{{CO}}}_{2}$ , mature technology | Involves chemical process, complex system and negative effect on environment |
| Pressured swing adsorption | Average | Can produce high concentration of ${\mathrm{{CO}}}_{2}$ and can be modularly developed | High pretreatment requirement, large land use and unit size, complex system | |
| Membrane separation | Bad | N/A | Poor system reliability, lack of technology demonstration; difficulty to produce high concentration ${\mathrm{{CO}}}_{2}$ | |
| Cryogenic distillation | Bad | N/A | Product of is in liquid state. not suitable for internal use | |
| Membrane—absorption integration | Average | Can guarantee high concentration of ${\mathrm{{CO}}}_{2}$ ; can reduce land use | Involves integration of membrane and chemical absorption; complex system, and negative impacts on environment; immature technology | |
| Membrane—adsorption integration | Good | Can produce high concentration ${\mathrm{{CO}}}_{2}$ ; reduced land use and facility size | Involves two processes of membrane and PSA and their integration; system is complex | |
| Membrane—cryogenic integration | Bad | N/A | Product of is in liquid state, not suitable for internal use |
(continued)
Table 25 (continued)
| Product requirement | Technology options | Applicability | Advantage | Disadvantages |
| External use | Chemical absorption | Good | Capable of producing high concentration ${\mathrm{{CO}}}_{2}$ , mature technology | Involves a chemical process, the system is complex, negative effect on environment |
| Pressure swing adsorption | Average | Can produce high concentration of ${\mathrm{{CO}}}_{2}$ and can be modularly developed | High pretreatment requirement, large land use and unit size, complex system | |
| Membrane separation | Bad | N/A | Poor system reliability, difficult to obtain high purity ${\mathrm{{CO}}}_{2}$ products alone | |
| Cryogenic distillation | Bad | N/A | ${\mathrm{{CO}}}_{2}$ concentration is too low | |
| Membrane—absorption integration | Average | Can guarantee high concentration of ${\mathrm{{CO}}}_{2}$ ; can reduce land use | Involves integration of membrane and chemical absorption; complex system, and negative impacts on environment; immature technology | |
| Membrane—adsorption integration | Good | Can produce high concentration ${\mathrm{{CO}}}_{2}$ ; reduced land use and facility size | Involves two processes of membrane and PSA and their integration; system is complex | |
| Membrane—cryogenic integration | Good | Product of is in liquid state, suitable for external use by small scale | Not suitable for pipeline transportation in super-critical phase |
Table 26 Technical performance of technologies for storage grade ${\mathrm{{CO}}}_{2}$ from Linz-Donawitz Gas after cabinet
| Product requirement | Technology options | Applicability | Advantage | Disadvantages |
| Internal use | Chemical absorption | Good | Capable of producing high concentration ${\mathrm{{CO}}}_{2}$ , mature technology | Involves chemical process, complex system and negative effect on environment |
| Pressure swing adsorption | Average | Can produce high concentration of ${\mathrm{{CO}}}_{2}$ and can be modularly developed, LDG after ${\mathrm{{CO}}}_{2}$ removal can enter pipeline without addition pressure | High pretreatment requirement, large land use and unit size, complex system | |
| Membrane separation | Average | Can be modularly developed. LDG after ${\mathrm{{CO}}}_{2}$ removal can enter pipeline without addition pressure | Poor system reliability, lack of technology demonstration | |
| Cryogenic distillation | Bad | N/A | Product of is in liquid state. not suitable for internal use | |
| Membrane-absorption integration | Average | Can guarantee high concentration of ${\mathrm{{CO}}}_{2}$ ; can reduce land use | Involves integration of membrane and chemical absorption; complex system, and negative impacts on environment; immature technology |
(continued)
Table 26 (continued)
| Product requirement | Technology options | Applicability | Advantage | Disadvantages |
| Membrane—adsorption integration | Good | Can produce high concentration ${\mathrm{{CO}}}_{2}$ ; reduced land use and facility size; enhanced system stability. LDG after ${\mathrm{{CO}}}_{2}$ removal can enter pipeline without addition pressure | Involves two processes of membrane and PSA and their integration; system is complex | |
| Membrane—cryogenic integration | Bad | N/A | Product of is in liquid state. not suitable for internal use | |
| External use of storage grade | Chemical absorption | Good | Capable of producing high concentration ${\mathrm{{CO}}}_{2}$ , mature technology | Involves chemical process, complex system and negative effect on environment |
| Pressure swing adsorption | Average | Can produce high concentration of ${\mathrm{{CO}}}_{2}$ and can be modularly developed. LDG after ${\mathrm{{CO}}}_{2}$ removal can enter pipeline without addition pressure | High pretreatment requirement, large land use and unit size, complex system | |
| Membrane separation | Average | Can be modularly developed; LDG after ${\mathrm{{CO}}}_{2}$ removal can enter pipeline without addition pressure | Poor system reliability, lack of technology demonstration | |
| Cryogenic distillation | Bad | N/A | ${\mathrm{{CO}}}_{2}$ concentration is too low |
(continued)
Table 26 (continued)
| Product requirement | Technology options | Applicability | Advantage | Disadvantages |
| Membrane—absorption integration | Average | Can guarantee high concentration of ${\mathrm{{CO}}}_{2}$ ; can reduce land use | Involves integration of membrane and chemical absorption; complex system, and negative impacts on environment; immature technology | |
| Membrane-adsorption integration | Good | Can produce high concentration ${\mathrm{{CO}}}_{2}$ ; reduced land use and facility size; enhanced system stability; LDG after ${\mathrm{{CO}}}_{2}$ removal can enter pipeline without addition pressure | Involves two processes of membrane and PSA and their integration; system is complex | |
| Membrane—cryogenic integration | Good | Product of is in liquid state, suitable for external use by small scale; LDG after ${\mathrm{{CO}}}_{2}$ removal can enter pipeline without addition pressure | Not suitable for pipeline transportation in super-critical phase |
Table 27 Economic performance of technologies for industrial grade ${\mathrm{{CO}}}_{2}$ from Linz-Donawitz gas after cabinet (at capture rate of 90%)
| Scale | Technology options | Investment cost (million \$) | Operating cost (\$/tonne) | Investment cost by 2025 (million \$) | Operating cost by 2025 (\$/tonne) |
| Large scale ( 0.1 mtpa) | Chemical absorption | 110-130 | 33-36 | 100-120 | 31-34 |
| adsorption | 160-180 | 35-37 | 140-160 | 32-34 | |
| Membrane absorption | 130-150 | 33-36 | 120-140 | 31-34 | |
| Membrane separation—pressure swing adsorption | 160-180 | 36-38 | 140-160 | 32-34 | |
| Small scale (0.1 mtpa) | Chemical absorption | 15-17 | 33-36 | 14-16 | 31-34 |
| Pressure swing adsorption | 18-20 | 35-37 | 16-18 | i | |
| Membrane absorption | 16-18 | 33-36 | 15-17 | 31-34 | |
| Membrane separation—pressure swing adsorption | 18-20 | 36-38 | 16-18 | 33-34 |
3.5.3 Techno-Economic Analysis of ${\mathrm{{CO}}}_{2}$ Capture for Flue Gas from Coke Oven and Power Generation Unit
The coke oven flue gas in a steel/iron plant is sourced from combustion for heating a coke oven. It is the combustion product of fossil fuel in a coke oven and discharged through a coke oven chimney. The flue gas sourced from power generation unit mainly comes from combustion of fuel, such as BFG, COG, coal, natural gas. The sources and the compositions of flue gases from coke oven and power generation unit are similar, with the ${\mathrm{{CO}}}_{2}$ concentration being between 10 and 15%. Therefore, a technology that is applicable to one is roughly applicable to the other.
For capturing storage grade ${\mathrm{{CO}}}_{2}$ from a post-combustion flue gas stream with low concentration ${\mathrm{{CO}}}_{2}$ , the chemical absorption method is the most suitable among current available capture technologies. So far, there have already been large-scale post-combustion capture demonstration projects in operation in Canada and US, respectively. The technologies and experiences leant from those two projects can be referred to capture of flue gas from a coke oven and a power generation unit in a steel/iron plant. Although the PSA method and membrane separation method are also suitable for carbon capture of storage grade, however, it is still in a technological demonstration stage for flue gas from power-generation processes. Even by 2025, it is estimated that it is difficult for large-scale commercial application mainly because the ${\mathrm{{CO}}}_{2}$ concentration in the flue gas is very low. By 2025, membrane-absorption integration method may become gradually technical mature.
Table 28 Economic performance of capture ${\mathrm{{CO}}}_{2}$ of storage grade after Linz-Donawitz Gas after cabinet (90% capture rate)
| Scale | Technology options | Investment cost (million \$) | Operating cost (\$/tonne) | Investment cost by 2025 (million \$) | Operating cost by 2025 (\$/tonne) |
| Large scale ( 0.1 mtpa) | Chemical absorption | 110-130 | 33-36 | 100-120 | 31-34 |
| Adsorption | 150-170 | 34-36 | 130-150 | 31-33 | |
| Membrane absorption | 110-130 | 33-36 | 100-120 | 31-34 | |
| Membrane separation | 150-170 | 35-37 | 130-150 | 32-34 | |
| Membrane separation—pressure swing adsorption | 150-170 | 35-37 | 130-150 | 31-33 | |
| Small scale ( 0.1 mtpa) | Chemical absorption | 15-17 | 33-36 | 14-16 | 31-34 |
| pressure swing adsorption | 17-19 | 34-36 | 15-17 | 31-33 | |
| Membrane absorption | 15-17 | 33-36 | 14-16 | 31-34 | |
| Membrane separation | 17-19 | 35-37 | 15-17 | 32-34 | |
| Membrane separation—pressure swing adsorption | 17-19 | 35-37 | 15-17 | 32-34 |
As for economic performance, whatever investment cost or operating cost, chemical absorption method is mostly dominant over other methods, such as PSA method and membrane separation method. By year 2025, membrane-absorption method that integrates chemical absorption with membrane separation would further reduce its investment cost and operating cost. It is likely that its economic is getting better than an absorption method. Membrane separation method and PSA method as well as their integration are unlikely to be economically superior to the chemical absorption method by 2025.
3.6 Discussions
In a typical production process of steel/iron in China, main ${\mathrm{{CO}}}_{2}$ emission sources include: lime kiln flue gas, hot blast furnace gas (HBFG), blast furnace gas (BFG), Linz-Donawitz gas (LDG), and flue gas from coke oven and power generation unit. ${\mathrm{{CO}}}_{2}$ concentration as well as temperature, pressure and impurity content of these emission sources are different; therefore, technical applicability and economic performance of capture technologies are also different when applied to different emission sources. Generally, chemical absorption method is suitable for low concentration gas and PSA, membrane separation and cryogenic distillation methods are suitable for high concentration gas, while membrane separation, PSA and cryogenic methods and their integration are also suitable for gas stream with pressure over a mbient environment level, such as blast furnace gas before TRT.
The different demands on captured ${\mathrm{{CO}}}_{2}$ product also affect technical applicability and economic performance of capture technologies. In general, chemical absorption method is more suitable for obtaining ${\mathrm{{CO}}}_{2}$ of industrial level above than other methods. Membrane separation and PSA methods and their integration are also suitable for storage grade ${\mathrm{{CO}}}_{2}$ . capture; while cryogenic distillation method is not suitable for large-scale capture of low ${\mathrm{{CO}}}_{2}$ concentration gas in steel/iron plant, but it is applicable when integrated with membrane separation or PSA method for capture small-scale ${\mathrm{{CO}}}_{2}$ product with liquefaction requirement.
The technical applicability and economic performance of capture technologies are also affected by by-product opportunity associated with the removal of ${\mathrm{{CO}}}_{2}$ . For instance, the value of blast furnace gas can be raised by ${\mathrm{{CO}}}_{2}$ removal; flue gas of hot blast furnace and lime kiln can produce a by-product of nitrogen; corrosivity of Linz-Donawitz gas can be lessened after ${\mathrm{{CO}}}_{2}$ removal.
The technical applicability and economic performance of capture technologies are also depended on capture rate. Chemical absorption method is less influenced by capture rate than that membrane separation and PSA methods. Under a low ${\mathrm{{CO}}}_{2}$ concentration condition, membrane separation and pressure swing adsorption technologies are difficult to achieve a capture with rate of ${90}\%$ . Even if it can be achieved through their integration, investment and operation costs would be increased significantly. It is good for membrane separation and PSA methods and their integration to improve their technical applicability and economic performance by acceptance of a capture rate as low as ${85}\%$ . The optimal capture rate should be identified through a comprehensive analysis of capture cost and benefit in a system framework.
For China’s steel/iron industry, take technical applicability and economic performance of various technologies into consideration comprehensively, it is recommended that capture on blast furnace gas, hot blast furnace gas and flue gas from lime kiln be prioritized due to the following main reasons: (1) high concentration of ${\mathrm{{CO}}}_{2}$ in those gas stream; (2) calorific value of BFG can be significantly improved by removal of ${\mathrm{{CO}}}_{2}$ ; (3) nitrogen gas, which is highly demanded by iron/steel industry, can be obtained as a co-benefit to the capture. Though the ${\mathrm{{CO}}}_{2}$ concentration of lime kiln flue gas is lower than hot blast furnace gas, by-product nitrogen benefit is higher than that gas.
In fact, if taking all major carbon emission sources into account in a whole, carbon capture for iron/steel industry could be another different case, in view of interactions among carbon capture from various sources, For example, high temperature feature of hot blast furnace gas and Linz-Donawitz gas can be used for absorbent regeneration by chemical absorption method; as the result of ${\mathrm{{CO}}}_{2}$ capture, calorific value increasing of blast furnace gas can reduce the amount of feed gas for hot blast furnace heating, coke oven heating and power generation, thus could increase the ${\mathrm{{CO}}}_{2}$ concentration in their flue gases. It is then beneficial to improve the economic performance of further capture from those gases. In short, the technical applicability and economic performance of carbon capture technologies for a steel/iron industry could be affected by multiple factors and their interactions under different conditions, it is necessary to carry out future research with a real-world business case to assess the technical applicability and economic performance of ${\mathrm{{CO}}}_{2}$ capture for China iron/steel industry based on individual gas source and overall gas system, respectively.
4 Section 4
4.1 Concluding Remarks
Carbon capture technology is not only a large-scale ${\mathrm{{CO}}}_{2}$ emission reduction technology with great potential for China’s iron/steel industry, but also the only technology that can deliver a large-scale direct emission reduction for steel/iron industry, while it can enable large-scale iron/steel companies to achieve a sustainable emission reduction with less effect on their own established energy balance system. This study provided a comprehensive techno-economic analysis of major ${\mathrm{{CO}}}_{2}$ capture technologies for China’s steel/iron industry. Based on a typical iron/steel making process of China’s iron/steel industry, main ${\mathrm{{CO}}}_{2}$ emission sources including blast furnace gas, Linz-Donawitz gas, hot blast furnace flue gas, lime kiln flue gas and flue gases of coke oven and power generation within an iron/steel plant were characterized. It was indicated that ${\mathrm{{CO}}}_{2}$ concentration of lime kiln flue gas, hot blast furnace gas, blast furnace gas and Linz-Donawitz gas is higher than that of post-combustion flue gas of normal coal-fired power generation industry; ${\mathrm{{CO}}}_{2}$ concentration of flue gases from coke oven and power generation unit within an iron/steel plant is lower than that a post-combustion flue gas from normal coal-fired power generation industry. In general, hot blast furnace flue gas has the highest ${\mathrm{{CO}}}_{2}$ concentration, blast furnace gas ranks the second, followed by Linz-Donawitz gas and lime kiln flue gas.
Various post-combustion capture methods, including chemical absorption, pressure swine adsorption (PSA), membrane separation, cryogenic distillation methods and their integrations, are identified and analyzed from the perspective of their technical applicability and economic performance based on features of individual gas sources. Overall, chemical absorption is the most mature technology and have been demonstrated by two large-scale to post-combustion capture projects. It is particularly applicable and cost-effective to emission source with low ${\mathrm{{CO}}}_{2}$ concentration. Regarding PSA, membrane separation and cryogenic distillation methods, they are more applicable and cost-effective to high concentration ${\mathrm{{CO}}}_{2}$ source and have excellent technical and economic performance on gas stream with high pressure.
It is recognized by this study, that many factors could affect technical and economic performances of carbon capture technologies. Different temperature, pressure, impurity content and ${\mathrm{{CO}}}_{2}$ concentration of each emission source in steel/iron production process would lead to different technical applicability and economic performance of capture technologies; different demands for ${\mathrm{{CO}}}_{2}$ product also affect technical applicability and economic performance of capture technologies; in addition, co-benefit or by-product associated with ${\mathrm{{CO}}}_{2}$ removal affect technical applicability and economic performance of capture technologies. Specifically, calorific value of blast furnace gas can be significantly improved by ${\mathrm{{CO}}}_{2}$ removal; hot blast furnace flue gas has the highest ${\mathrm{{CO}}}_{2}$ concentration and high concentration nitrogen, lead to the lowest capture cost and an opportunity to produce by-product nitrogen with membrane technology, PSA or membrane-PSA integration technologies; Though the ${\mathrm{{CO}}}_{2}$ concentration of lime kiln flue gas is lower than hot blast furnace gas, by-product nitrogen benefit is higher than that gas.
In view of interactions among carbon capture from various sources, the technical applicability and economic performance of carbon capture technologies for a steel/iron industry could be affected by multiple factors and their interactions under different conditions, it is necessary to carry out future research with a real-world business case to assess the technical applicability and economic performance of ${\mathrm{{CO}}}_{2}$ capture for China iron/steel industry based on individual gas source and overall gas system, respectively.
4.2 A Caveat
Understandably, steel plants differ. This is especially true in China. As this and the previous chapter have discussed, many factors affect the technical and economic performance of CCUS, including but not limited to, temperature, pressure, content impurity, and ${\mathrm{{CO}}}_{2}$ concentration of each emission source. In turn, these varying factors would affect costs. Thus, for actual deployment of CCUS in connection with cost considerations, it goes without saying, it is necessary to conduct real-world cases to assess the technical applicability and economic performance of ${\mathrm{{CO}}}_{2}$ capture in light of local- and firm-specific engineering conditions.
177
Acronym Full spelling
BF/BOF Blast furnace/basic oxygen furnace
BFG Blast furnace gas
CCUS Carbon capture, utilization and storage
CFG Controlled flow graph
EAF Electric arc furnace
HBFG Hot blast furnace gas
LDG Linz-Donawitz gas
MEA Mono ethanol amine
PSA Pressure swing adsorption
TGRBF Top gas recycle of blast furnace
TRT Top gas pressure recovery turbine
VPSA Vacuum pressure swing adsorption
References
Birat, J. P. (2010). Carbon dioxide $\left( {\mathrm{{CO}}}_{2}\right)$ capture and storage technology in the iron and steel industry. Carbon dioxide $\left( {\mathrm{{CO}}}_{2}\right)$ capture, transport and industrial applications. Developments and innovation in carbon dioxide $\left( {\mathrm{{CO}}}_{2}\right)$ capture and storage technology (vol. 1). UK: Woodhead Publishing Ltd.
Cheng, H.-H., Shen, J.-F., & Tan, C.-S. (2010). CO2 capture from hot stove gas in steel making process. International Journal of Greenhouse Gas Control, 4, 525-531.
Cheng, H.-H., Shen, J.-F., & Tan, C.-S. (2010b). ${\mathrm{{CO}}}_{2}$ CRC. Fact sheets-Gas separation membranes. Australia Cooperative Research Centre for Greenhouse Gas Technologies $\left( {{\mathrm{{CO}}}_{2}\mathrm{{CRC}}}\right)$
${\mathrm{{CO}}}_{2}\mathrm{{CRC}}$ . Fact sheets-Gas separation membranes. Australia Cooperative Research Centre for Greenhouse Gas Technologies (CO2CRC).
Feron, P. H., & Jansen, A. E. (2002). CO2 separation with polyolefin membrane contactors and dedicated absorption liquids-performances and prospects. Separation and Purification Technology, 34(27), 231-242.
Fang, L. (2016). Automatic control of top combustion hot blast stove. Industrial Furnace, 38(4).
GCCST. (2016). The global status of CGS, 2016 (Summary Report). Global CCS Institute (GCCST).
Goto, K., Chowdhury, F. A., Kodama, S., et al. (2013). Development of a novel ${\mathrm{{CO}}}_{2}$ capture system with chemical absorption process for the integrated steel works. World Iron & Steel, 13(6).
Gielen, D. (2003). ${\mathrm{{CO}}}_{2}$ removal in the iron and steel industry. Energy Conversion and Managament, 44, 1027-1037.
IEA. (2010). Energy technology perspectives 2010—scenarios and strategies to 2050 (p. 650). Paris, France.
Jinlian, W. (2007). Study on new chemical absorbent and process that absorbs ${\mathrm{{CO}}}_{2}\left\lbrack \mathrm{D}\right\rbrack$ . Zhejiang University.
Juan, Z., Qichao, G., Yonghui, L., et al. (2017). A study on increasing the gas recovery rate of converter gas dry purification recovery system. Metallurgical Power, 3, 49-51.
Kuramochi, T., Ramírez, A., Turkenburg, W., & Faaij, A. (2011). Techno-economic assessment and comparison of ${\mathrm{{CO}}}_{2}$ capture technologies for industrial processes: Preliminary results for the iron and steel sector. Energy Procedia, 4, 1981198-1981208.
Kim, J. Y., Han, K., & Chun, H. D. (2009). CO2 absorption with low concentration ammonia liquor. Energy Procedia, 1, 757-762.
Lie, J. A., Vassbotn, T., Hägg, M.-B., Grainger, D., Kim, T.-J., & Mejdell, T. (2007). Optimization of a membrane process for ${\mathrm{{CO}}}_{2}$ capture in the steelmaking industry. International Journal of Greenhouse Gas Control, 1, 309-317.
Mingtan, W., Shenlin, X., & Zitong, X. (2016). Present state and latest development of ${\mathrm{{CO}}}_{2}$ capture technology. Contemporary Chemical Industry, 45(5), 1002-1005.
Ming, G., Limin, Z., Xiaoqiang, L., et al. (2016). Research status of ${\mathrm{{CO}}}_{2}$ capture and storage technology (CCS) in the coal-fired power plant. Gas Purification, 6, 23-26.
Peng, H. (2013). Study on adsorption of modified activated to ${\mathrm{{CO}}}_{2}$ from off-gas in power plant [D]. Hebei University of Science & Technology. POSCO. (2013). Carbon report-2013. South Korea.
Rui, R.,& Duan, W. (2006). Current situation of ${\mathrm{{CO}}}_{2}$ emission in iron and steel producing and its controlling methods. Science & Technology Review, 24(10), 53-56.
Rhee, C. H., Kim, J. Y., Han, K., Ahn, C. K., & Chun, H. D. (2011). Process analysis for ammonia based ${\mathrm{{CO}}}_{2}$ capture in ironmaking industry. Energy Procedia,4,1486-1493.
Shaodong, C. (2016). Research on production scheduling in iron and steel scrap remanufacturing under the background of carbon reduction [D]. Southeast University.
Tseitlin, M. A., Lazutkin, S. E., Styopin, G. M. (1994). A flow-chart for iron making on the basis of 100% usage of process oxygen and hot reducing gases injection. ISIJ International, 34, 570-573.
Tobiesen, F. A., Svendsen, H. F., & Mejdell, T. (2007). Modeling of blast furnace ${\mathrm{{CO}}}_{2}$ capture using amine absorbents. Industrial and Engineering Chemistry Research, 46, 7811-7819.
Wenmin, J. (2015). Process simulation and experimental study of the capture carbon dioxide by chemical absorption method [D]. Zhejiang University.
Weifeng, Z., & Jianhui, S. (2015). On the latest advancements in the membrane-based technologies for ${\mathrm{{CO}}}_{2}$ capture. Journal of Safety and Environment., ${15}\left( 3\right) ,{205} - {211}$ .
Xiaosen, L., & Tao, L. (2009). Present development situation of techniques separating carbon dioxide separation techniques inform flue gas separation. Modern Chemical Industry, 29(4), 25.
Xinfeng, S. (2008). Research and design on CO2recovery technology of limekiln tail gas [D]. Xi’an University of Architecture and Technology (in Chinese).
Xiaobing, L. (2014). Research progress on Carbon Dioxide capture and separation technology. Guangdong Chemical Industry, 41(5), 115-116.
Yoon, Y. N. S., Jung, S., & Kim, Y. (2011). K2CO3/hindered cyclic amine blend (SEFY-1) as a solvent for ${\mathrm{{CO}}}_{2}$ capture from various industries. Energy Procedia,4,267-272.
Yonggang, W., Tianhong, Y., Yujie, Z., et al. (2008). Comparison of dry cleaning and recovery technique for converter flue gas with wet one. Industrial Safety and Environmental Protection, 34(5), 10-12.
Yongjia, H., Shuli, W., Pengyu, Z., et al. (2009). Current status and advances in ${\mathrm{{CO}}}_{2}$ separation and capture technology. Natural Gas Industry, 29(12), 79-82.
Yuansheng, X., Guangquan, L., & Xianqing, Y. (2012). Research progress of carbon dioxide capture technology and mechanism. Chemical Intermediate, 10, 1-5.
Zhengping, S. (2009). Recovery and utilization of carbon dioxide in industrial waste gas. China High-Tech Enterprises, 13, 88-89.
Zhi, G., Xinmiao, Z., Chenlin, Z., et al. (2016). Research development of membrane materials for separation of ${\mathrm{{CO}}}_{2}$ from flue gas. Modern Chemical Industry, 6,42-45.
Part III
Market
Building Carbon Market in China: Take Stock and Look Ahead
Jun Fu, Xing Chen, and Jintao Xu
Addressing climate change and reducing ${\mathrm{{CO}}}_{2}$ emissions has become a consensus globally. Among major industrialized countries, policy makers have either deployed or started to contemplate about deploying market-based instruments for climate policy. In that context, the idea of “cap & trade” of the carbon market-alternatively known as emission-trading system (ETS) in Europe-has commanded much attention of late. Theoretically, between the two extreme poles of hierarchy and market, their hybrid in the form of ETS can reduce ${\mathrm{{CO}}}_{2}$ emission reductions at lower costs than direct administrative fiat such as mandated installation of emission-reduction technologies. Deployed singularly, the former is about quantities, whereas the latter is about prices. ${}^{1}$ But both are needed to fight against climate change if only because of the problem associated with free riding.
In line with the above, in 2011, China designated 7 provinces/cities, i.e., Beijing, Shanghai, Tianjin, Chongqing, Guangdong, Hubei and Shenzhen as ETS pilots (Duan et al., 2014). It was part and parcel of the country’s strategy to decarbonize its economy, and this move was the first phase (2011-2017) of a 3- phased plan to build carbon market in China. The vision was that these regional ETS pilots, if successful, would serve as stepping stones for China to prepare for a nation-wide ETS in the second phase (2017-2020), and following the second phase, China would consolidate and scale up the national ETS in the third phase (after 2020). Indeed, it was expected that China’s ETS would eventually overtake EU-ETS to become the largest in the world, covering emission-trading of up to 6-9 billion tons of ${\mathrm{{CO}}}_{2} \cdot {}^{2}$ In China, whereas there is broad agreement among environmental economists about the advantages of market-based resolutions, there is much debate as to whether or not a unified national ETS is the best choice for the country in light of regional disparities in industrial structure across the country.
${}^{1}$ For more discussion on this, see e.g., Weitzman (1974). Mideksa and Weitzman (2019).
The original version of this chapter was revised: Few words corrections on page 198 have been updated. The correction to this chapter can be found at https://doi.org/10.1007/978- 981-16-4310-1_8.
J. Fu $\left( \infty \right) \cdot$ J. Xu
National School of Development, Peking University, Beijing, China
X. Chen
School of International Relations and Public Affairs, Fudan University, Shanghai, China
In any event, are these regional ETS pilots working, albeit still at an early and experimental stage? What lessons can we learn from these regional ETS for the benefits of designing and developing a national ETS in the years ahead?
This chapter aims to investigate these questions. The chapter is organized into four Sections. Section 1 starts with a brief review of the theoretical basis and the current practice of ETS worldwide and then outlines the evolving policy framework for China’s ETS. Section 2 looks at the institutional designs and operational mechanics of these regional ETSs. In Section 3, adding rigor and going beyond a prima facie analysis, we deploy synthetic control method to evaluate the performance of China’s regional ETSs. Key takeaways and policy recommendations follow in Section 4.
1 Section 1
1.1 “Cap & Trade”: Theory and Practice of ETS
The theoretical basis of “cap & trade” of emission-trading system (ETS) can be traced back to the economic thinking of Nobel laureate Ronald Coase, which made it possible to frame the discourse on pollution control in terms of rights instead of taxes, as previously advocated by Arthur Pigou (Pigou, 1929). According to Coase’s theme, by identifying certain rights, such as the right to emit greenhouse gas (GHG) emissions, and enabling the rights to be transferable, private negotiations could lead to the optimal allocation of resources, as long as transaction costs are sufficiently low (Coase, 1960).
${}^{2}$ This is an estimation with the following assumptions: (1) China controls yearly ${\mathrm{{CO}}}_{2}$ emissions under 10 billion tons in 2016-2020; (2) it peaks ${\mathrm{{CO}}}_{2}$ emissions at 15 billion tons by 2030, and (3) the coverage of China’s ETS will be at the same level of EU-ETS, i.e., 60%. Assuming that the turn-over rate is at 300%, the trading volume of China’s ETS could reach 18-27 billion tons. In monetary terms, the value could reach 1.8-2.7 trillion RBM, assuming the price then is RMB 100/tCO2. According to UNEP, China’s CO2 emissions were 9.839 billion tons in 2019, accounting for 27.2% of the world’s total.
Essentially, the “cap & trade” scheme affects levels of greenhouse gases (GHG) emissions by way of establishing a market for emission permits allocated to emitters under a total amount of emissions allowed-hence the “cap”. The total amount of allowable emissions then is divided into some emission permits allocated to individual business entities under certain rules (Weitzman, 2012, 2017). Recognizing the marginal cost difference of different emitters, the scheme allows trading of emission permits to eventually arrive at an equilibrium price-hence the “trade”. The equilibrium price provides a signal of the scarcity of emission permits (Spence and Weitzman, 1978), which in turn can guide individual emitters to choose between different strategies, e.g., increasing GHG emissions or reducing GHG emissions by investing in new technologies.
The first large-scale practical implementation of emission trading was the US sulfur dioxide $\left( {\mathrm{{SO}}}_{2}\right)$ “cap & trade” program. The program started in 1995 intending to address the problem of acid rain in the northeastern United States by mandating significant reductions in total annual ${\mathrm{{SO}}}_{2}$ emissions from coal-fired power plants (Stavins, 2001). The success of the program resulted in the emission-trading scheme being adopted as a crucial element of the design of the Kyoto Protocol in 1997 (UNFCCC, 1998). Worldwide, the practice of “cap & trade” includes Chicago Climate Exchange (CCX), UK Emissions Trading Group (ETG), National Trust of Australia (NSW), and the EU GHG Emission Trading System (EU-ETS).
At present, the European Union (EU) is leading in terms of building GHG emission-trading systems. The EU-ETS started in 2005, and by 2015, it had covered 31 EU countries, accounting for 50% of EU’s total carbon emissions (European Commission, 2015). As envisioned, from 2015 to 2020, the EU-ETS has been undergoing three phases of construction. During the first phase (2005-2007), the EU-ETS covers industries such as power, petrochemical, steel, construction materials, and paper-making, and it sets a yearly ${\mathrm{{CO}}}_{2}$ emission cap at 2.299 billion tons. During the second phase (2008-2012), the EU-ETS expands its industry coverage to include aviation, and it sets a yearly ${\mathrm{{CO}}}_{2}$ emission cap at 2.081 billion tons. During the third phase (2013-2020), the EU-ETS further expands its industry coverage to include chemicals and electrolytic aluminum, and it sets a yearly ${\mathrm{{CO}}}_{2}$ emission cap at 1.846 billion tons.
Another salient feature of the EU-ETS is that it would gradually increase emission permits from free allowance to auction. Specifically, while auction does not exceed 5% in the first phase, it will increase to 10% during the second phase, and again to ${30}\%$ during the third phase. The general idea was to increase the competitive force of the market overtime (European Commission, 2003).
1.2 Policy Framework for Regional ETS Pilots in China
Under the UN Framework Convention for Climate Change (UNFCCC), in 2009, China had pledged to reduce carbon intensity per unit of GDP by 40-45% in 2020 from the 2005 level. Subsequently, China incorporated the concept of “carbon intensity” into its 12th Five Year Plan (FYP, 2011-2015) for the first time, and the country decided to “gradually [emphasis added] establish a carbon emission trading market” to control GHG emissions. The wording with respect to ETS in the FYP indicated that China’s approach would be a phased and gradual one. In other words, “testing it out and then scaling it up” was the way to go. In retrospect, China took its international pledge seriously, and the gradual approach for the construction of ETS was no surprise, as it followed the same logic of the overall reform and opening-up program of the whole country during the past 40 or so years.
In October 2011, the National Development and Reform Commission of China (NDRC) issued the “Notice on Conducting Carbon Trading Pilots"to seven provinces/cities in China-Beijing, Shanghai, Tianjin, Chongqing, Guangdong, Hubei and Shenzhen. In effect, this NDRC notice was an instruction for the seven provinces/cities to prepare for the institutional groundwork for the launch of ETS pilots in 2013-2014. The seven regional ETS pilots covered about 18% of China’s population, and 30% of the country’s GDP
Table 1 documents the legislative or policy framework at the seven localities to clear ways for the launch of the seven regional ETS pilots. As these regional ETS pilots were rolled out in 2013, it was expected that based on their experience, China would build a nationwide ETS to accelerate the process to decarbonize its economy. Indeed, according to the Joint China-US Presidential Statement in 2015, China promised to launch the national carbon market by the end of 2017.
Table 1 Policy framework of regional ETS pilots in China
| Localities | Key documents |
| Beijing | Resolution of Beijing Municipality to Carry out Carbon Trade Pilot and to Control Carbon Emissions (Standing Committee, Beijing Municipal People's Congress) |
| Shanghai | Shanghai Carbon Emissions Management Provisional Guidelines (Shanghai Municipal People's Government, November 18, 2013) |
| Guangdong | Guangdong Carbon Emissions Management Provisional Guidelines (Guangdong People's Government, January 15, 2014) |
| Shenzhen | Regulation of Shenzhen Special Economic Zone on Carbon Emissions Management (Shenzhen Municipal People's Congress, December 30, 2012) |
| Tianjin | Interim Measures of Tianjin Carbon Emission Trading (General Office of Tianjin Municipal People's Government) |
| Hubei | Hubei Interim Measures on Carbon Emissions Trade Management (Hubei Provincial Government, April 23, 2014) |
| Chongqing | Chongqing Carbon Emissions Trade Management Interim Measures (Chongqing Municipal People's Government, March 27, 2014) |
Source Websites of local DRC of Beijing, Shanghai, Tianjin, Chongqing, Guangdong, Hubei and Shenzhen
2 Section 2
2.1 Institutional Designs of ETS Pilots
Good institutional designs were critical for the success of the seven regional ETS pilots in China, and eventually, for the success of the national ETS, which China planned to launch by the end of 2017. As discussed in the previous section, China embarked on building carbon markets more or less from scratch, as a long-term strategic move to develop a low-carbon economy in view of the country’s pledge in 2009 to the international community to reduce carbon intensity of GDP by 40- 45% by 2020 from the 2005 level. After a couple of years of initial preparations starting in 2011, China started seven regional ETS pilots in 2013.
These regional ETS pilots were intended for the country to learn from experience before moving on to build a nationwide ETS. Given regional disparities in industrial structure, the advantage of such a strategy-i.e., regional pilots rather than one-swoop-go–is that local governments had the flexibility to design, operate, and adjust their ETS in light of local conditions. In Chinese aphorism, it is “crossing the river by touching the stones underneath”, so to speak, and there was a lot of “learning by doing” and “learning by watching” going on in the initial years. Indeed, during the initial phase, the regional ETS pilots had all learnt to expand industry coverage, improve permit allocations, and develop derivative products. And as a reflection of their demonstration effects, other provinces (e.g., Jiangsu, Xinjiang, and Zhejiang) increasingly showed interest in having their own ETSs. Fujian province, for instance, launched its own ETS in late 2016.
A brief observation shows that China’s regional ETS pilots exhibit the following institutional features:
These regional ETS pilots fall under the local Development and Reform Commission’s (DRC) jurisdiction, and the Local Finance Bureaus.
All regional ETS pilots generally distribute permits in a fashion of grandfather-ing (free distribution), except Guangdong, Shenzhen, and Hubei where permits are auctioned. ${}^{3}$
The government regularly intervenes in these pilot markets for data collection, allocation of permits and/or auction, and pricing if need be.
The regional ETS pilots cover mostly energy-intensive industries such as electricity, steel, cement, chemicals. ETSs in Beijing, Shanghai, and Tianjin, however, also cover building and service sectors. In all, some 20 industries are covered. ${}^{4}$
All ETS pilots only cover ${\mathrm{{CO}}}_{2}$ emissions, except Chongqing, which covers 6 GHGs $\left( {{\mathrm{{CO}}}_{2},{\mathrm{{CH}}}_{4},{\mathrm{\;N}}_{2}\mathrm{O},\text{ HFCs, HFCs, }{\mathrm{{SF}}}_{6}}\right)$ . Most ETS pilots cover both direct and indirect emissions, although indirect emission definition differs. Some account for purchased electricity only; others cover purchased electricity and heat. Hubei only trades direct emissions.
All regional ETS pilots recognize China Certified Emission Reduction (CCER) by NDRC, although some set ceilings for their use, ranging from 50 to 70%.
All regional ETS pilots set up two thresholds for market access: transaction threshold (for emission control firms) or reporting threshold (for reporting firms). The latter, albeit not included in trading yet, must report emissions to the government to consider future inclusion (Fig. 1).
3 Shanghai ETS represented another alternative, i.e., grandfathering + auction. See compliance/sanction below.
${}^{4}$ By 2020, close to 3,000 fossil-heavy industrial firms covered.
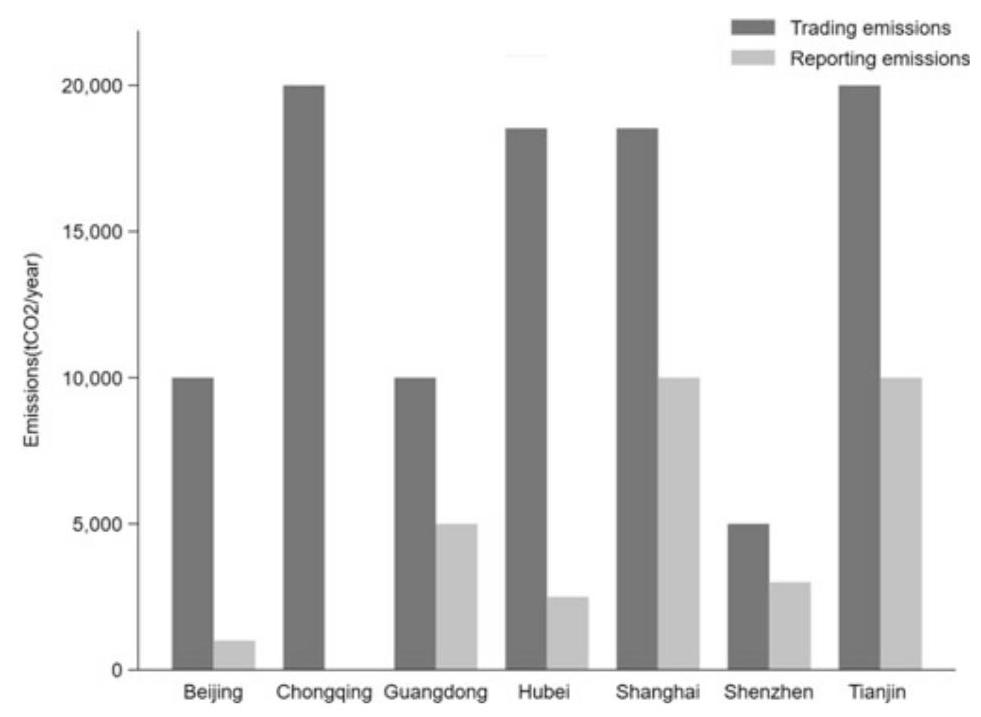
Fig. 1 ETS Pilots in China: Transaction Threshold and Reporting Threshold. Note 1. Data. Source Websites of local DRC in 7 regional ETS pilots; 2. Reporting emissions of Chongqing is unavailable
2.2 ETS Pilots in Operation
Institutional designs aside, let us take a look at the actual performance of China’s regional ETS pilots. For the purposes of this study, we look at the five domains as key performance indicators (KPI) of the ETS pilots: (1) emission permit allocation, (2) MRV (monitoring, reporting and verification), (3) compliance/sanctions, (4) CCER (China certified emission reduction), (5) behavioral change, and (6) pricing. Table 2 lists the six categories of KPIs. Below, we schematically elaborate a bit more on each of the six categories of KPIs.
Table 2 China’s regional ETS pilots in operation
| Tasks Allocation of allowances | Indicator | Control agency | Data source | Status check |
| Time & allocation of permits to firms | Total amount of permits allocated | Local DRC | Local DRC website | Permits allocated in 2013 and 2014, with 730 million tons and 1285 million tons respectively |
| Information collection | Indicator | Control agency | Data source | Status |
| Collection of emission reports including verification | Total number of emission reports collected | Local DRC | Local DRC Website; interview with ETS staff | Collected emission and verification reports from 1736 firms in 5 ETS pilots |
| Random checks on verification reports | Total number of random checks | Local DRC | Local DRC Website; interviews with ETS staff | No data on random checks on verification reports |
| Information disclosure on trading volume and price | Publication patterns of trading volume and price | Local DRC or carbon trading exchange | Local DRC Website; trading exchange; K-line website | All carbon trading exchanges released all information on trading volume and price except Guangdong, whose data is only on most recent trading |
(continued)
Table 2 (continued)
| Tasks Allocation of allowances | Indicator | Control agency | Data source | Status check |
| Information disclosure on compliance | Information compliance rate | Local DRC | Local DRC Website | All ETS pilots published information on compliance within 3 months after a compliance cycle |
| Compliance and sanction | Indicator | Control agency | Data source | Status check |
| Rules and sanctions on non-compliance | Total number of sanctions imposed | Local DRC | Local DRC Website; news reports | 14 firms were sanctioned for non-compliance. Nature of sanction unknown |
| Other policy instruments | Indicator | Control agency | Data Source | Status check |
| China Certified Emission Reduction (CCER) | Total CCER issued | NDRC | China CCER Exchange Info-Platform | A total of 13.72 million tons of CCER were issued by Jan. 14, 2015 |
| Behavioral change | ||||
| Firms behavior | Indicator | Control agency | Data source | Status check |
(continued)
Table 2 (continued)
| Tasks Allocation of allowances | Indicator | Control agency | Data source | Status check |
| Behavioral changes or adaptions | Amount of emission permit traded | Local Carbon Trading Exchanges | Local Carbon Trading Exchanges | A total of 114.58 million tons of permits was traded by June 30, 2017 |
| Adaption to compliance | Compliance rate | Local DRC | Local DRC Website | Compliance rates in 2013: Beijing 97%, Shanghai 100%, Guangdong 98%, Shenzhen 99%; Tianjin 96% |
a415 firms in Beijing, 191 in Shanghai, 184 in Guangdong, 114 in Tianjin, and 635 firms and 197 buildings in Shenzhen Source Websites of local DRC in 7 regional ETS pilots
1. Emission Permit Distribution
${\mathrm{{CO}}}_{2}$ emission permit allocation is a prerequisite for the carbon market to operate. Once the government sets the cap of emissions, it has to find a way to allocate allowances to emitters in a timely fashion (Pang and Duan 2016). The way that the regional ETS pilots in China operate in this area was that the government of each pilot launched a dedicated e-platform or website for registration and allocation of emission permits. By government, it referred to local DRC in each case. Allocation of emission permits had two ways: grandfathering and auction. In the case of Guangdong, Shenzhen, and Hubei, it was auction; and in the case of Beijing, Chongqing, Shanghai, and Tianjin, it was free distribution. In all, free distribution accounted for over 90%. There was room for the websites of these regional ETS pilots to improve. A quick browse in a comparative perspective indicated that these e-platforms were not equally user-friendly. For instance, the website of Beijing did not disclose data on how permits were allocated in 2013 and 2014.
2.MRV System
Transparency and accuracy of information is essential for market transactions. In the case of ETS, a robust MRV (monitoring, reporting and verification) system for corporate ESG (environment, social responsibility and corporate governance) is vital to minimize the risks of “greenwashing”. Here, it is the role of the government to collect information at the firm level with respect to emissions, trading, compliance, etc. Currently, all ETS pilots in China would require emission control firms to submit emission reports verified by a third party designated by the government. These reports then would be subject to random checks by the government to increase accuracy and reliability. Again, a quick browse of the websites of these regional ETS pilots showed that whereas information on trade volume and price was readily available, that of compliance was patchy, and that of verification was not available-a critical area that need further investigation.
3. Compliance/Sanctions
A robust regulatory framework has to put in place the so-called “teeth” of enforcement so that it can encourage or rather compel firms to take emission limits seriously and participate in carbon trading actively. Here, the rules regarding compliance and sanctions across these regional ETS pilots were vague, although there were sporadic reports on sanctions. For instance, in late 2013, Beijing and Guangdong imposed sanctions on a total of 14 firms for their failure of timely compliance, although little information was available as to what kind of penalty was imposed. In Tianjin, there was report that 4 firms had failed to perform their
2013 obligations in a timely fashion, and yet Tianjin Interim Measures did not contain penalty clauses, fines or otherwise. In Shenzhen, there were reports that grace periods were granted by the government to urge for compliance. It seemed that in terms of compliance and sanctions, Beijing and Guangdong were the most stringent, whereas Tianjin was most lax in enforcement of rules.
Shanghai ETS represented another alternative. Apparently, there was no case of non-compliance or sanctions in 2013. But the way that Shanghai ETS operated was that when the deadline (June 30) for compliance was approaching, the government auctioned off additional 580,000 tons of ${\mathrm{{CO}}}_{2}$ emissions permits that firms could buy for compliance. The result was high compliance rate.
4. CCER (China certified emission reduction)
All seven regional ETS pilots recognized project-based CCER (China certified emission reduction) approved and issued by NDRC, and information for authenticity and verification of these credits was available at China CCER Exchange Platform. In 2016, in terms of project number, Hubei ETS had 122 projects, Beijing ETS had 16, Chongqing ETS had 15, Guangdong ETS had 47, Shanghai ETS had 18, Tianjin ETS had 6, and Shenzhen ETS had 5, with a total of 229. Prominent among these projects were wind, solar, hydraulic power, and methane gas. ${}^{5}$ While the set ceiling for the use of CCER credits varies across the seven regional ETS pilots, ranging from 1 to ${10}\% ,{}^{6}$ CCER credits could count as emission allowances for compliance.
5. Behavioral Change
Does ETS change firms’ behavior, and if yes, to what extent? Are there variations across the seven regional ETS pilots? For the purposes of this study, we look at three key indicators-trading volume, trading turnover, and active ratio-defined as the ratio between the number of days that have trading volume and the total trading days. Our statistical deadline is June 30, 2017 and the results are tabulated in Table 3.
${}^{5}$ They accounted for over ${80}\%$ in terms of project number in 2020.
${}^{6}$ Specifically, offset limit of CCERs as a share of annual allowance was set at ${10}\%$ for Hubei, Shenzhen, Tianjin, 8% for Chongqing, 5% for Beijing, and 1% for Shanghai. Note also that credits from hydro projects are not allowed in most ETS pilots. In the case of Guangdong, the ceiling was set at 1.5 million offsets, and both CCERs and Pu Hui Certified Emission Reduction (PHCERs) were accepted, but at least 70% had to come from local projects in Guangdong province.
Table 3 ETS Pilots: trading indicators
| ETS Pilots | Starting date | Total trading days | Active ratio (%) | Average price(rmb) | Average trading volume(ton) | Average trading turnover(rmb) | Share of total (%) |
| Shenzhen | Jun-13 | 1885 | 89 | 38 | 14,349 | 546,882 | 12 |
| Beijing | Nov-13 | 1765 | 64 | 60 | 8169 | 488,521 | 6 |
| Shanghai | Dec-13 | 1750 | 62 | 31 | 10,183 | 315,377 | 8 |
| Guangdong | Dec-13 | 1750 | 86 | 24 | 43,495 | 1,023,164 | 32 |
| Tianjin | Dec-13 | 1744 | 38 | 18 | 5827 | 105,497 | 4 |
| Hubei | Apr-14 | 1674 | 96 | 23 | 47,771 | 1,101,884 | 34 |
| Chongqing | Jun-14 | 1623 | 35 | 17 | 5392 | 92,240 | 4 |
| Average | 1742 | 67 | 30 | 19,312 | 524,795 | - |
Note 1. Active rate means the ratio between number of days that have trading volume and total trading days; 2. The statistical deadline is set at Dec 31, 2020; 3. Total trading days excludes holidays; 3. Data source http://k.tanjiaoyi.com/..
The Table 3 shows that in terms of trading volume, Hubei was the highest and Tianjin was the lowest; in trading turnover, Hubei was the highest and Tianjin was the lowest; and in terms of active ratio, Hubei, again, was the highest and Tianjin was the lowest. Across the seven regional ETS pilots, the average active ratio was 66%. Above that ratio, there were Hubei (96%), Shenzhen (90%), Guang-dong (71%), and Beijing (69%), and below that ratio, there were Shanghai (63%), Tianjin (52%), and Chongqing (18%).
It seemed clear that, having operated for more than 3 years, the 3 ETS pilots, i.e., Hubei, Guangdong, and Shenzhen, were more active in trading than the other 4, i.e., Shanghai, Beijing, Chongqing, and Tianjin. Amongst the seven regional ETS pilots, Hubei ETS, in particular, was relatively successful, in terms of trading volume and turnover. By June 30, 2017, Hubei ETS sold 40.48 million tons of permits, with a turnover of RMB 797.82 million. But by international standards, even the best of China’s ETS pilots still had a long way to go. For instance, on a single day on January 21, 2015, the trading volume of California carbon market surged to 10 million tons, about of 2/3 of China’s total trading volume in all seven regional pilots (Fig. 2). ${}^{7}$ In the case of China, as Fig. 2 shows, the sudden and onetime spikes in trading volume around June 2015 indicate that many firms perhaps take emissions trading as political cooperation rather than investment opportunity. Carbon assets were not considered valuable.
${}^{7}$ http://calcarbondash.org/.
${}^{7}$ http://calcarbondash.org/.
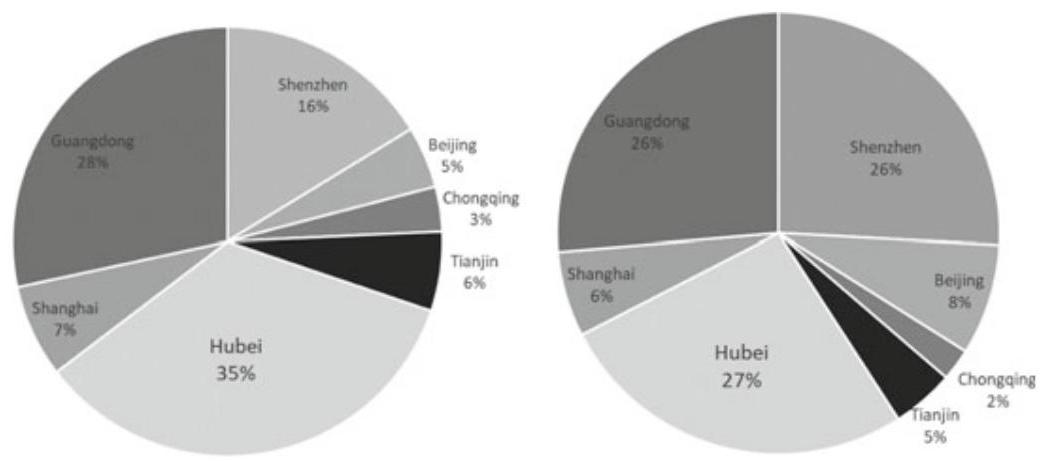
Fig. 2 Share of trading volume/trading turnover. Data source http://k.tanjiaoyi.com/
6. Pricing
Price is central to market (also see Fig. 2), and yet, given the fact that the regional pilots of carbon market in China remained divided, it was expected that carbon prices would vary across different regions. Indeed, there was a great variation of carbon price among these ETS pilots with a minimum of RMB 28 and a maximum of RMB 143 per ton of ${\mathrm{{CO}}}_{2}$ emissions. By June 30,2017, the total trading volume of the seven ETS pilots reached 114.58 million tons. As Table 2 shows that amongst the seven regional ETS pilots, average price for ${\mathrm{{CO}}}_{2}$ emissions was the highest in Beijing, about RMB 50/ton, followed by Shenzhen, with RMB 47/ton. The price in Shanghai, Chongqing, Hubei, and Tianjin was close, about RMB 20-25/ton. As an average of all seven ETS pilots, it was about RMB 30/ton-a price perhaps too low (still trending downwards, see Fig. 2) to significantly motivate a firm’s strategic investment in shifting towards better technology or cleaner energy. To highlight the point here, the current cost of CCUS technology is estimated at US$ 600/ton. ${}^{8}$ Moreover, the price divergence across different regions was also indication of the great challenges lying ahead in setting up a unified carbon market in China.
${}^{8}$ For more discussions on carbon capture, utilization and storage, see Chapters 3 and 4 of this study.
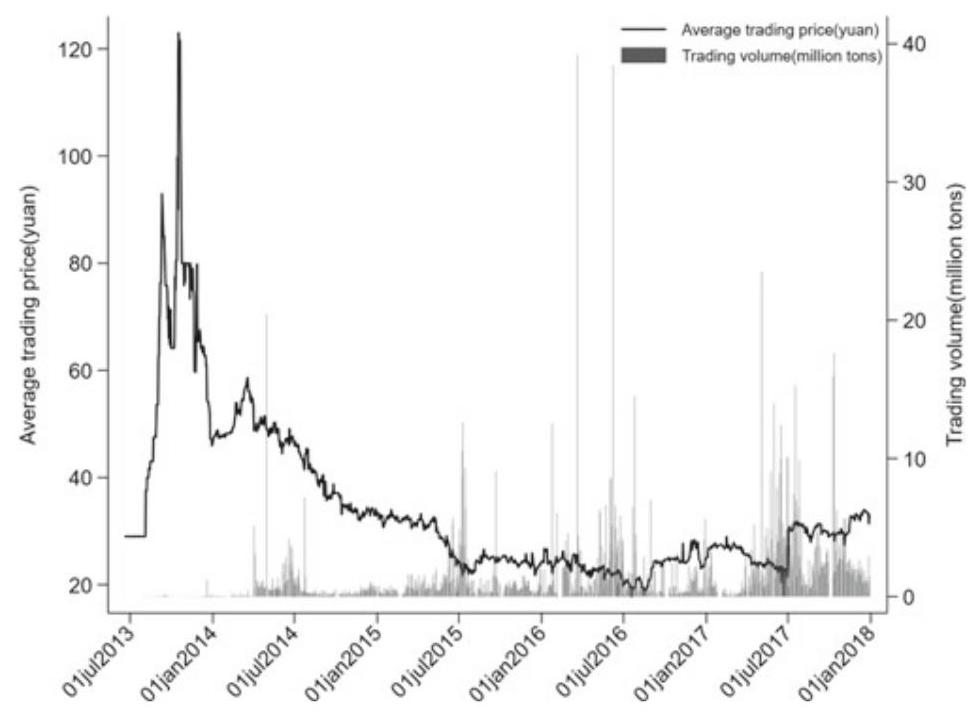
Fig. 3 Trends of emission permit trading in China. Data source http://k.tanjiaoyi.com/
For international comparative perspectives, average carbon price in EU-ETS was about RMB 100/ton (or US$ 16/ton) before 2018 and poised to rise significantly; ${}^{9}$ globally, the price range was between US$ 1/ton and US$ 130/ton (Fig. 3).
3 Section 3
3.1 Assessing ${\mathrm{{CO}}}_{2}$ Emission Reduction by ETS Pilots
In the previous two sections, we have reviewed the theoretical basis of carbon market and looked at the institutional designs and operational mechanics of China’s regional ETS pilots. In this section, building upon that knowledge, our aim is to go beyond mere descriptive statistics to assess the actual performance of the ETS pilots in reducing ${\mathrm{{CO}}}_{2}$ emissions. To increase the rigor of our examination beyond a prima facie case, we will deploy the method of synthetic control in our statistical analyses, trying to pin down the impact, if any, of the regional ETS pilots on the reduction of ${\mathrm{{CO}}}_{2}$ emissions. Strictly speaking, doing scientific experiments means that one must isolate variables, and in so doing, tests must proceed under strictly (often lab-) controlled conditions. The same logic would apply to serious policy studies by a trained eye-he or she must be keenly aware that real world knowledge based on inductive inference can never be deterministic, and worse, “controlled conditions” in policy settings at the aggregate level are elusive at best if not totally absent.
${}^{9}$ It reached 25 Euro per ton in 2019.
Mindful of these pitfalls, in the three subsections that follow, we will first introduce and then deploy the method of synthetic control. Second, we report investigation results based on that method. Third, we perform a placebo-like robustness test to check the confidence level of whatever impact we may find of the ETS pilots on the reduction of ${\mathrm{{CO}}}_{2}$ emissions.
3.2 Method of Synthetic Control
Frequently researchers are called upon to examine the effects of policy interventions, and in so doing they often resort to comparative case studies. But that job is easier said than done. For the challenge is that at the aggregate level how can the researcher seriously compare the results of an allegedly “affected” group vis- à-vis an allegedly “unaffected” group, when in fact there is no controlled group? Indeed, in our present case of ETS and ${\mathrm{{CO}}}_{2}$ emissions, it would be difficult to estimate ${\mathrm{{CO}}}_{2}$ reduction achievement of carbon trading in the absence of solid control groups.
In this context, we need relevant statistical tools and the method of synthetic control is helpful in estimating effects of policy settings where a single group (or a firm or a state) is exposed to policy intervention. The method of synthetic control was first developed and used by Abadie et al. Studies, employing the synthetic method, include the assessment of the economic impact of conflict in Basque (Abadie and Gardeazabal, 2003), the impact of tobacco control program on tobacco sales in California, USA, (Abadie et al., 2010), the economic impact of the 1990 German reunification on West Germany (Abadie et al., 2015). There are also many studies on China. Deploying synthetic control method, Liu and Fan (2018) have examined the economic impact of property tax in Chongqing. Zhang et al. (2016) have tried to respond to the query—“Did Olympic Games improve air quality in Beijing?” by using synthetic control method.
Drawing upon Abadie et al. (2010), for the purposes of our investigation of ETS, we build a model that has the rationale for synthetic control method. Assume that we have $M + 1$ regions, and region #1 is exposed to policy intervention (i.e., ETS in our case), then we have the remaining $M$ regions as control units. Let ${T}_{0}$ be the number of pre-intervention periods, with $1 < {T}_{0} < T$ . Assume ${Y}_{it}^{N}$ is the counterfactual outcome that would be observed for region i at time $t$ with the absence of policy intervention for unit ${\mathrm{s}}_{\mathrm{i}}$ , and time period ${\mathrm{s}}_{\mathrm{t}}$ . Let ${Y}_{it}^{I}$ be the outcome that would be observed for region i at time $\mathrm{t}$ with policy intervention in after ${T}_{0}$ . We also assume that the policy intervention has no effect on the outcome before the implementation period, so that for all $i$ in period $t \in \left\{ {1,2,\ldots ,{T}_{0}}\right\}$ , we would have that ${Y}_{it}^{N} = {Y}_{it}^{I}$ . Let ${\alpha }_{it} = {Y}_{it}^{I} - {Y}_{it}^{N}$ be the effect of the policy intervention for unit $i$ at time $t$ . Our aim here is to estimate:
$$ {\alpha }_{1t} = {Y}_{1t}^{I} - {Y}_{1t}^{N} $$where ${Y}_{it}^{I}$ is observed, so we only need to estimate ${Y}_{1t}^{N}$ . Let $\left( {\mathrm{M} \times 1}\right)$ be a vector of weights ${W}^{ * } = \left( {{w}_{2}^{ * },\cdots ,{w}_{j + 1}^{ * }}\right)$ such that ${W}_{m} \geq 0$ for $\mathrm{m} = 2,\ldots ,\mathrm{M} + 1$ and ${w}_{2} + \cdots + {w}_{M + 1} = 1$ . Each value of the vector ${W}^{ * }$ denotes a potential synthetic control, which corresponds to a particular weighted average of control regions. The value of the outcome variable for each synthetic control indexed by ${W}^{ * }$ is:
$$ \mathop{\sum }\limits_{{m = 2}}^{{M + 1}}{w}_{m}{Y}_{it} = {\partial }_{t} + {\theta }_{t}\mathop{\sum }\limits_{{m = 2}}^{{M + 1}}{w}_{m}{Z}_{m} + {\lambda }_{t}\mathop{\sum }\limits_{{m = 2}}^{{M + 1}}{w}_{m}{\mu }_{i} + \mathop{\sum }\limits_{{m = 2}}^{{M + 1}}{w}_{m}{\varepsilon }_{it} $$Abadie and his associates (2011) have proved that $\mathop{\sum }\limits_{{j = 2}}^{{J + 1}}{w}_{j}^{ * }{Y}_{jt}$ is an unbiased estimate of ${Y}_{it}^{N}$ , where ${T}_{0} < t \leq T$ . So ${\alpha }_{1t} = {Y}_{it} - \mathop{\sum }\limits_{{j = 2}}^{{J + 1}}{w}_{j}^{ * }{Y}_{jt}$ is the unbiased estimation of ${\alpha }_{1t}$ .
For the purposes of this investigation, the outcome variable of our interest is annual ${\mathrm{{CO}}}_{2}$ emissions. We calculated ${\mathrm{{CO}}}_{2}$ emissions based on energy consumption at provincial level by using energy consumption data in 1997-2017 period (Provincial Statistical Yearbook). Since China’s seven regional ETS pilots began operation in 2013, we mark 2013 as the year of policy intervention (i.e., ETS). This gives us 16 years of pre-policy intervention data. Based on the method proposed by CEADs, ${}^{10}$ we calculate annual ${\mathrm{{CO}}}_{2}$ emission level for all provinces in China.
To see the “synthetic” part of the method as a benchmark devise, let us take Hubei as an example. We use the synthetic control techniques described above to construct a “synthetic Hubei”. This synthetic Hubei is a best weighted average with a set of value predictors of carbon emissions in Hubei before policy intervention (i.e., ETS) began. In this context, the “synthetic Hubei” is meant to indicate the level of carbon emissions that we would have observed in the absence of ETS. We thus drop from the donor pool all the provinces/cities that have adopted ETS during the sample period (i.e., Beijing, Guangdong (including Shenzhen), Shanghai, Tianjin, and Chongqing). However, since some key economic indicators of Tibet and Ningxia are not available during sample period, a total of 23 provinces/cities have remained in our donor pool (Table 5).
Using the techniques described above, we construct a synthetic province/city one by one for Hubei, Guangdong (including Shenzhen), Tianjin, Shanghai, Beijing, Chongqing that mirrors the level of carbon emissions before ETS was put in place. Based on that, we estimate the emission reduction effect of policy intervention of ETS after 2013 as the difference in carbon emissions between real Hubei (with ETS) and synthetic Hubei (without ETS). We then perform a series of placebo tests to see whether or not the estimated effects of ETS are unusually large in light of the estimate distribution that we obtain by applying the same procedure to the provinces/cities in our donor pool. Finally, we repeat the same procedure for other ETS pilots-Guangdong (including Shenzhen), Beijing, Shanghai, Chongqing, and Tianjin.
3.3 Test Results
As explained above, by deploying the synthetic control method, we construct a synthetic Hubei as the combination of provinces/cities in our donor pool. This synthetic Hubei resembles Hubei in terms of predictor of ${\mathrm{{CO}}}_{2}$ emissions before policy intervention (i.e., ETS). Table 4 exhibits the test results, which have compared the features of real Hubei with synthetic Hubei before policy intervention. The same comparison includes the other regional ETS pilots. Table 5 shows the weights of all control provinces/cities for each ETS pilot.
10 China Emission Accounts & Datasets: https://www.ceads.net/.CEADs is made of a group of experts from the UK, the US, and China who have worked on China’s emission accounting
Table 4 Economic features of real pilots versuss synthetic pilots
| HB | HB_syn | BJ | BJ_syn | SH | SH_syn | TJ | TJ | CQ | CQ_syn | GD | GD_syn | |
| GDP | 7862.2 | 7887.3 | 7172.3 | 5186.2 | 9186.0 | 9141.2 | 4385.7 | 3414.2 | 4029.2 | 4048.1 | 23,489.4 | 17,520.6 |
| GDP_per | 13,703.1 | 13,746.8 | 42,862.0 | 17,454.5 | 47,094.2 | 21,964.8 | 37,534.3 | 14,944.7 | 13,678.4 | 13,286.3 | 24,596.6 | 24,505.5 |
| Population | 5742.4 | 5759.0 | 1544.7 | 2108.6 | 1848.4 | 3309.1 | 1086.8 | 1979.9 | 2850.1 | 2860.6 | 9033.3 | 6532.9 |
| Sec_rate | 42.6 | 42.8 | 29.9 | 33.5 | 46.5 | 50.4 | 52.8 | 48.9 | 44.2 | 44.3 | 48.4 | 49.0 |
note 1 sec rate refers to second industry as share of total GDP; 2. Data source China statistical yearbook
Table 5 Synthetic weight for synthetic pilots
| Region | Hubei_weight | Beijing_weight | Shanghai_weight | Tianjin_weight | Chongqing_weight | Guangdong_weight |
| Anhui | 0.036 | 0 | 0 | 0 | 0.027 | 0 |
| Fujian | 0.025 | 0 | 0 | 0 | 0.03 | 0 |
| Gansu | 0.019 | 0 | 0 | 0 | 0.047 | 0 |
| Guangxi | 0.033 | 0 | 0 | 0 | 0.031 | 0 |
| Guizhou | 0.025 | 0 | 0 | 0 | 0.042 | 0 |
| Hainan | 0.096 | 0.682 | 0 | 0 | 0.08 | 0.144 |
| Hebei | 0.026 | 0 | 0 | 0 | 0.02 | 0 |
| Heilongjiang | 0.018 | 0 | 0 | 0 | 0.034 | 0 |
| Henan | 0.045 | 0 | 0 | 0 | 0.015 | 0 |
| Hunan | 0.059 | 0 | 0 | 0 | 0.023 | 0 |
| InnerMongolia | 0.024 | 0 | 0.018 | 0 | 0.036 | 0 |
| Jiangsu | 0.057 | 0 | 0 | 0 | 0.012 | 0.856 |
| Jiangxi | 0.025 | 0 | 0 | 0 | 0.034 | 0 |
| Jilin | 0.017 | 0 | 0 | 0.566 | 0.04 | 0 |
| Liaoning | 0.024 | 0 | 0 | 0 | 0.026 | 0 |
| Qinghai | 0.013 | 0 | 0.352 | 0.381 | 0.301 | 0 |
| Shaanxi | 0.02 | 0 | 0 | 0 | 0.036 | 0 |
| Shandong | 0.027 | 0 | 0 | 0 | 0.01 | 0 |
| Shanxi | 0.017 | 0 | 0 | 0 | 0.039 | 0 |
(continued)
Table 5 (continued)
| Region | Hubei_weight | Beijing_weight | Shanghai_weight | Tianjin_weight | Chongqing_weight | Guangdong_weight |
| Sichuan | 0.322 | 0 | 0 | 0 | 0.02 | 0 |
| Xinjiang | 0.021 | 0 | 0 | 0 | 0.043 | 0 |
| Yunnan | 0.025 | 0 | 0 | 0 | 0.036 | 0 |
| Zhejiang | 0.029 | 0.318 | 0.629 | 0.052 | 0.02 | 0 |
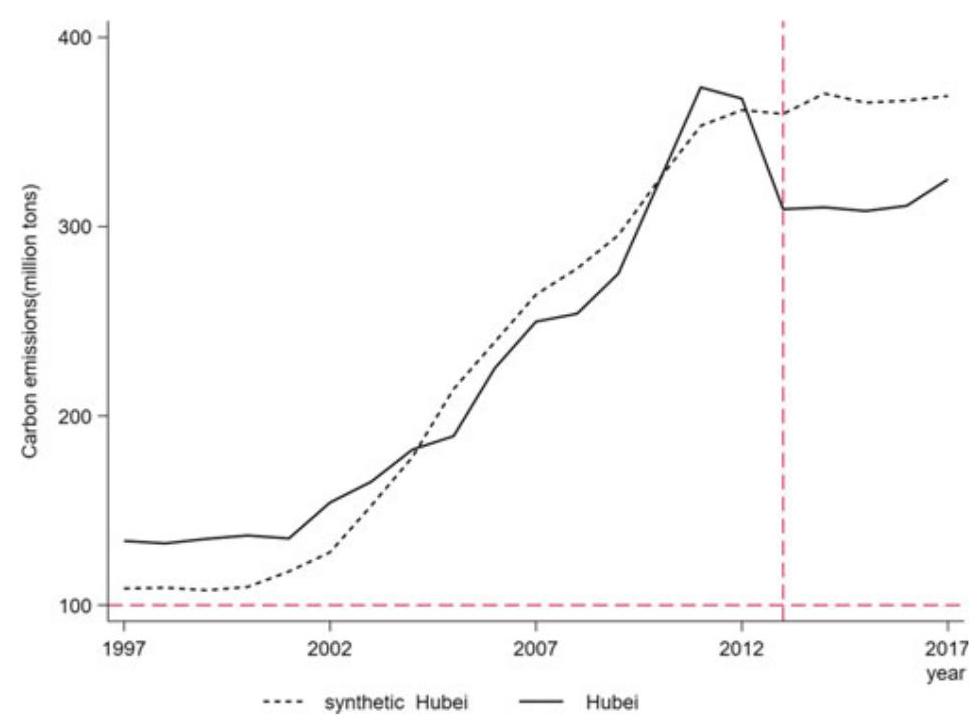
Fig. $4{\mathrm{{CO}}}_{2}$ emissions between Hubei and synthetic Hubei
Due to significant variations of social and economic conditions across different regions in China, we have divergent synthetic results. Generally speaking, the closer to the China’s average level, the better the synthetic results. For instance, Hubei and Guangdong have displayed better synthetic results than that of the other pilots.
Figure 4 shows the trend of carbon emissions in real Hubei and synthetic Hubei. The result shows that after 2013, carbon emissions in real Hubei and synthetic Hubei diverged significantly. For impact assessment at a higher level of granularity, so that causal link has a higher degree of certainty, we also apply the same procedure to specific industries, i.e., non-ferrous metals, ferrous metals, electricity industry and six polluting industries ${}^{11}$ in Hubei ETS pilot. The results also demonstrate that these industries in Hubei have all reduced carbon emissions substantially (Fig. 5). ${}^{12}$
methods and applications. They provide most up-to-date carbon emission, social, economic, and trade data.
${}^{11}$ Six polluting industries include electric power, ferrous metals, nonferrous metals, raw chemical materials and chemical products, nonmetal mineral products, petroleum processing and coking.
${}^{12}$ High granularity, industry-specific investigations are particularly important because they may yield insights in terms of cross-region homogeneity or heterogeneity. These insights, if
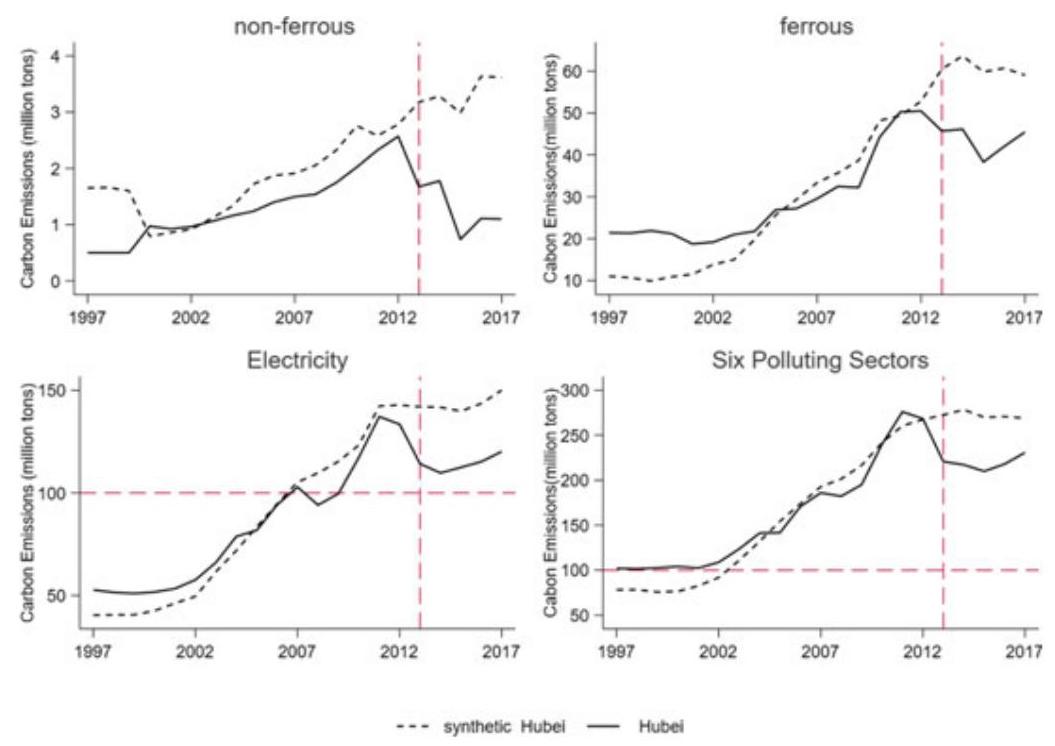
Fig. $5\;{\mathrm{{CO}}}_{2}$ emissions of polluting industries between Hubei and synthetic Hubei
Likewise, Fig. 6 shows that before 2013, the synthetic data fits the actual data reasonably well in the case of Guangdong as well. After 2013, however, the two lines began to diverge significantly, indicating that Guangdong ETS pilot had made a significant difference in the reduction of carbon emissions.
In the previous section, we have learnt that in terms of trading volume, trading turnover, and active ratio, Hubei and Guangdong (including Shenzhen) scored higher than other regional ETS pilots. Our synthetic test results support our expectation or validate our hypothesis, that is, more trading volume leads to higher levels of emission reduction.
By contrast, the case of Tianjin shows very different results. Figure 7 plots trends of carbons emissions in real Tianjin and synthetic Tianjin. However, the test result shows that since 2013, carbon emissions in real Tianjin and synthetic Tianjin did not differ notably. The result comes as no surprise. As discussed in the previous section, Tianjin ETS pilot was way below average among the seven regional ETS pilots in many performance indicators.
When the same procedure is applied to Beijing, Shanghai, and Chongqing, we cannot get clear-cut simulation results, indicating that it is perhaps too early to assess the actual performance of their ETS pilots at this moment. Or perhaps there are other “noises” that are not factored in and controlled for in our tests. For instance, in the case of Beijing, the dramatic bifurcation between real Beijing and synthetic Beijing had stated around 2008, indicating that there had been much more powerful forces going on other than mere the setup of ETS (Fig. 8). One plausible explanation may have to do with the hosting of Olympic Games in 2008, which had prompted Beijing to relocate much of its manufacturing out of Beijing proper.
any, can help in designing strategies of convergence between regional and national ETSs in the future.
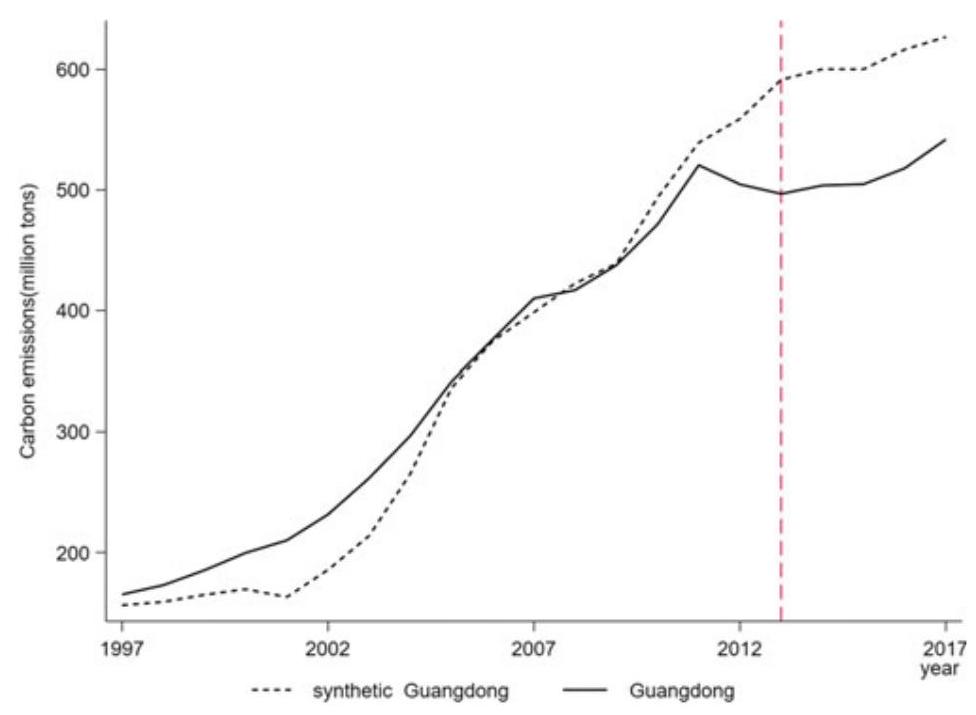
Fig. $6{\mathrm{{CO}}}_{2}$ emissions between Guangdong and synthetic Guangdong
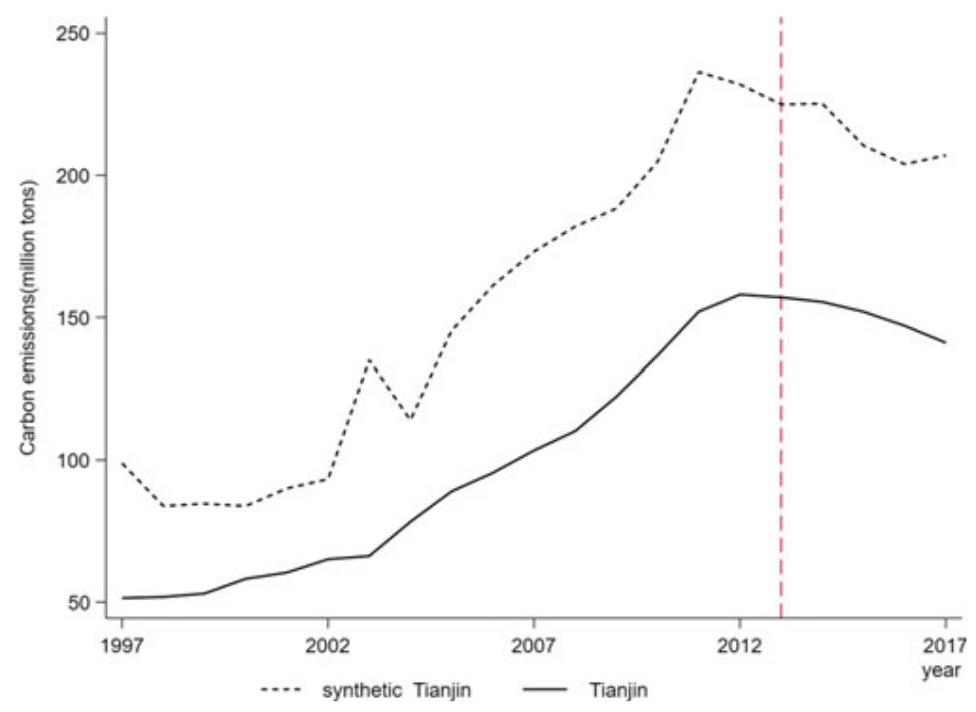
Fig. $7{\mathrm{{CO}}}_{2}$ Emissions between Tianjin and synthetic Tianjin
And in the case Shanghai, the bifurcation-also very dramatic-had happened even earlier, around 2002 (Fig. 9), which warrants further investigation. Anyway, we must continue to watch Shanghai ETS carefully. Shanghai’s sophisticated dual deployment of grandfathering and auction of ${\mathrm{{CO}}}_{2}$ emission permits and its high compliance rate indicates that it has a nuanced understanding the role of state vis-à-vis that of the market, which normally would lend the city well to address issues related to climate change. After all, it takes both the state and the market to deal with the challenge of climate change and, as our theoretical discussion in Section I indicates, at the axiomatic level of carbon market is politics or public policy. It ultimately goes back to the question raised by Ronald Coase, i.e., where do we draw the line between the state and the market?
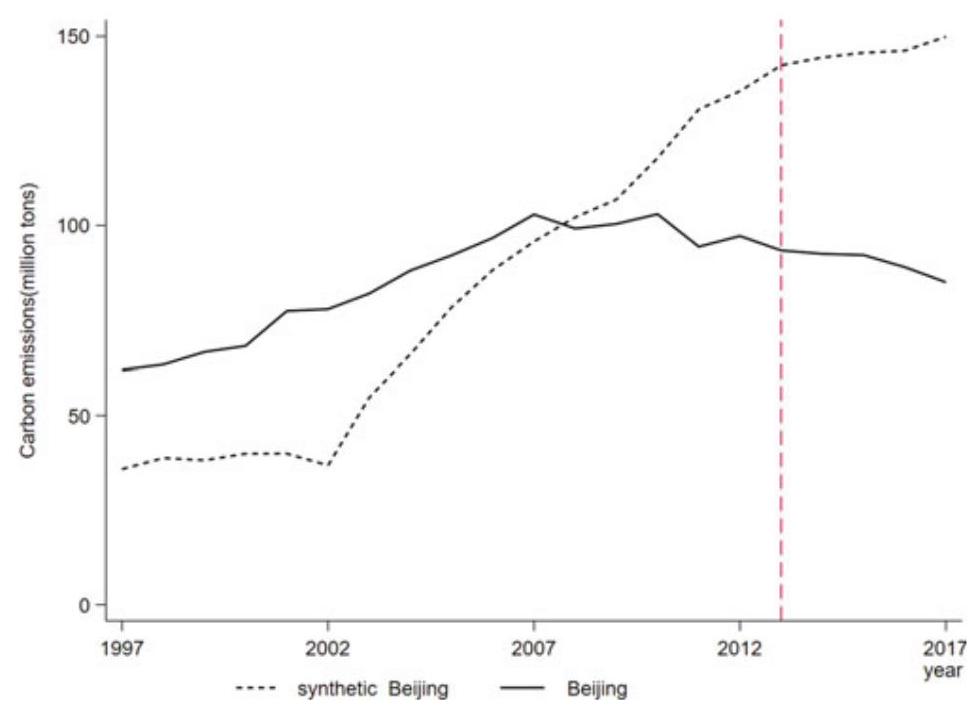
Fig. $8{\mathrm{{CO}}}_{2}$ emissions between Beijing and synthetic Beijing
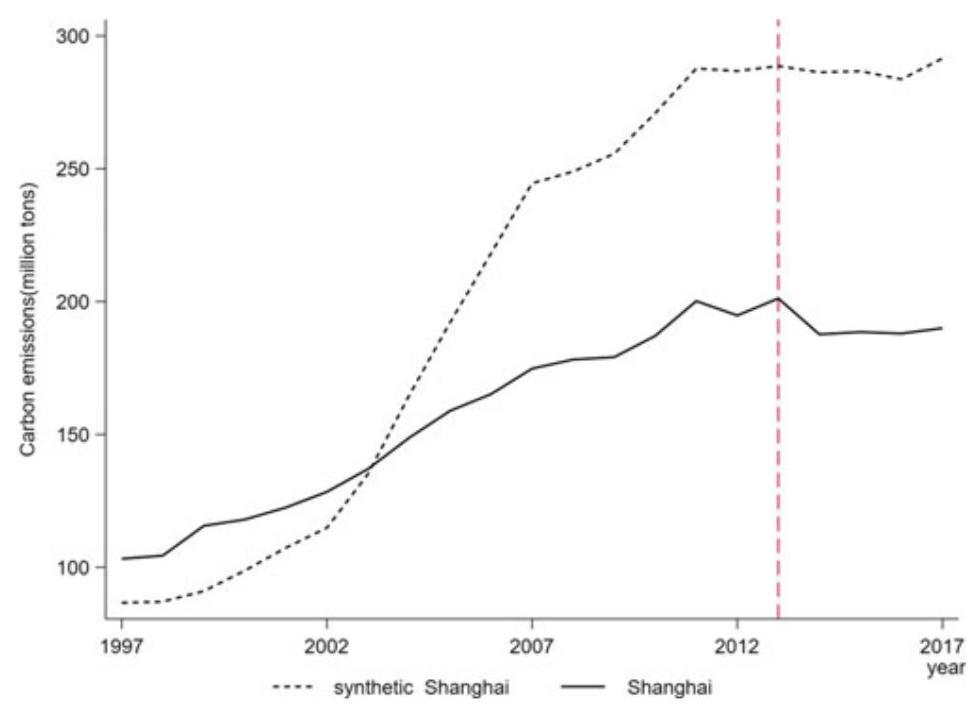
Fig. $9{\mathrm{{CO}}}_{2}$ emissions between Shanghai and synthetic Shanghai
By comparison, the test result for Chongqing is not compelling, and we put it in the Appendix.
3.4 Robustness Test
To increase confidence level to our analyses, we also perform robustness test here. Let us begin by looking at Hubei ETS pilot again. As previously discussed, the test results we obtained by deploying the synthetic control method demonstrated that there was a significant gap of carbon emissions between synthetic Hubei and real Hubei. But how reliable are these results? As an exercise of inductive inference, our knowledge thus obtained can never be deterministic. Indeed, it all boils down to a matter of probability. In this context, a placebo test is appropriate, and it can be regarded as a permutation test in statistics. Our hypothesis testing here is to check statistical significance of our results. In other words, what is the probability that other provinces/cities showing as large a gap as Hubei ETS pilot does between Hubei and synthetic Hubei?
To answer the question, we employ the synthetic control method to estimate the effect of policy intervention of ETS on every other province/city. First, we need to drop the provinces/cities that show a poor fit for original data prior to the year when ETS began. Our concern is that even if the gap may not be caused after the policy intervention, it may result from the poor fitness before the policy intervention. Therefore, we have to drop the provinces/cities whose MSPE (mean square percent error) prior to 2013 is larger than 100. Finally, having done these procedures, we have 22 provinces in total as potential control units.
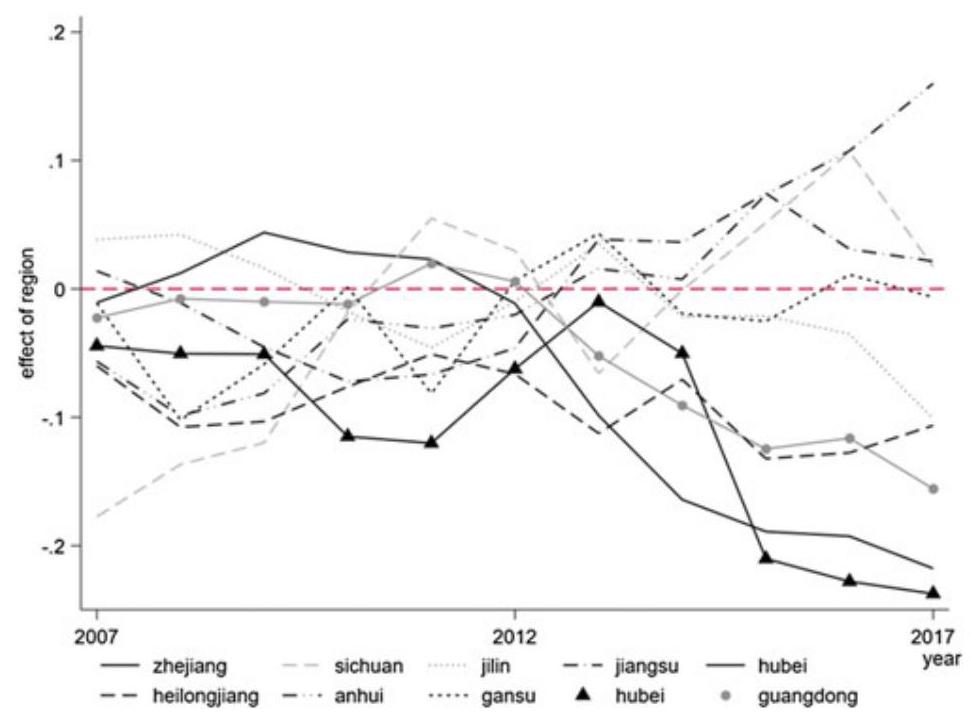
Fig. 10 Placebo test
Figure 10 displays the placebo or permutation test results.
Here, each province/city is taken as a policy-intervened entity each time, with systematic comparison of carbon emissions between real and synthetic situations. From the test results, we can see that Hubei province is below the zero lines, which indicates that the probability of seeing a gap of Hubei’s level in our dataset is $1/{22}$ , or statistically significant only at ${4.5}\%$ or so. Conversely, these test results would increase our confidence level when we say that policy intervention in Hubei in the form of ETS has made a difference in reducing carbon emissions, even though it is still in early stage.
However, the same thing cannot be said-i.e., with the same level of confidence-for Chongqing (see Fig. 11 in Appendix)and Tianjin at this stage of development. In the case of Beijing and Shanghai, as discussed above, their situations seem to be more complex, and further investigation (e.g., field research) is needed. For the time being, however, in the case of Shanghai, the mixed use of grandfathering and auction in terms of carbon emission permits, together with high rates of compliance, indicates that Shanghai, itself already a financial center, is more sophisticated in setting up a robust MRV system in a cost-effective way. The point here is that while MRV system is vital to ETS, MRV itself is not transaction cost-free. Thus, efforts should be made to minimize the transaction cost in the future design of China’s national ETS.
4 Section 4
4.1 Main Takeaways
At this early stage of construction of carbon market in China, there is initial evidence that the regional ETS pilots are not liquid enough to function well. Trading was low, price was low, and firms did not appear to be enthusiastic about carbon trading. For one thing, information disclosure and transparency have much room for improvement. For another, as regional ETS pilots, policy constraints exist and indeed prohibit cross-region emissions trading, and as a result, carbon price varies significantly across different regions. Arguably, this has made China’s carbon market less attractive to potential investors, especially large institutional investors.
There is also evidence that the level of awareness of and participation in these regional ETS pilots has remained low. It is especially noteworthy that in the month just before the compliance date there is a sudden and one-time high trading volume. This perhaps indicates that most of the firms would take emissions trading as political cooperation rather than investment opportunity. Carbon assets are not considered valuable for many firms, which arguably is both a cause and effect of low carbon price in China. Overall, the average carbon price among all seven ETS pilots remained low, about RMB 30/ton—perhaps too low for firms seriously to consider strategic shifts towards a low-carbon growth path. ${}^{13}$ By comparison, carbon price in the US and EU was about US$ 15-16/ton (World Bank Group, 2018) and is expected to rise rapidly in the years to come.
${}^{13}$ However, in 2020 the Chinese government made a new pledge to international community to peak carbon emission prior to 2030 and achieve carbon neutrality by 2060. In light of this, it is expected that carbon price would rise more rapidly under much harder constraints of “cap and trade” scheduled over the next 40 years, thus generating more pressure for fossil-fuel heavy firms to plan and shift more aggressively towards green growth. The new pledge also indicates that the centrality of China’s climate policy in terms of international commitments has shifted from one that emphasized “carbon equity” to one that aims at “carbon neutrality”.
Our analyses show that while success of these regional ETS pilots at this stage is very limited, it still varies considerably across different regions. Among the seven regional ETS pilots, Hubei is the best performer, and it has reduced about 59 million tons of ${\mathrm{{CO}}}_{2}$ emissions in 2015. Guangdong and Shenzhen have done reasonably well, each having reduced about 37 million tons of ${\mathrm{{CO}}}_{2}$ emissions in 2015. In the case of Beijing and Shanghai, the effects of ETSs, while not immediately visible, may have been overwhelmed by earlier policy inventions (e.g., holding 2008 Olympics in Beijing), which warrants further (field-trip) investigations beyond our current setup of econometrics. However, Tianjin has performed poorly during the same period.
Why? Some preliminary explanations are handy. Hubei has been a province with a progressive environmental agenda. In 2009, a pilot program for converting punitive levy of pollution to environmental tax was launched in Hubei. Zheng’s research (2015) indicates that such pilot programs significantly reduced domestic pollutions, which might also have better prepared industrial firms in Hubei for the carbon trading scheme. During the whole era of reform and opening-up, Shenzhen has always been China’s leading city in innovations and was China’s first city to realize its “Blue Sky Plan.” The general orientation of the government and the business sector of Shenzhen are market-driven, and so is Guangdong province. As such, the relatively good performance of Guangdong ETS pilot comes as no surprise. At the moment, we do not know exactly what is going on in Tianjin. Anyway, its low trading volume indicates that Tianjin is not ready as an active player in the carbon market in China. A plausible cause may have to do with firm ownership and industrial structure of the city for historical reasons. Deeper research is needed here.
4.2 Policy Recommendations
The ETS is purported to give China additional market-based tools to realize its Paris commitments. Since 2013, seven regional ETS pilots have been launched to test their validity in the context of China. According to China’s overall roadmap of ETS construction, if these ETS pilots are successful during the first phase of construction (2011-2017), China would scale up them to the national level by the end of 2017 and begin the second phase (2017-2020) of construction of carbon market. In this context, our study represents an initial assessment of these regional ETS pilots, with an aim to provide lessons for the construction of a future unified ETS at the national level. We find that the success so far is limited and uneven amongst the seven regional ETS pilots, which warrants further investigation into the underlying causes.
The limited and uneven success of these regional ETS pilots calls for caution when thinking about nationwide expansion of carbon market. More systematic evaluation and deeper investigation should be conducted to pin down the underlying social and economic causes before decision of expansion to the national level is made.
To begin with, information transparency about actual carbon emissions is necessary. There, China urgently needs to build up a sophisticated system of monitoring, reporting, and verification (MRV) for corporate ESG (environment, social responsibility, and corporate governance), including the training of manpower. Indeed, a clean, reliable and robust MRV system is an integral part of the basic infrastructure of ETS. This is especially important when China launches a national ETS in the near term (in 2020), and in the medium- and long-term, integrates its ETS with international ETSs. In short, a unified digital MRV system should be treated as a prerequisite for current regional ETSs to scale up to a higher level in the future. ${}^{14}$ Here, regional and international cooperation and coordination with an aim to converge (rather than diverge) in the future is desired. This is especially the case were it also to reduce risks and facilitate long-term cross-border business investments. Besides, there are other two points to make at this moment, and they are as follow:
First, the limited achievement of ETS pilots triggers a more fundamental issue. That is, the role of local government officials. Indeed, it has been long argued that the incentive for local government officials has been the weakest link in the value chain of environmental protection in China. So far, the principal pursuit of Chinese local government officials is economic growth measured by GDP rather than long-term concerns of sustainable development. The ETS scheme will probably not be sufficient to alter the behavior of local government officials especially when carbon emission permits are distributed in a fashion of grandfathering. Indeed, there is initial evidence that those with auctions (e.g., Shenzhen, Guangdong, Hubei) performed better than those without (e.g., Chongqing, Tianjin) among the seven regional ETS pilots.
In the future, a priced carbon permit should be tested in ways similar to that of EU-ETS, where auction is allowed and the proportion of auction (relative to free allowances) gradually goes up over time. It might even be better if a carbon tax scheme be tested as an additional policy tool. France, for instance, imposes carbon tax of US$ 55/ton and so does Norway at US$ 64/ton. ${}^{15}$
${}^{14}$ Understandably, the building of the data centers of digital MRV system for these regional ETS pilots would be an incremental process. But to think and plan ahead, these data centers as critical backbones of ETS networks should go green themselves. That is, they should not be driven by fossil energy but by renewable energy.
Second, the uneven success across the seven regional ETS pilots may reflect regional variations in firm ownership and industrial structure due to historical reasons. If it is true, caution is needed when one considers scaling-up regional ETS pilots to a unified national carbon market in China after 2017. It would seem that a big bang rather than a gradual approach is not appropriate. A better approach has to be sector-sensitive with phase-in mechanisms. More specifically, it would allow different phase-in periods for various sectors in the national ETS, while at the same time keeping some region-specific industries in the regional ETSs before the two systems-the national and the regional ETSs-converge incrementally and eventually join tracks in the long-run. The same approach should also apply to forging links with international ETSs in the long run.
Indeed, as we discussed earlier in the chapter, EU-ETS has phase-in designs, although the industrial structure of its member states is far more homogeneous than that of China. Otherwise, as unintended consequences, we may run the risk of making rich regions richer and poor regions poorer. In the meantime, fiscal subsidies or transfers across regions by the central government may serve as remedial measures to ameliorate the problem, one may argue. But ultimately, these measures contradict-or at least generate tensions with-the market principle of equality if and when China tries to join international ETSs in the long run. Beware of these tensions, as one moves forward.
That said and looking ahead, we would recommend that the overall approach to market-building of ETS should move with a vector from regional equilibrium to general equilibrium. In other words, given the experience gained thus far from these regional ETSs, what China should do years down the road is to build not just a simple and static model of “cap & trade” but a complex and dynamic model somewhat along the line from RICE to DICE model developed by Nobel Laureate in economics Nordhaus (2000). ${}^{16}$ The complex model should simultaneously consider the economic, political, and institutional aspects of environmental intervention, along with international cooperation and coordination. Indeed, facing the enormous challenge of climate change, what is needed is not just breakthrough “hardware technologies” but also “sophisticated institutional technologies” to reduce GHG on this small village that we call Earth (Fu, 2009).
${}^{15}$ Of late the EU has started to consider imposing CBAM taxes (or cross border adjustment mechanism) to avoid carbon leakage. Although difficulties still exist at the moment in terms of data availability and exact calculations, if that happens, it would have immediate impact on Chinese exports, e.g., steel products. The long process of steelmaking (BF/BOF), which still dominates the Chinese steel sector (about 90%) is much more carbon intensive than the short process (EAF). EAF accounts for about 47% globally, excluding China. See Chapters 2, 3 and 4 of this book. Ceteris paribus, in case of imposing cross-border carbon tax, the global market share of Chinese steel exports would be squeezed.
${}^{16}$ RICE and DICE are a pair of models integrating climate change with economics developed by William Nordhaus, a 2018 Nobel Prize winner in Economic Sciences. RICE stands for regional dynamic integrated model of climate and the economy, whereas DICE stands for dynamic integrated model of climate and the economy.
Appendix
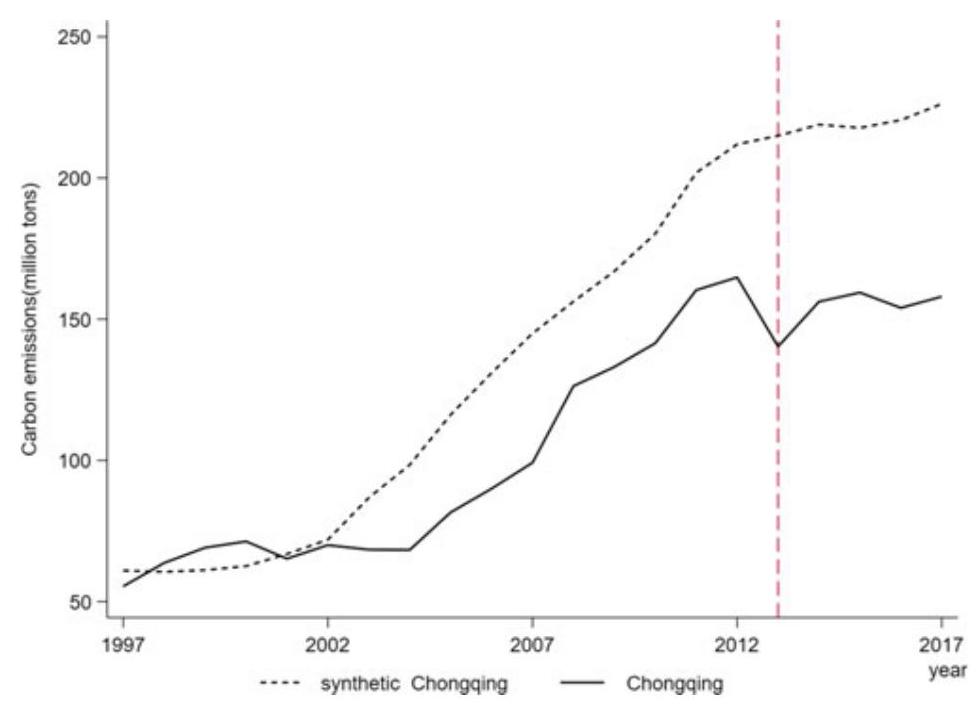
Fig. 11 ${\mathrm{{CO}}}_{2}$ emissions between Chongqing and synthetic Chongqing
Acronym Full spelling
CBAM Cross border adjustment mechanism
CCER China certified emission reduction
CCX Chicago climate exchange
DICE Dynamic integrated model of climate and the economy
ESG Environment, social responsibility, and corporate governance
ETG Emissions Trading Group
ETS Emission-trading system
EU-ETS European union greenhouse gas emission trading system
FYR Five year plan
GHG Greenhouse gas
KPI Key performance indicators
MRV Monitoring, reporting and verification
MSPE Mean square percent error
NDRC National development and reform commission
NSW National Trust of Australia
RICE Regional dynamic integrated model of climate and the economy
UNFCCC United Nations framework convention on Climate Change
References
Abadie, A., & Gardeazabal, J. (2003). The economic costs of conflict: A case study of the basque country. American Economic Review, 93(1), 113-132.
Abadie, A., Diamond, A., & Hainmueller, J. (2010). Synthetic control methods for comparative case studies: Estimating the effect of california’s tobacco control program. Journal of the American Statistical Association, 105(490), 493-505.
Abadie, A., Diamond, A. J., et al. (2015). Comparative politics and the synthetic control method. American Journal of Political Science, 59(2), 495-510.
Ando, M. (2015). Dreams of urbanization: Quantitative case studies on the local impacts of nuclear power facilities using the synthetic control method. Journal of Urban Economics, 85(C), 68-85.
Coase, R. H. (1960). “The Problem of Social Cost”. Journal of Law and Economics, The University of Chicago Press, vol. 3, October, 1-44.
Duan, M., Tao, P., & Zhang, X. (2014). Review of carbon emissions trading pilots in China. Energy & Environment, 25, 527-550.
European Commission. (2003). Directive 2003/87/87/EC of the European Parliament and of the Council of October 2003 establishing a scheme for greenhouse gas emission allowance trading within the Community and amending Council Directive 96/61/EC.
European Commission. (2015). EU ETS handbook. European Commission.
Fu, J. (2009). The Dao of the Wealth of Nations. Peking University Press. p 373.
Kossoy, A., Oppermann, K., Platonovaoquab, A., et al. (2015). State and trends of carbon pricing. World Bank Group Climate Change, Washington DC: October 2015.
Mideksa, T. K., & Weitzman, M. L. (2019). Prices versus quantities across jurisdictions. Journal of the Association of Environmental and Resouce Economisits., 6(5), 883-891.
Liu, J., & Fan, Z. (2018). Research on the influence of industrial transfer from the property taxes: Empirical research from Chongqing and Shanghai(in Chinese). China Industrial Economics, 11, 98-116.
Nordhaus, W. D., & Boyer, J. (2000). Warming the world: economic models of global warming. The MIT Press (2000).
Pang, T., & Duan, M. (2016). Cap setting and allowance allocation in China’s emissions trading pilot programs: Special issues and innovative solutions. Climate Policy, 16, 815-835.
Pigou, A. C. (1929). The economics of welfare. London: MacMillan and Co., Ltd.
Spence, A. M., & Weitzman, M. L. (1978). Regulatory strategies for pollution control. In: A. F. Friediaender (Ed.), Approaches to controlling air pollution. Cambridge MA: MIT Press.
Stavins, R. (2001). experience with market-based environmental policy instruments. Resource for the Future.
UNFCCC. (1998). Kyoto protocol to the United Nations framework convention on climate change. United Nations. Available at http//unfccc.int/Convkp/kpeng/kpeng.pdf.
Weitzman, M. L. (1974, October). Prices vs. Quantities. The Review of Economics Studies, 41(4), 477-491.
Weitzman, M. L. (2012). GHG targets as insurance against catastrophic climate damages. Journal of Public Economic Theory., 14(2), 221-244.
Weitzman, M. L. (2017). On a World Climate Assembly and the Social Cost of Carbon. Economica, 84(336), 559-586.
World Bank Group. (2018). State and trends of carbon pricing 2018 (p. 2019). World Bank Group.
Zhang, J., Zhong, C., & Ming, Y. (2016). Did Olympic Games improve air quality in Beijing? Based on the synthetic control method. Environmental Economics and Policy Studies, 18, 21-39.
Design Options of ETS: How to Incentivize CCUS
Mengfei Jiang, Xi Liang, Ming Lei, Francisco Ascui, Qianguo Lin, Muxin Liu, and Li Wang
The urgency of rapid and ambitious climate action was underscored in IPCC Special Report on ${1.5}{}^{ \circ }\mathrm{C}$ . In the report, IPCC also emphasized that strong carbon price signals, coupled with further policy instruments, can support ambitious and cost-effective ${\mathrm{{CO}}}_{2}$ emission reductions. As contracting states to the Paris Agreement look to implement their domestic climate policies, carbon markets are emerging and evolving to fill an important role in their strategic transition to a green economy. Worldwide, carbon markets, or emissions trading systems (ETS), have become a critical part of the policy response. China is no exception. As the previous chapter discussed, China rolled out 7 regional ETS pilots in 2013. Subsequently, as this chapter will discuss as a follow-up, China’s national ETS was launched in 2017 and was expected to become operational around ${2020.}^{1}$
${}^{1}$ At the time when this study went to the press, on July 16,2021, China’s national ETS officially went into operation, covering 2162 power plants and over 4 billion tons of carbon emissions annually. It thus became the largest of the 31 ETSs currently extant in the world. Whereas Beijing hosted China’s national ETS center, Shanghai was tasked with trading, and Hubei with registration. The price of the first deal on that day was RMB52.78/tCO2-much higher as compared to the average price of about RMB40/tCO ${}_{2}$ of China’s 7 regional ETS pilots in past two years. It has been expected that China’s national ETS will eventually cover petrochemical, chemical, building material, iron/steel, nonferrous, paper-making, and aviation industries as well.
M. Lei ( )
School of Management, Peking University, Beijing, China
M. Jiang - X. Liang - F. Ascui - Q. Lin
University of Edinburgh Business School, Edinburgh, UK
M. Liu - L. Wang
UK-China (Guangdong) CCUS Center, Guangzhou, China
According to the International Energy Agency (IEA), the steel sector accounts for over 5% of global anthropogenic GHG emissions. China is the largest steel producer in the world, accounting for about 51% of global crude steel production in 2018. Currently, the steel sector accounts for over 10% of China’s total domestic anthropogenic ${\mathrm{{CO}}}_{2}$ emissions, making it the third largest source of ${\mathrm{{CO}}}_{2}$ emissions in China-after power and cement. How best to decarbonize the steel sector in China in the years ahead? Essentially, there are basic four pathways to de-carbonize the iron/steel sector: (a) switching to zero-emission fuels (e.g., hydrogen), (b) improving energy efficiency, (c) structural adjustment (e.g., from long to short process), and (d) implementing carbon capture, utilization and storage (CCUS). ${}^{2}$ As pathway (a) would incur large costs to change the exiting outlay of the steeling making process, thus far China has largely relied on pathways (b) and (c); but the marginal effects of (b) and (c) have been on the decline. In this context, one would expect that pathway (d), i.e., CCUS, will increasingly become important in the years ahead.
Building upon previous discussions on carbon market in Chapter 5, the aim of this chapter is to further explore CCUS in connection with ETS. Specifically, the central question is: as China continues to build a national carbon market based on the experience of 7 regional ETS pilots, how could different design options of ETS incentivize CCUS application in the steel sector, given the fact that the current cost of CCUS has remained high in spite of cost reductions in recent years? To answer this question, we will put Chinese experience in a broader international perspective.
This chapter is organized into four sections. For international comparisons, Section 1 begins by briefly reviewing the key design elements of international experience. Section 2 then looks at the current designs and operations of ETS pilots in China Drawing heavily on EU experience, Section 3 introduces and analyses three different design options of ETS in connection with financing schemes of CCUS in the iron/steel sector. Conclusions follow in Section 4.
1 Section 1
1.1 Key Design Elements of ETS in International Perspective
Essentially, there are two generic approaches to emissions trading system (ETS) (see Fig. 1): cap-and-trade and baseline-and-credit systems. In cap-and-trade, a regulator sets the total amount of emissions that can be emitted during a certain period (the cap) by issuing a limited number of allowances to emit. At the end of each compliance period, covered entities ${}^{3}$ Covered entities are defined as installations in EU-ETS and as enterprises in China’s ETS must surrender allowances equal to their emissions during a certain period. ${}^{4}$ Covered entities could acquire allowances directly from the regulator (primary market) or from other participants by trading in the secondary market. Allowance allocation is the key to a successful carbon market (Xiong et al., 2015). Most ETSs around the world have started with free allocation but gradually transitioned to a higher percentage of allowances being auctioned. ${}^{5}$ Regulators usually apply one of two different allocation methods to allocate free allowance to covered entities: grandfathering and benchmarking.
${}^{2}$ For more on CCUS, see Chapters 3 and 5 of this book.
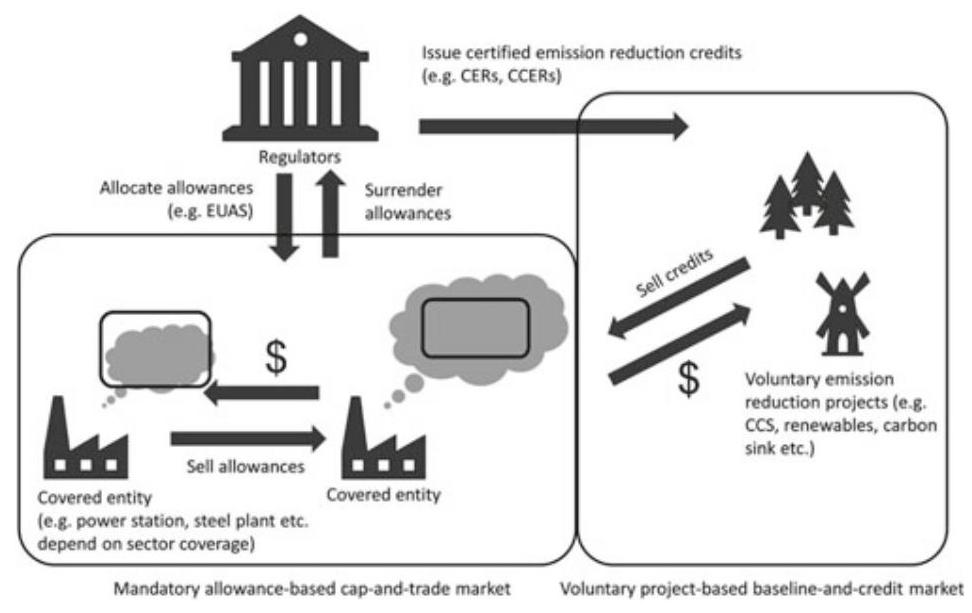
Fig. 1 Operation mechanism of ETS
${}^{3}$ For more on CCUS, see Chapters 3 and 4 of this book.
${}^{4}$ The total amount of emission allowances could be offset by certified emission reduction if there is a flexible mechanism for compliance.
${}^{5}$ For example, in EU-ETS, the power sector started off with ${95}\%$ free allocation of emission allowance in 2005 but gradually transitioned to 100% auctioning by 2013 (ICAP, 2019b). In China, the pilot ETS in Guangdong province required the power sector to purchase 3% of its emission allowances when the ETS started in 2013 (ICAP, 2019a).
Grandfathering is based on the enterprises’ historical emissions or emission intensities, while benchmarking is based on a benchmark emission intensity at the sector or sub-sector level. A baseline-and-credit approach depends on there being some source of voluntary or regulated demand for offset credits from emission reduction projects. The Kyoto Protocol Clean Development Mechanism (CDM) was an international baseline-and-credit mechanism that allowed emission reduction projects in developing countries, including China, to earn offset credits known as Certified Emission Reductions (CERs) that developed countries could purchase and use to partially fulfil their Kyoto Protocol emission reduction targets.
2 Section 2
2.1 Current Designs and Operations of ETS Pilots in China
China started pilot emissions trading schemes in 2013, and the first seven pilot schemes (Beijing, Shanghai, Shenzhen, Tianjin, Chongqing, Hubei and Guang-dong) have further developed their ETSs by expanding coverage, refining their allocation mechanisms, and introducing derivative products in the past few years. Many other provinces which were not included in the first seven pilot markets (such as Jiangsu, Xinjiang, Zhejiang provinces) have been interested in establishing their own schemes, and Fujian launched its own ETS in late 2016. By the end of April 2018, 222 MtCO2 equivalents of allowances had been traded in the primary and secondary ETS markets in China, with a value of RMB 5 billion (circa. US$ 725 m) (World Bank Group, 2019).
Most ETSs in China only cover ${\mathrm{{CO}}}_{2}$ emissions, apart from Chongqing, which covers six GHGs (see Table 1). All Chinese pilot ETSs cover both direct and indirect emissions. Covered emission sources in these pilots are defined as enterprises, rather than installations or facilities as in the EU-ETS (ICAP, 2019a). As discussed in the previous chapter, China is a country with significant regional diversities. Indeed, each province or city that participates in a pilot ETS has a different industrial structure and economic growth outlook, resulting in each pilot ETS having different sectoral coverage in order to achieve its target without adversely affecting economic growth projections (EYGM, 2014).
For example, Beijing, Shanghai and Shenzhen are commercial centers along the coast with relatively high GDP per capita, and carbon emissions from the building sector account for a significant proportion of emissions in these provinces or cities, therefore the sector is included in these pilots (Duan et al., 2014). Conversely, Hubei and Chongqing are located in central China with a relatively lower GDP per capita but higher GDP growth rates. Accordingly, these pilot ETSs are more focused on heavy industrial sectors. Major emitting sectors such as power and heat, petrochemicals and manufacturing are covered in all pilots.
Table 1 Sectoral coverage of pilot ETSs (2018)
| Pilot ETS | Estimated coverage (%) | Sectors | Inclusion threshold | Number of firms | Allocation methods for steel sector |
| Beijing | 45 | Power and heat, petrochemicals, manufacturing (including iron and steel), building, public transportation and service | Total emissions: ${5000}{\mathrm{{tCO}}}_{2}$ /year | 903 (5) | Grandfathering |
| Chongqing | 50 | Power and heat, electrolytic aluminum, ferroalloys, calcium carbide, cement, caustic soda, and iron and steel | Total emissions: 20,000 ${\mathrm{{tCO}}}_{2}$ /year | 230 (n/a) | Grandfathering |
| Fujian | 60 | Power, petrochemical, chemical, building materials, iron and steel, nonferrous metals, paper, aviation, and ceramics | Energy consumption: 10,000 tce/year | 255 (26) | Grandfathering |
| Guangdong | 60 | Power and heat, petrochemicals, manufacturing (including iron and steel), transportation (including aviation) | Total emissions: 20,000 ${\mathrm{{tCO}}}_{2}$ /year | 249 (53) | Primary process: benchmarking; Secondary process and others: grandfathering |
(continued)
Table 1 (continued)
| Pilot ETS | Estimated coverage (%) | Sectors | Inclusion threshold | Number of firms | Allocation methods for steel sector |
| Hubei | 45 | Power and heat, petrochemicals, chemicals, manufacturing (including iron and steel, nonferrous metals, cement etc.), food and beverage | Energy consumption: 10,000 tce/year (in any year between 2014 and 2016) 60,000 tce/year (in any year between 2010 and 2011) | 344 (23) | Grandfathering |
| Shanghai | 57 | Power and heat, petrochemicals, chemical, iron and steel, nonferrous metals, building, transportation (including aviation, shipping etc.) and commerce | Total emissions: 10,000 tCO2/year 100,000 | 289 (4) | Grandfathering |
| Shenzhen | 40 | Power and heat, water-supply, manufacturing (including iron and steel), building and public transportation | Total emissions: ${3000}{\mathrm{{tCO}}}_{2}/$ year | 794 (2) | Grandfathering |
| Tianjin | 55 | Power and heat, petrochemicals, chemicals, iron and steel, oil and gas production | Total emissions: 20,000 t ${\mathrm{{CO}}}_{2}$ /year | 107 (29) | Grandfathering |
Source ICAP (2019b)
Table 1 summarizes the sectoral coverage of the eight pilot ETSs in China.
The iron and steel sector is covered by all pilot ETSs. Allowances are mainly allocated for free to enterprises in the sector, although auctioning may take place where it is considered appropriate by the ETS authorities of Shenzhen, Beijing, Guangdong and Fujian for the purpose of adjusting the market price (Pang & Duan, 2016). All pilots have adopted the historical emissions “grandfathering” method to allocate allowances to covered iron and steel enterprises, except for the Guangdong pilot ETS, which has used a benchmarking method for iron and steel enterprises equipped with primary process steel making. (Primary process (or primary route) refers to basic oxygen steel making process that uses).
Building on the successful experience of regional ETS pilots since 2013, China’s National Development and Reform Commission (NDRC) announced the official launch of a national ETS in December 2017, aiming to contribute to the effective control and gradual reduction of carbon emissions in China and the achievement of low carbon and green development. The national ETS regulates about 1,700 enterprises from the power sector, which emit over 26,000 tons of ${\mathrm{{CO}}}_{2}$ per year or consume over 10,000 tons of standard coal equivalent (tce) per year (ICAP, 2019b). More than 3 GtCO2e are covered in the initial phase, which accounts for approximately 30% of China’s national emissions.
China’s national carbon market is planned to start operation in 2020, although there is a delay due to the climate change department being moved from NDRC to the Ministry of Ecology and Environment (MEE) in 2018 (Zaman & Yang, 2019). The provisions for the launch and gradual development of the national ETS are laid out in the Work Plan for Construction of the National Emissions Trading System (Power Sector). The Work Plan was approved by the State Council in late 2017 (NDRC, 2017a). A phased transition in the Chinese ETS pilots is foreseen by the Work Plan. In the short term, the existing regional ETS pilots are expected to operate in parallel with the national carbon market, covering existing power and non-power sectors. Over the medium to long term, however, they are expected to be integrated into the national carbon market, once it is fully operational.
The power sector generally has higher quality of emissions data and it is therefore the first sector to be included in the national ETS. On ${15}^{\text{ th }}$ December 2017, the NDRC issued a notice (NDRC, 2017b) requiring reporting and verification of 2016 and 2017 carbon emissions data, as well as the development plans for future monitoring, reporting and verification (MRV) work in eight industrial sectors. These eight industrial sectors are: petrochemicals, chemicals, building materials, iron/steel, nonferrous metals, papermaking, electricity, and aviation. The coverage of these industrial sectors in the notice signals that the long-run plan is to integrate these sectors into the national ETS or another carbon pricing or regulation scheme.
Domestic project-based offset credits are allowed in China’s pilot ETSs, meaning that emissions can be reduced by sources that are not covered by the schemes and that are not located in the jurisdictions. The use of offsets is limited to $1\%$ of annual allowances in the Shanghai ETS pilot, 5% (Beijing and Fujian ETS pilots), 8% (Chongqing ETS pilot) and 10% (Guangdong, Hubei, Shenzhen and Tianjin ETS pilots) (ICAP, 2019b).
Table 2 below provides an overview on how the use of offset credits is regulated in the eight regional ETS pilots. None of these regional ETS pilots allows the use of international offsets from outside China. To avoid potential carbon leakage ${}^{6}$ Hubei ETS, with a relatively low abatement cost, requires that all CCERs must be generated from projects within Hubei province, while Guangdong ETS requires at least 70% of own-produced CCERs for the same reason (IETA, 2014, ICAP, 2019b). With concerns about the impact of CCERs on the ETS pilot markets and an upgrade of the current CCER system, the CCER project registration process was suspended since March 2017 (NDRC, 2017a).
Table 2 Offsets regulations in China’s pilot ETSs
| Pilot ETS | Eligible type of offset credits | Offsets limit (% of annual allowances) | Other requirements |
| Shenzhen | CCERs | 10 | Credits from hydro projects not allowed |
| Shanghai | CCERs | 1 | Credits from hydro projects not allowed |
| Beijing | CCERs | 5 | n/a |
| Guangdong | CCERs and Pu Hui Certified emission Reduction (PHCER) | 1.5 million offsets | At least 70% from projects in Guangdong province Credits from hydro projects not allowed |
| Tianjin | CCERs | 10 | Credits from hydro projects not allowed |
| Hubei | CCERs | 10 | Credits have to be generated from rural biogas and forestry projects located in poor areas of Hubei |
| Chongqing | CCERs | 8 | Credits from hydro projects not allowed |
| Fujian | CCERs and Fujian Forestry Certified Emission Reduction (FFCER) | 10 | n/a |
At the 13th National People’s Congress (NPC) in March 2018, the mission of combating climate change and reducing emissions was transferred from the NDRC to the MEE, which is likely to promote synergies between the development of a national carbon market and efforts to reduce air pollution (Slater et al., 2018). The Climate Change Department within the Ministry of Ecology and Environment will operate the national carbon market jointly with provincial governments. In April 2019, MEE started a consultation on the Interim Regulations for the Administration of Carbon Emission Permit Trading (MEE, 2019). The Interim Regulations set the rules for allowance allocation and trading in the regions, and mandate local governments to collect emissions data and regulate the emission trading market.
3 Section 3
3.1 Options for China’s ETS to Incentivize Steel Sector CCS
The purpose of an ETS is to put a price on emissions and so incentivize emission reductions in a cost-effective way. It is therefore relevant, albeit tentative, to consider how China’s national ETS could be used to incentivize CCUS in the steel sector. In this section we discuss three tentative approaches to this: (1) allowing ${\mathrm{{CO}}}_{2}$ stored through CCUS to be regarded as “not or low emitted” for the purposes of ETS compliance; (2) allowing offsets from iron/steel CCUS projects to be used for compliance in China’s ETS; and (3) incentivizing CCUS with finance from auctioning of ETS allowances or directly awarding allowances for steel plants with CCUS.
6 “Carbon leakage refers to domestic carbon emissions that are displaced by relatively cheaper imported products, mainly from countries or regions without carbon constraints, rather than reduced as anticipated because of the mitigation of unilateral regional climate change” - WANG, X., TENG, F., WANG, G., ZHOU, S. & CAI, B. 2018. Carbon Leakage Scrutiny in ETS and non-ETS Industrial Sectors in China. Resources, Conservation and Recycling, 129, 424-431.
Regarding CO2 Stored via CCS as “Not or Low Emitted”
One option to incentivize CCUS implementation in the steel sector in China would be to include emissions from the sector within the scope of the national ETS, while simultaneously allowing ${\mathrm{{CO}}}_{2}$ stored through CCUS to be regarded as ’not or low emitted’ for the purposes of ETS compliance. Within the option, regulators would need to consider the amendment of existing legislation, including potential changes in its coverage, allowance allocation method and MRV system, and introduce new rules concerning the capture and geological storage of carbon dioxide.
ETS Coverage
This option depends on the iron/steel sector being covered by the ETS. As previously discussed, the pilot ETSs in China all include the iron/steel sector, but the national ETS does not. Therefore, new legislation would be required to change the scope of the national ETS. This would need to specify which sources of emissions in iron and steel plants are covered within each entity’s defined scope. In the EU-ETS, sources are defined in terms of activities and thresholds (where the intention is not to include 100% of emissions from an activity).
For example, all coke making, sintering and palletization plants are included, regardless of capacity; whereas production of pig iron or steel is included where production output is over 2.5t/day, and processing is included where combustion units over 20MWth input capacity are operated (European Commission, 2003). This leads to approximately ${75}\%$ of the sector’s emissions being covered in the EU-ETS (Dechezleprêtre et al., 2018). In terms of covered gases, it is likely that only carbon dioxide emissions from the iron/steel sector would be covered, in accordance with the coverage for the power sector in the national ETS. This would not leave a significant amount of GHG emissions unregulated, as relatively small quantities of other GHGs are emitted from iron/steel production (principally small amounts of methane and nitrous oxide from the combustion of coal) (Beer et al., 2003).
Iron and Steel GHG Accounting
GHG emissions from an enterprise are conventionally divided into three scopes. Scope 1 refers to direct emissions from owned or controlled sources while Scope 2 refers to indirect emissions from the generation of purchased energy. Scope 3 includes all other indirect emissions (not included in scope 2) that occur in the supply chain of the reporting enterprise, both upstream and downstream. In the EU-ETS, covered entities are liable only for their Scope 1 emissions. In China, however, the existing Guidelines for Accounting and Reporting Greenhouse Gas Emissions: Iron and Steel ProductionEnterprises in China (NDRC, 2013a) require information on both direct emissions (Scope 1) from combustion of fossil fuel and consumption of solvent flux, carbonaceous materials and electrodes, and indirect emissions (Scope 2) from net purchased power and heat. Further details on the current accounting method for GHG emissions in the iron and steel sector in China can be found in Appendix 1.
Allowance Allocation
As previously observed, China’s ETS pilots have allocated free allowances to the iron and steel sector based on a grandfathering (historical data) approach, rather than benchmarking (based on activities) (see Table 1). A generic calculation of the allowances allocated to an iron and steel enterprise in China’s ETS pilots can be given as Formula 1 below:
$$ A = B \times {F}_{m} \times Q \tag{1} $$where.
$A$ Total allocated allowances to covered iron and steel entity.
$B$ Historical emissions or emissions intensity.
${F}_{m}$ Emission reduction factor.
$Q$ Crude steel production.
Although benchmarking is more conducive to encouraging advanced production processes, it is relatively difficult to determine suitable benchmarks for the iron and steel sector, due to its highly diverse product portfolio and complex production processes, as well as the lack of adequate emissions data. Nevertheless, after lessons learned from the initial two phases, the EU-ETS has switched its allocation method for industry and heating sectors in the third phase (2013-2020) from grandfathering to benchmarking (European Commission, 2015a).
CCS Recognition
Meanwhile, CCUS needs to be recognized legally so that emissions captured, transported and stored would not be treated as emitted. This occurred in a phased manner in the EU-ETS. From the start of Phase II in 2008, Member States had the option of including CCUS in the EU-ETS, subject to the Commission’s approval. Under the revised EU-ETS Directive 2009/29/EC, CCUS was given fuller recognition within the scheme, which took effect from Phase III in 2013 (European Commission, 2009a). The most outstanding element of the EU regulation on CCUS was a separate Directive for the geological storage of ${\mathrm{{CO}}}_{2}$ , which regulates the risks of ${\mathrm{{CO}}}_{2}$ storage (European Commission,2009b) and allows each Member State to formulate its regulatory approach to comply with the EU requirement (European Commission, 2011). In addition, each Member State could formulate its own policies for incentivizing CCUS demonstration projects, subject to State Aid approval by the European Commission.
In terms of the impact on CCUS financing, the option of allowing ${\mathrm{{CO}}}_{2}$ stored via CCUS to be regarded as ’not or low emitted’ for the purposes of ETS compliance would boost confidence for industries to demonstrate CCUS, but the actual financial support provided would be very limited. Given that average price expectations in the national ETS are RMB 54/ton (US$7.7/ton) in 2020 and RMB 98/ton (US$ 14/ton) in 2025 (Slater et al.,2018), and the cost of ${\mathrm{{CO}}}_{2}$ avoidance for a 0.5 million ton/year capacity ${\mathrm{{CO}}}_{2}$ capture project with pipeline transport and storage in an offshore saline formation is estimated at RMB 443/tCO2 (US$ ${63}/{\mathrm{{tCO}}}_{2}$ ) (Liang et al.,2019), this option would only contribute a small percentage of the required incentives to demonstrate CCUS. This finding is similar to the recommendation of a study by ENGO Network (2013) which suggested that an ETS could only form part of a financing package for CCUS. However, the cost estimate was based on offshore saline formation storage: if CCUS in China was deployed with onshore enhanced oil recovery (EOR) where the abatement cost could be less than US$20 per ton ${\mathrm{{CO}}}_{2}$ avoided (NCEPU,2019), the carbon price in the ETS could provide a more substantial part of the incentives required to enable CCUS, although still not the entire amount.
3.3 Allowing Offsets from Steel CCUS Projects in China’s ETS
Allowing CCUS to be included in project-based baseline-and-credit emissions trading is a second option for incentivizing iron/steel CCUS development in China. This would involve allowing CCUS projects to generate offsets which could be sold to participants in the ETS, who would be allowed to use them to meet their compliance obligations.
So far none of the eight regional ETS pilots have allowed emission reduction offset credits from CCUS to be eligible for compliance. On ${28}^{\text{ th }}$ December 2018, the NDRC, together with eight other government institutions including the MEE, issued the “Action plan on the establishment of a market-oriented and diversified ecological protection compensation mechanism” (NDRC, 2018). The Action Plan mentions the review and improvement of the CCER offset scheme and specifically prioritizes the use of forestry carbon sink projects as offsets for the national ETS, but CCUS is not explicitly discussed in the document.
In terms of allowing CCUS projects in the iron/steel sector to generate offset credits, two options are available: either domestic legislation to allow such projects to generate credits that would be unique to China’s national ETS, or making use of the international legal framework for recognizing emission reductions in developing countries under the Kyoto Protocol Clean Development Mechanism (CDM). As previously discussed, the CDM allows emission reduction projects in developing countries to generate internationally-recognized credits known as Certified Emission Reductions (CERs) (Dixon et al., 2013). In December 2011, at the meeting of the UNFCCC in Durban, South Africa, CCS was formally included in the list of project activities that may be eligible as CDM project activities (Brander & Ascui, 2018). However, at the present time, no carbon accounting methodologies for CCS have been put forward for approval under the 2011 agreement. Until such a methodology, applicable to CCUS in the iron/steel sector in China, is put forward and approved under the CDM modalities and procedures, it will not be possible to generate internationally recognized CERs from such a project. Therefore, the option of domestic legislation allowing projects to generate a China-specific offset credit is currently considered more feasible.
Such legislation would need to establish an administrative procedure for approving a GHG accounting methodology for CCUS projects in China. For project-based GHG accounting, emission reductions are quantified by comparing measured project emissions against a forward-looking, counter-factual baseline scenario or reference level (World Resources Institute and World Business Council for Sustainable Development, 2005). In addition, any increase in emissions elsewhere that is measurable and attributable to the project, yet not within the project boundary, is denoted ’leakage’ and also deducted from the calculated emission reductions (Brander & Ascui, 2018). Therefore, a general formula for project-based baseline-and-credit accounting is shown in Formula 2 below:
$$ {ERy} = {BEy} - {PEy} - {LEy} \tag{2} $$where:
ERy Emission reductions in year $\mathrm{y}\left( {\mathrm{{tCO}}}_{2}\right)$ .
${BEy}$ Baseline emissions in year y (tCO2), representing emissions from iron/steel enterprise that would have entered atmosphere if not for CCUS project
PEy Project emissions in year $\mathrm{y}\left( {\mathrm{{tCO}}}_{2}\right)$ , representing actual GHG emissions from iron/steel enterprise after implementation of CCUS project, including carbon capture, transport pipelines, and storage sites.
LEy Leakage emissions in year y (tCO2).
An important challenge for project-based GHG accounting is identifying and characterizing the baseline scenario and estimating the baseline emissions (BEy in Formula 2). A baseline is a hypothetical situation that represents the conditions most likely to occur in the absence of the CCUS project. The baseline should cover all emissions within the project boundary. For an iron/steel CCUS project, establishing a baseline for each component is suggested (Brander & Ascui, 2018). Existing actual or historical emissions would be a suitable baseline approach for a CCUS project that involves the addition of CCUS to an existing iron/steel plant. The baseline for retrofit CCUS project would involve the continued operation of the existing ${\mathrm{{CO}}}_{2}$ source facility, but without CCUS, such that produced ${\mathrm{{CO}}}_{2}$ is vented to the atmosphere. For a new build CCUS project, the baseline could correspond with the common practice in the area and the most economic option available, or an emissions performance standard that best represents project circumstances (McCormck, 2012).
After a project is implemented, emissions need to be monitored and reported. Emissions from a full chain CCUS project would comprise all sources of emissions within the project boundary, which would include at a minimum: The installation where ${\mathrm{{CO}}}_{2}$ captured;
Any treatment facilities;
Transportation equipment;
Injection facilities; and.
Subsurface components, including the storage site and potential sources of seepage, as well as the vertical and lateral limits of the geological storage site that are expected when the ${\mathrm{{CO}}}_{2}$ plume stabilizes over the long term.
Calculating project emissions involves measuring ${\mathrm{{CO}}}_{2}$ emitted during capture, compression, transportation, injection and storage (and recycling of ${\mathrm{{CO}}}_{2}$ if applicable) and deducting ${\mathrm{{CO}}}_{2}$ permanently stored by the project. Emissions generated from the additional energy required for capture (known as the ’energy penalty’) should be taken into consideration. Any seepage emissions $\left( {\mathrm{{CO}}}_{2}\right.$ that escapes from a geological reservoir into the ocean or atmosphere) should also be include in project emissions.
In terms of the impact on investment, the price of CCERs is generally lower than the price of allowances, so the financial impact of allowing iron and steel
CCUS projects to generate CCERs is less than under approach 1. The cost of monitoring, reporting and verification (MRV) of emission reductions at the project level is also generally higher than the equivalent costs under approach 1. There have not yet been any CCUS projects, anywhere in the world, financed solely through the CDM or similar offset mechanisms. Nevertheless, allowing CCUS projects to generate offset credits that can be used within China’s ETS is an option that could be considered if approach 1 is infeasible (for example, if it is decided that the iron/steel sector will not be covered by the national ETS, even in the next phase). While the revenue from offset credits would not be sufficient on its own to incentivize CCUS projects, it could boost confidence for investors in CCUS and help establish the MRV system for the iron and steel sector.
3.4 Auctioning ETS Allowances for Iron/Steel Plants with CCUS
The third approach involves using the revenue generated by the auctioning of allowances to support CCUS development and demonstration in the iron/steel sector. The government could establish a funding pool to provide dedicated support for financing CCUS demonstration projects. There has been some experience of this already in China’s pilot ETSs. The Guangdong ETS has attempted to use approximately RMB 1 billion (US$140 million) in auctioning revenue to finance innovative low-carbon technologies, but the provincial government finance department has been reluctant to approve the expenditure. An alternative approach could be to directly award allowances (taken from the amount to be auctioned) to companies building CCUS projects. The latter method could be easier to implement as it would not require finance department approval, but it would expose the project developer to price risk as the value of their allowances could change over time. Under a direct funding approach, the government rather than the project developer would be exposed to price risk.
The closest international reference is the EU-ETS New Entrant Reserve (NER). In 2009, the European Commission (EC), European Investment Bank (EIB) and EU Member States agreed to set aside 300 million allowances for subsidizing CCUS and installations of innovative renewable energy technologies, hence the fund’s name ‘NER 300’ (European Commission, 2017). With carbon prices heading toward EUR 30/ton in 2008, it was hoped that up to EUR 9 billion would be raised. However, prices subsequently crashed, and it was not until late December 2012 that the European Commissioner for Climate Action Connie Hedegaard finally announced the outcome of the first NER300 funding round-but could only award EUR 1.2 billion, due to the drop in allowance price, to 23 innovative renewable energy projects across Europe. Not a single CCUS project was funded, and due to the long selection process, the CCUS projects that had applied for NER300 funding missed their most ideal timing to receive investment under legislation for Phase 4 (2020-2030) of the EU-ETS, which became effective in April 2018, at least 400 million allowances (called NER400) will be reserved from 2021 onwards to create an Innovation Fund for demonstration projects of renewable energy and environmentally-safe CCS/CCUS. In addition, a further 50 million unallocated allowances from the Market Stability Reserve, together with remaining unallocated funds from the existing NER 300 Program, will be made available to support eligible projects.
To enable this approach, three key elements need to be considered for regulating ETS funds. First, regulators need to define the financing conditions, including decisions on how much support for projects is available, different ways the funds can be disbursed, i.e. as grants or loans for instance, whether a co-financing rate exists, and any other conditions that should be applied. Second, clear eligibility criteria and a transparent selection process need to be defined. Typically, a selection process involves some kind of ranking of eligible proposals so that they can be selected for funding in rank order, until the available funding limit is reached or there are no further eligible proposals. Third, the responsibilities of different institutions with regards to the implementation of the funding program need to be defined. Such responsibilities include, but are not limited to, issuing calls for proposals, monetizing ETS emission allowances, and assessing the technical and financial viability of projects.
Auctioning revenue of ETS allowances could be a viable option to finance the first few CCUS demonstration projects in the iron/steel sector in China, assuming that the scale of ETSs in China could generate sufficient revenue to support financing CCUS projects. Auctioning revenue of ETS allowances is also the most flexible option, and this option can also be combined with the other options. For example, the steel sector could be brought into the ETS as per option 1, with revenue from auctioning allowances to the power sector being recycled to offset the impact on the steel sector’s international competitiveness. It could also be combined with project-based crediting, by providing successful projects with additional funding which could be in the form of a fixed amount, or a variable amount, e.g., based on meeting the difference between the current carbon price and the abatement cost, or a multiple of the carbon price.
Two potential limitations of this approach are the uncertainty in the carbon price, and the need for agreement by relevant government finance departments to establish and allocate special funds, as discussed earlier. Policymakers in China could consider directly awarding allowances to steel companies building CCUS projects to avoid the financial approval process, but this method should be temporary. Finally, a limitation of this approach is that it could not be scaled to support every possible steel sector CCUS project, but could potentially incentivize early demonstration projects with adequate financial support, which would enable costs of next-generation projects to fall by learning.
The amount and type of MRV required for CCUS projects funded in this way would depend on the nature of the selection process and the objectives of the funding program. For example, if the objective is purely to demonstrate a carbon capture technology, then it may not be necessary to set in place a system for monitoring long-term storage. However, in most circumstances it would still be desirable to have robust measurement and reporting of the actual emission reductions (or potential emission reductions, in the case of capture-only projects) resulting from the funded projects, using a consequential accounting methodology as outlined under option 2, including MRV for geological storage and reversal of storage, liability, insurance and EOR.
In addition, the conditions of the funding allocation may set certain conditions which have to be met, such as meeting a certain timeline, capture rate or total amount of ${\mathrm{{CO}}}_{2}$ stored, and these parameters would need to be monitored.
4 Section 4
4.1 Think Ahead
Carbon emission trading system (ETS) is a market-based mechanism that can help to achieve emission reduction targets in a cost-effective fashion. In this chapter, we have explored different design options of ETS in connection with CCUS. Specifically, to better incentivize CCUS development in China, we have tentatively [emphasis added] discussed three options, and with a focus on the iron/steel sector. These design options are “tentative”, in view of the fact that while China’s regional ETS pilots have covered the iron/steel sector, China’s national carbon market, launched in late 2017, has yet to cover the iron/steel sector. But we believe that the exploration is not futile, because the logic could apply to other sectors (e.g., the power sector).
For the time being, the national carbon market only covers the power sector and the existing regional ETS pilots are expected to operate in parallel with the national carbon market. Over the medium- to long-term, however-along with petrochemicals, chemicals, building materials, nonferrous metals, papermaking, electricity and aviation, the iron/steel sector is expected to be integrated into the national carbon market (NDRC, 2017b, 2017c). So it is relevant to think and plan ahead.
4.2 Concluding Remarks
To recap, there are three tentative design options, and they are as follows: The first option is to allow ${\mathrm{{CO}}}_{2}$ stored through CCUS to be regarded as “not or low emitted” for the purposes of ETS compliance, such that CCUS-fitted or retrofitted iron/steel plant can realize emission reductions at the time of performance. This option would allow CCUS-fitted plants to generate revenues by selling spare allowances, or not having to purchase additional allowances in the carbon market.
The second option is to adopt a project-based baseline-and-credit approach. In this option, the national ETS covered emitters could purchase offset credits from CCUS-fitted or retrofitted iron/steel plants and use these purchased credits to meet their ETS compliance obligations. The third option is to use revenues generated by auctioning off emission allowances to support development and deployment of CCUS technologies in the iron/steel sector.
In comparative perspective, the first option has more straightforward MRV requirements than the second, but requires a change to enlarge the scope of the national carbon market to include the iron/steel sector, whereas the second option could be implemented relatively easily. Yet, for the first two options work effectively, the overall ETS cap has to set at a level ambitious enough to achieve a sufficiently high price, which means, at least theoretically, all cheaper abatement options would have to be exhausted before CCUS in the iron/steel sector become the marginal price-setting option. In other words, CCUS would need to compete with all other abatement options featuring lower costs. In reality, however, the current low prices in China’s ETSs, regional or national, are unlikely to be able to support a CCUS project in the iron/steel sector, in the absence of additional subsidies from other sources.
Thus, by comparison, the third option offers a more promising way to support early-stage CCUS projects in the iron/steel sector. But even for this option to work, it must be endorsed by relevant government departments and detailed rules and procedures need to be developed and established. That said, standing alone, the third option is the most flexible options, but it is not mutually exclusive with the first or the second option, and indeed can be combined with either of them. It is therefore recommended if a staged approach is taken. In strategic sequencing, the third option, if rolled out first, could potentially lever much stronger support than the other two options in the short-term. Overtime, when the carbon price becomes sufficiently high and the long-term price signal becomes strong and stable, ${}^{7}$ other two options would become sufficient on their own. In any case, a robust MRV system as well as a sound regulatory framework would be a pre-condition for all three options to work effectively.
Table 3 summarizes the opportunities and challenges that each option may bring to CCUS in the iron/steel sector in China.
Finally, it is worth noting that while the sectoral cut of this study is the iron/steel sector (see Appendix 1), the logic of the three different design options of ETS to better incentivize CCUS applications could also apply to the power sector. The power sector is the first sector covered by China’s national carbon market, which accounts for the lion’s share (about 45-50%) of China’s ${\mathrm{{CO}}}_{2}$ emissions. Note also that, as discussed in Chapters 1 and 2, currently most of China’s CCUS pilots are in the power sector. As a novel and emerging technology on industrial scale to directly reduce carbon emissions, CCUS is currently included in China’s mid- to long- term development plan (MOST, 2013; State Council, 2006). Although the NDRC has provided policy support for CCUS demonstrations (NDRC, 2013b), there is not yet any dedicated regulatory framework in place to ensure the legal and commercial certainty for CCUS projects in China.
That notwithstanding and in view of China’s mid- to long-term development plan of green growth, this study has looked ahead in exploring different design options of China’s ETSs in connection with the financing of early-stage CCUS demonstration projects. And so doing, it has brought us back to the nexus of this study, i.e., the synergy between policy, technology, and market to push forward the frontier of inclusive and sustainable growth.
${}^{7}$ Price stability is important. Otherwise, the funding required for CCUS is uncertain: more would be required if the allowance price falls, while at the same time, auction revenues would also fall. To counteract this effect, it is proposed that the volume of allowances set aside for the fund could be flexible, thus operating in a similar way to the Market Stability Reserve in the EU-ETS, withdrawing more allowances from the market when the price is low, and less when the price is high. This would have the beneficial effect of creating greater price stability in the ETS as a whole.
Table 3 Comparison of 3 design options of ETS
| Options | Opportunities | Challenges |
| (1) Including the iron/steel sector in the national ETS and allowing ${\mathrm{{CO}}}_{2}$ stored through CCUS to be regarded as 'not or low emitted' for the purposes of ETS compliance obligations | - Steel plants with CCUS could realize emission reductions at the time of performance, generating revenue by selling spare allowances or avoiding extra costs or not having to purchase from the carbon market - MRV requirements are relatively straightforward compared with option 2, as all steel plants would already have to monitor and report their emissions, so additional MRV would only apply to CCUS components | - Carbon prices are unlikely to be high enough to incentivize CCUS implementation on their own, as all abatement options in both the power sector and the steel sector that are cheaper than CCUS would be exploited first - A free allocation approach based on historical emissions would tend to have less effect to motivate iron/steel enterprises to adopt advanced carbon abatement technology such as CCUS |
| (2) Allowing offsets from iron/steel CCUS projects in China's ETSs | - The option enables sectors not covered by an ETS to generate revenues from reducing carbon emissions - This option does not require a major change to the scope of the national ETS | - Offsets will only be used for compliance within an ETS when their price is lower than the prevailing price of allowances in the ETS. Therefore, the likely revenue is lower than option 1 - The transaction costs of option 2 are also potentially higher than option 1 |
| (3) Incentivizing CCUS with finance from auctioning of ETS allowances or directly awarding allowances to steel plants fitted with CCUS | - The most flexible option, which can also be combined with the other options | - Market price fluctuations would create uncertainty over the actual budget available for disbursement - Setting up new funds requires government finance department approval - CCUS might need to compete with other demands for such funds |
Appendix 1
Table A1: GHG accounting guidelines for iron/steel industry in China (NDRC, 2013a)
| Calculation formula | Notes | |
| ${\mathrm{{Eco}}}_{2}$ (Total ${\mathrm{{CO}}}_{2}$ emissions in steel-making process) | ${\mathrm{{Eco}}}_{2} = {\mathrm{E}}_{\text{ combustion }} + {\mathrm{E}}_{\text{ power\&heat }} - {\mathrm{E}}_{\text{ sequestration }}$ | ${\mathrm{{Eco}}}_{2}$ presents total ${\mathrm{{CO}}}_{2}$ emissions; Ecombustion refers to ${\mathrm{{CO}}}_{2}$ emissions of all net consumed fossil fuel combustion activities; Eprocess represents ${\mathrm{{CO}}}_{2}$ emissions from industrial production processes; Epower&heat is ${\mathrm{{CO}}}_{2}$ emissions corresponding to net purchased power and heat by enterprise; Esequestration is implicit ${\mathrm{{CO}}}_{2}$ of carbon-sequestered products (e.g., crude steel) |
| Ecombustion ( ${\mathrm{{CO}}}_{2}$ emissions of all net consumed fossil fuel combustion activities) | ${\mathrm{E}}_{\text{ combustion }} = \frac{44}{12}\mathop{\sum }\limits_{{i = 1}}^{n}\left( {A{D}_{i} \times C{C}_{i} \times {OF}}\right)$ | ${ADi}$ refers to activity level of fossil fuel consumed within accounting and reporting period (GJ); ${CCi}$ refers to carbon content per unit of calorific value of fossil fuel (iC/GJ); OFi is the rate of carbon oxidation of fossil fuel (%) |
(continued)
Table A1: (continued)
| Calculation formula | Notes | |
| Eprocess ( ${\mathrm{{CO}}}_{2}$ emissions from industrial production processes) | ${E}_{\text{ process }} = {E}_{\text{ solvent }} + {E}_{\text{ electorde }} + {E}_{\text{ rawmaterials }}$ $= \mathop{\sum }\limits_{{i = 1}}^{n}\left( {{P}_{i} \times D{X}_{i} \times E{F}_{i}}\right) + {P}_{\text{ electrode }} \times E{F}_{\text{ electrode }}$ $+ \mathop{\sum }\limits_{{i = 1}}^{n}{M}_{i} \times E{F}_{i}$ | Esolvent is ${\mathrm{{CO}}}_{2}$ emissions from solvent consumption; Eelectrode is ${\mathrm{{CO}}}_{2}$ emissions from consumption; Eraw materials is ${\mathrm{{CO}}}_{2}$ emissions from consumption of other carbonaceous materials such as pig iron, ferroalloy and direct reduced iron; ${Pi}$ is net consumption of solvent; ${DXi}$ is average purity of solvent (%) EFi is ${\mathrm{{CO}}}_{2}$ emission factor of solvent $\left( {{\mathrm{{tCO}}}_{2}/\mathrm{t}}\right)$ ; Pelectrode is amount of electrode consumed for EAF-based steel making (t); EFelectrode is ${\mathrm{{CO}}}_{2}$ emission factor for electrode consumed; ${Mi}$ is purchased amount of carbonaceous materials; ${EFi}$ is ${\mathrm{{CO}}}_{2}$ emission factor for purchased carbonaceous materials $\left( {{\mathrm{{tCO}}}_{2}/\mathrm{t}}\right)$ |
(continued)
Table A1: (continued)
| Calculation formula | Notes | |
| Epower&heat ( ${\mathrm{{CO}}}_{2}$ emissions corresponding to net purchased power and heat by enterprise) | ${\mathrm{E}}_{\text{ power\&heat }} = {\mathrm{{AD}}}_{\text{ power }} \times {\mathrm{{EF}}}_{\text{ power }} + {\mathrm{{AD}}}_{\text{ heat }} \times {\mathrm{{EF}}}_{\text{ heat }}$ | ADpower and ADheat are net purchased electricity (MWh) and heat (GJ) amount within accounting and reporting period; EFpower and EFheat are ${\mathrm{{CO}}}_{2}$ emission factors for electricity $\left( {{\mathrm{{tCO}}}_{2}/\mathrm{{MWh}}}\right)$ and heat $\left( {{\mathrm{{tCO}}}_{2}/\mathrm{{GJ}}}\right)$ |
| Esequestration (Implicit ${\mathrm{{CO}}}_{2}$ emissions of carbon-sequestering products) | ${\mathrm{E}}_{\text{ sequestration }} = \mathop{\sum }\limits_{{i = 1}}^{n}A{D}_{\text{ sequestration }} \times E{F}_{\text{ sequestriation }}$ | ${\mathrm{{AD}}}_{\text{ sequestration }}$ is output of carbon sequestering product (t); ${\mathrm{{EF}}}_{\text{ sequestration }}$ is emission factor for carbon-sequestering product $\left( {{\mathrm{{tCO}}}_{2}/\mathrm{t}}\right)$ |
Acronym Full spelling
AAUs Assigned Amount Units
CCER Chinese CER
CCS Carbon capture and storage
CCUS Carbon capture, utilization and storage
CDM Clean Development Mechanism
CERs Certified Emission Reductions
${\mathrm{{CO}}}_{2}$ Carbon dioxide
${\mathrm{{CO}}}_{2}\mathrm{e}$ Carbon dioxide equivalent
EC European Commission
FFCER Fujian Forestry Certified Emission Reduction
EIB European Investment Bank
EOR Enhanced oil recovery
ETS Emissions trading scheme
ERUs Emission Reduction Units
EU ETS EU Emissions Trading System
GDP Gross Domestic Product
GHG Greenhouse gas
IET International Emission Trading
IPCC Intergovernmental Panel on Climate Change
JI Joint Implementation
MEE Ministry of Ecology and Environment
Mtce Million tons of coal equivalent
NAP National Allocation Plans
NDC Nationally Determined Contribution
NDRC National Development and Reform Commission
PHCER Pu Hui Certified Emission Reduction
${\mathrm{{SO}}}_{2}$ Sulphur dioxide
Tce Ton of coal equivalent
UNEP United Nations Environment Program
References
Beer, J. D., Harnisch, J., & Kerssemeeckers, M. (2003). Greenhouse gas emissions from iron and steel production. ECOFYS.
Brander, M. & Ascui, F. (2018). Consequential GHG assessment of carbon capture, utilization and storage for a steel plant in China. BHP Carbon Capture, Utilization and Storage in China’s Iron and Steel Sector Project. University of Edinburgh. COASE, R. H. 1960. The problem of social cost.
Dechezleprêtre, A., Nachtigall, D. & Venmans, F. (2018). The joint impact of the European Union Emissions trading scheme on carbon emissions and economic performance. OECD Working Papers.
Dixon, T., Leamon, G., Zakkour, P., & Warren, L. (2013). CCS projects as Kyoto protocol CDM activities. Energy Procedia, 37, 7596-7604.
Duan, M., Tao, P., & Zhang, X. (2014). Review of carbon emissions trading pilots in China. Energy & Environment, 25, 527-550.
EEA. (2011). Air pollution impacts from carbon capture and storage (CCS). Copenhagen. EU MERCI. (2018). Technical analysis-iron and steel sector (NACE C24.1-24.2-24-5).
European Commission. (2003). Directive 2003/87/EC of the European Parliament and of the Council of 13 October 2003 establishing a scheme for greenhouse gas emission allowance trading within the Community and amending Council Directive 96/61/EC (Text with EEA relevance).
European Commission. (2009a). Directive 2009/29/EC of the European Parliament and of the Council of 23 April 2009. Official Journal of the European Union. Strasbourg.
European Commission. (2009b). Directive 2009/31/EC of the European Parliament and of the Council of 23 April 2009 on the geological storage of carbon dioxide and amending Council Directive 85/337/EEC, European Parliament and Council Directives 2000/60/EC, 2001/80/EC, 2004/35/EC, 2006/12/EC, 2008/1/EC and Regulation (EC) No 1013/2006 (Text with EEA relevance). In UNION, T. E. P. A. T. C. O. T. E. (ed.).
European Commission. (2011). Implementation of Directive 2009/31/EC on the geological storage of Carbon Dioxide, Guidance Document 4, Article 19 Financial Security and Article 20 Financial Mechanism.
European Commission. (2015a). Decision concerning the establishment and operation of a market stability reserve for the Union greenhouse gas emission trading scheme and amending Directive 2003/87/EU.
European Commission. (2015b). eu ets handbook. european commission.
European Commission. (2017). Funding innovative low-carbon technologies: the NER 300 program [Online]. Available: https://ec.europa.eu/clima/sites/clima/files/docs/ner300_fac tsheet_en.pdf. Accessed 12 October 2019.
European Commission. (2018). Directive (EU) 2018/410 of the European Parliament and of the council of 14 March 2018 amending Directive 2003/87/EC to enhance cost-effective emission reductions and low-carbon investments, and Decision (EU)2015/1814 Brussels.
EYGM. (2014). Understanding China’s emissions trading schemes and emissions reporting. EYGM Limited.
Fang, C. C. (2018). Carbon pricing, correcting climate change’s market failure. Sustainability: The Journal of Recording, 11.
ICAP. (2019a). ETS Fact sheets [Online]. International Carbon Action Partnership. Available: https://icapcarbonaction.com/en/ets-map.Accessed 28 July 2019.
ICAP. (2019b). China National ETS.
IETA. (2014). Use of offset credits across emission trading systems and carbon pricing mechanisms. IETA-Climate Challenges, Market Solutions.
International Energy Agency. (2017). Energy Technology Perspectives 2017.
IPCC. (2018). Special report on global warming of 1.5 ${}^{ \circ }\mathrm{C}$ (SR15). Intergovernmental Panel on Climate Change.
Irlam, L. (2017). Global costs of carbon capture and storage: 2017 update. Global CCS Institute.
Liang, X., Lin, Q., Muslemani, H., Lei, M., Liu, Q., Li, J., Wu, A., Liu, M., & Ascui, F. (2019). Assessing the economics of ${\mathrm{{CO}}}_{2}$ capture in China’s iron/steel sector: A case study. Energy Procedia, 158, 3715-3722.
Mccormck, M. (2012). A greenhouse gas accounting framework for carbon capture and storage projects. Center For Climate and Energy Solutions.
MEE. (2019). Interim regulations for the administration of carbon emission permit trading (Consultation Paper). fgs.mee.gov.cn. Ministry of Ecology and Environment.
MOST. (2013). The 12th five-year plan for national development of carbon capture, utilization and storage technology.
Muslemani, H., Jiang, M., Chen, X. & Jia, Z. (2019). Lower carbon technology approaches for steel manufacturing in China. Working Paper 4.7 for the BHP Industrial CCS Project ‘Unlocking the Potential of CCUS for Steel Production in China’. Edinburgh, UK.
Slater, H., Boer, D. D., Shu, W. & Guoqiang, Q. (2018). The 2018 China carbon pricing survey. Beijing.
NCEPU. (2019). Techno-economic analysis of ${\mathrm{{CO}}}_{2}$ capture technologies for the Iron/Steel industry in China. Working Paper 4.11 for the BHP Iron and Steel CCS Project. North China Electric Power University, UK-China (Guangdong) CCUS Centre and The University of Edinburgh.
NDRC. (2013a). Notice on greenhouse gas emission accounting methods and reporting guidelines for 10 sectors (Trial).
NDRC. (2013b). Notice on promoting carbon capture, utilization and storage demonstration.
NDRC. (2017a). NDRC Announcement, 2017 No.2 [Online]. National Development and Reform Commission. Available http://www.ndrc.gov.cn/zcfb/zcfbgg/201703/t20170317_ 841211.html. Accessed 11 October 2019.
NDRC. (2017b). Notice on work plan for carbon emissions reporting, verification and monitoring for 2016 and 2017. National Development and Reform Commission.
NDRC. (2017c). Work plan for construction of the national emissions trading system (Power Sector). National Development and Reform Commission.
NDRC. (2018). Action plan on the establishment of a market-oriented and diversified ecological protection compensation mechanism.
Pang, T., & Duan, M. (2016). Cap setting and allowance allocation in China’s emissions trading pilot programs: Special issues and innovative solutions. Climate Policy, 16, 815-835.
State Council. (2006). National mid- to long-term science and technology development plan (2006-2020).
Stavins, R. N. (2001). Experience with market-based environmental policy instruments. Resources for the Future.
Tunnicliffe, H. (2017). CCS: Why bother? [Online]. The Chemical Engineer. Available: https://www.thechemicalengineer.com/features/ccs-why-bother/.Accessed 15 December 2018.
UNFCCC. (1998). Kyoto protocol to the United Nations framework convention on climate change. United Nations.UNITED NATIONS 2015. The Paris Agreement. Paris: United Nations.
Wang, X., Teng, F., Wang, G., Zhou, S., & Cai, B. (2018). Carbon leakage scrutiny in ETS and non-ETS industrial sectors in China. Resources, Conservation and Recycling, 129, 424-431.
World Bank Group 2018. (2019). State and trends of carbon pricing 2018. World Bank Group. Carbon pricing dashboard [Online].World Bank Group Available: https://carbonpricingda shboard.worldbank.org/map_data [Accessed 28 July 2019].
World Resources Institute & World Business Council for Sustainable Development. (2005). The GHG protocol for project accounting. USA.
World Steel Association. (2019). Global crude steel output increases by 4.6% in 2018[Online]. World Steel Association. Available https://www.worldsteel.org/media-centre/press-rel eases/2019/Global-crude-steel-output-increases-by-4.6–in-2018.html. Accessed 28 July 2019.
Xiong, L., Shen, B., Qi, S., & Price, L. (2015). Assessment of allowance mechanism in China’s carbon trading pilots. Energy Procedia, 75, 2510-2515.
Xu, W., Wan, B., Zhu, T., & Shao, M. (2016). CO2 emissions from China’s iron and steel industry. Journal of Cleaner Production, 139, 1504-1511.
Zaman, P., & Yang, K. 2019. Update on the Chinese National Emissions Trading Scheme-some progress but more questions than answers [Online]. Reed Smith Client Alerts. Accessed October 2019.
Part IV Projection
Achieving Carbon Neutrality by 2060: What (More) Has to Be Done?
Jun Fu, Jintao Xu, Yu Liu, Lunyu Xie, and Shilei Liu
On September 22, 2020, at the General Debate of the 75th Session of the UN General Assembly, Chinese President Xi Jinping delivered a speech and promised that China would peak carbon emissions prior to 2030 and try to achieve carbon neutrality by ${2060.}^{1}$ That will be a very daunting task for China. In the wake of President Xi’s speech, a workshop was held at the National School of Development at Peking University. The purpose was to look ahead and scope up what has to be done for China years down the road to achieve that daunting task. The authors of the present chapter all attended the workshop, and we agreed that there were essentially four approaches to the challenge, i.e., public policy approach (PPA), market-based approach (MBA), carbon capture and storage (CCS), and nature-based solutions (NBS). As the theme of climate change has much to do
${}^{1}$ Subsequently the Chinese government redefied the goal of “achieving carbon neutrality by 2060” as including not just ${\mathrm{{CO}}}_{2}$ but all GHGs.
The original version of this chapter was revised: A new sentence has been added on pages 254 and 272, respectively, in Sects. 2.1 and 4.4, and the symbol in the Table 2 note has been changed from “$” to “$” in Sect. 4.1. The correction to this chapter can be found at https://doi.org/10.1007/978-981-16-4310-1_8.
J. Fu $\left( \varnothing \right) \cdot$ J. Xu $\cdot$ S. Liu
National School of Development, Peking University, Beijing, China
Y. Liu
Institutes of Science and Development, Chinese Academy of Sciences, Beijing, China
L. Xie
Renmin University of China, Beijing, China
with the so-called “tragedy of the commons” (Hardin, 1968) on a global scale, ${}^{2}$ the role of PPA in connection with international cooperation and coordination has to be elevated.
Now armed with the conceptual framework of PPA + MBA + CCS + NBS (or PMCN model for short), our job was to build the model, get the data, and project forward with different scenarios such that we could help policy makers understand likely future outcomes as well as the implications of alternative policies. Intellectually, the dynamical PMCN modelling was both a deductive and inductive exercise within three sets of interrelated parameters, i.e., climate change, energy structure, and economic growth—along similar lines of the DICE model (dynamic integrated model of climate and the economy) developed by Nobel Laureate in economics William Nordhaus (Nordhaus and Boyer, 2000).
This chapter represents the results of that exercise. The chapter is organized into 4 sections. Section 1 puts China’s climate mitigation and adaption efforts in global perspective. Section 2 elaborates on the framework of PPA + MBA + CCS + NBA in the Chinese context. Section 3 explains the mechanics of our model construction and scenarios planning. Projection results and key takeaways are presented in Section 4.
1 Section 1
1.1 Climate Change Mitigation and Adaption in Global Perspective
Climate change has posed a grave threat to mankind. Reduction of carbon emissions has increasingly become a global consensus. According to the IPCC (2018), in order to avert the worst impact of climate change on the eco-system on Earth, it is critical to limit global warming to ${1.5}^{ \circ }\mathrm{C}$ . This, in turn, requires a ${45}\%$ reduction in global ${\mathrm{{CO}}}_{2}$ emissions from 2010 level by 2030, and net zero ${\mathrm{{CO}}}_{2}$ emissions world-wide by the middle of this century. Under the principle “common but differentiated responsibilities” of UNFCCC, while the contracting states to the Paris Agreement have been trying hard to reduce greenhouse gas emissions (GHG), ${}^{3}$ much more must be done. That is, more ambitious nationally determined contributions (NDC) must be adopted to make sure that the goal of staying within ${1.5}^{ \circ }\mathrm{C}$ will be achieved. NDCs are at the heart of the Paris Agreement to reduce ${\mathrm{{CO}}}_{2}$ missions. They embody voluntary efforts by each contracting state to reduce ${\mathrm{{CO}}}_{2}$ emissions and adapt to the impact of climate change.
${}^{2}$ Globally, the total amount of ${\mathrm{{CO}}}_{2}$ emissions reached 40.1 billion tons in 2019, about 86% of which was from fossil-fuels and ${14}\%$ from land use. Of the total, ${31}\%$ was sequestered by the land, 23% by the ocean, and the rest (or 46%) went up into the atmosphere.
${}^{3}$ In the composition of GHG defined Kyoto Protocol, Carbon Dioxide $\left( {\mathrm{{CO}}}_{2}\right)$ takes about 81%, Methane $\left( {\mathrm{{CH}}}_{4}\right) {10}\%$ , Nitrous Oxide $\left( {{\mathrm{N}}_{2}\mathrm{O}}\right) 7\%$ , and the rest are Fluorinated Gases (e.g.,
In November 2018, the UN released a special report—i.e., the IPCC’s ${1.5}{}^{ \circ }\mathrm{C}$ Special Report—urging the contracting states to the Paris Agreement to do more. In light of this, many jurisdictions across the world—including China, the European Union (EU), the United Kingdom (UK), Canada, South Korea, New Zealand, New York, Hawaii and California-renew efforts and set climate targets to carbon neutrality. Carbon neutrality refers to the target to remove as much carbon dioxides from the atmosphere as they are put into it. The overall goal of carbon neutrality is to achieve a zero carbon footprint. In December 2019, the UN announced that 73 countries, 14 regions and 398 cities around the world had started to work towards carbon neutrality by 2050 (UNFCCC, 2019).
Based on the Paris Agreement in 2015, the European Union (EU) had committed itself to the binding target of at least a 40% reduction in GHG emissions from the 1990 level. Having cut a so-called “European Green Deal”, the EU has aimed higher-to achieve a carbon neutral goal by 2050. Specifically, the green deal has raised the EU targets to at least 50% reduction and has started to move towards 55% GHG emissions reduction by 2030. And in line with the EU goal of reaching carbon neutrality by 2050, many European countries have adopted NDCs toward zero net GHG emissions. Austria, Denmark, France, Germany, and Sweden have all put climate policies in place, aiming at carbon neutrality by 2040 (Austria), by 2045 (Sweden), and by 2050 (the rest) respectively.
In the United Kingdom (UK), UK Climate-change Act entered into force in June 2019. The Act has confirmed that the UK will achieve zero net carbon emissions by 2050. Under the UK Climate-change Act, Scotland aims to achieve carbon neutrality in 2045, and Welsh will reduce ${\mathrm{{CO}}}_{2}$ emission by ${90}\%$ from 2010 levels by 2030. Similarly, New Zealand amended its Climate Change Response Act in 2019. The Amended (Zero Carbon) Act aims at net zero GHG emissions by 2050. As the agricultural sector accounts for a large part of New Zealand’s GHG emissions, the Zero Carbon Act also aims to reduce biogenic methane emissions by 24-47% from 2017 levels by 2050.
As a developing country in the midst of rapid industrialization and urbanization, China has been working hard to catch up in terms of decarbonization. In 2009, China had announced the goal of a 40%-45% reduction in carbon emissions per GDP by 2020, as compared to the 2005 level. In 2015, China set its NDCs to cap ${\mathrm{{CO}}}_{2}$ emissions no later than 2030. According to China’s Climate Change Policy and Action 2019 Annual Report, ${}^{4}$ carbon emissions per GDP had dropped by 45.6% from 2005 level by 2018, exceeding the original reduction target.
hydrofluorocarbon (HFCs), perfluorocarbon (PFCs), and sulfur hexafluoride (SF6)), about 3%.
As the world’s biggest developing country and ${\mathrm{{CO}}}_{2}$ emitter, China’s new voluntary pledge-i.e., to achieve carbon neutrality in 2060-would contribute the lion’s share of the reductions of ${\mathrm{{CO}}}_{2}$ emissions world-wide. In comparative perspective, the deadline that China sets for itself to achieve carbon neutrality is very tight. Whereas the EU has planned to spend 70 years from carbon emissions peak to carbon neutrality, and the United States 45 years, China only gives itself a 30- year transition period. The task is daunting. To illustrate, in 2019, fossil fuels still accounted for about 85% of China’s energy structure, of which coal was 58%, the country’s carbon emission per capital remained 46% higher than the world average; and total ${\mathrm{{CO}}}_{2}$ emissions about ${29}\%$ of the world’s total. For China to peak carbon emissions prior to 2030 and achieve carbon neutrality in 2060, it must move aggressively to de-carbonize ${}^{5}$ its economy in the year ahead—indeed much more aggressively than the developed countries.
(a) What are the available strategies of carbon emission reduction in China to achieve carbon neutrality by 2060?
(b) What are the effects of different mitigation strategies on carbon emission, energy demand and macro economy?
(c) Whether can China achieve carbon neutrality by 2060 through the current available strategies and at what cost?
To try to answer the above questions systematically, we have developed a conceptual framework of PPA + MBA + CCS + NBS, so as to delineate the parameters of our model building.
4 The Ministry of Environmental Protection from 2009 publishes the China’s Climate Change Policy and Action Annual Report annually.
${}^{5}$ Carbon removal or decarbonization is a term that includes many forms of carbon removal from the atmosphere, whether through land sequestration or through negative emissions technologies that actively pull ${\mathrm{{CO}}}_{2}$ out of the atmosphere, such as direct air capture or biomass energy with carbon capture and storage.
2 Section 2
2.1 A Conceptual Framework: PPA + MBA + CCS + NBS
Concept is critical in generating knowledge from experience. Or the world would remain too chaotic for us to understand. The fewer fundamental concepts that lies at the base of a science, the higher the level knowledge to which it raises us. Add actual context, we practice in the real world. Call it theoria cum praxi philosophically. There are essentially four approaches regarding mitigation and adaptation to the impact of climate change. They are: public policy approach (PPA), market-based approach (MBA), carbon capture and storage (CCS), and nature-based solutions (NBS). Let us elaborate a bit more on each of them, starting backwards from NBS.
Nature-Based Solution (NBS)
The International Union for the Conservation of Nature (IUCN) defines nature-based solution (NBS) as actions to protect, sustainably manage, and restore natural or modified ecosystems that support the achievement of society’s development goals and address major societal challenges, such as climate change, food security, water security, human health, disaster risk, etc. ${}^{6}$
In climate change, NBS has been recognized as an important measure to help and protect human beings from the impact of climate change while slowing down further warming (Cohen-Shacham et al., 2016; Nature, 2017). Forests, as the main resource of NBS, sequester ${\mathrm{{CO}}}_{2}$ as trees grow and have potential to mitigate the impact of climate change (Bellassen & Luyssaert, 2014). Xu et al. (2020) provides the estimate of China’s forest carbon sequestration potential. Based on their estimation, by the end of 2050, the carbon sinks of the existing forest in 2050 will be 1.54 billion tons/year. He et al. (2020)’s prediction is much lower than Xu et al. (2020)’s estimation. According to their research, China’s forest carbon sequestration will be 700 million tons/year by 2050. The reason for the difference is the emission reduction effect of wood products does not enter into He et al. (2020)’s prediction.
${\mathrm{{CO}}}_{2}$ Capture and Storage (CCS)
${\mathrm{{CO}}}_{2}$ capture and storage (CCS), as our previous chapters have explained, refers to the process that carbon dioxide is separated from industrial or related emission sources, transported to storage sites, and isolated from the atmosphere. In recent years, China has ramped up the R&D of CCUS (carbon capture, utilization and storage) through the National Basic Research Program of China (aka., 972 Program), the National Hi-Tech Research and Development Program of China (aka., 863 Program), and National Science and Technology Support Program. One illustration of the “U” part ( ${\mathrm{{CO}}}_{2}$ utilization) is ${\mathrm{{CO}}}_{2}$ -EOR (enhanced oil recovery) technology, which, if successful, could result in negative ${\mathrm{{CO}}}_{2}$ emissions. It injects ${\mathrm{{CO}}}_{2}$ into an underground geologic zone that contains hydrocarbons to produce more oil. So far there are about 30 CCS/CCUS pilot or demonstration projects either already in operation or under construction in China, and mostly in oil fields and coal-fired power plants.
${}^{6}$ https://www.iucn.org/commissions/commission-ecosystem-management/our-work/nature-based-solutions.
${}^{6}$ https://www.iucn.org/commissions/commission-ecosystem-management/our-work/nature-based-solutions.
CCS is not only a large-scale ${\mathrm{{CO}}}_{2}$ emission reduction technology with great potentials, but also the only technology available that can deliver large-scale direct emission reductions for energy-intensive industries, and with minimal restructuring costs on existing energy structure. Bioenergy with ${\mathrm{{CO}}}_{2}$ capture and storage (BECCS) is the installation of CCS technology in the biological processing industry or biofuel power plants. Both CCS and BECCS create negative carbon emissions. As He et al. (2020) estimate that the carbon sink of CCS and BECCS technology in China would be 510 million tons and 880 million tons in 2050 under ${1.5}^{ \circ }\mathrm{C}$ and ${2}^{ \circ }\mathrm{C}$ scenarios, respectively. At present, however, the biggest hurdle is the prohibitively high cost for CCS, estimated at $200-300 tCO2. As 1 ton of coal would produce roughly 2 tons of ${\mathrm{{CO}}}_{2}$ , it means that it would cost well over $\$ {400}$ to sequester ${\mathrm{{CO}}}_{2}$ emissions from the burning of 1 ton of coal.
Market-Based Approach (MBA)
On way to understand how market-based approach (MBA) works to drive decarbonization is carbon markets, or known in Europe as emission trading systems (ETS). Broadly speaking, ETS can be understood as a financial way to internalize environmental benefits when investing in sustainable energy systems. ETS contributes to economic efficiency by facilitating ${\mathrm{{CO}}}_{2}$ emission reductions where it is cheapest to achieve them. Polluters or emitters who would find it costly to reduce their emissions are allowed to buy emission allowances from polluters or emitters who can abate at lower costs. In a “perfectly” market, the costs associated with reducing an additional unit of emissions would be equalized, and total costs of reaching a given environmental or climate target would be minimized. As discussed in the previous chapters, China started 7 regional ETS pilots in 2011 (in Beijing, Chongqing, Guangdong, Shanghai, Shenzhen, Tianjin, and Hubei), and a national ETS in 2017, although the national ETS covers only the power sector so far but is expected to expand its coverage years down the road.
Another example of MBA is green bonds. Green bonds can enable fund-raising and investment for both existing and new projects with environmental benefits, e.g., CCS technology presumably in the years ahead. Market principles of information disclosure and transparency are critical in developing green bond markets. They help potential investors by ensuring availability of information necessary to evaluate the environmental impact of their investments; and they also assist underwriters by moving the market towards standard disclosures which can facilitate transactions. In December 2015, China’s green bond market was launched, when the People’s Bank of China (PBOC) first came out with a catalogue of green projects and introduced green bonds in the interbank bond market. Subsequently, a total of 9 market pilots were rolled out for China to test the ground and learn from experience of green finance, including green loans, green bonds, and green insurance. At represent, PBOC is considering upgrading the green bond catalogue by removing fossil fuel projects and working with international counterparts to align green taxonomies.
Public Policy Approach (PPA)
An extensive literature exists, both theoretical and empirical, that supports the argument that when externalities exist, public policy becomes powerful instruments to correct market failures. Combating externalities-of which ${\mathrm{{CO}}}_{2}$ emissions, water pollutions and environmental degradations are textbook examples is a legitimate arena for government intervention using what we call public policy approach (PPA). The argument is all more compelling when the ecosystem on Earth is at stake. To deal with externalities or market failures, PPA instruments essentially include (a) a Tax, (b) a Subsidy, (c) a Restriction, Standard, Target or Quota.
Experts have identified a number of policy instruments that are efficacious in restricting or reducing carbon emission (Gallagher et al., 2019). In addition to national emission-trading system (ETS) and green bonds, which we have discussed under market-based approach (MBA), ${}^{7}$ the policy instruments include:
Subsidies for renewable energy (feed-in tariffs).
Energy efficiency policies for power plants.
Non-fossil targets
Coal cap policies
${}^{7}$ Note that at the fundamental level this categorization is debatable. For example, in the scheme of “cap and trade” of ${\mathrm{{CO}}}_{2}$ emissions in ETS, the “cap” is ultimately set by the government and then the firm get to “trade”. And arguably, to the extent that ETSs in China are still in the piloting stage and carbon pricing is still subject to government guidance, they can be discussed generally under PPA as well. More pointedly, in a transitional economy like China’s, whether or not to set up these markets can be understood as a public policy choice.
Energy efficiency standards for buildings and equipment.
Key enterprise programs.
Economic structural reforms.
Removing fossil fuel subsidies.
Energy intensity targets
Air pollution standards
Differentiated electricity tariffs.
Phasing out old and inefficient power plants.
Electricity sector reform.
Innovation policies
Environmental resource tax
Note that when we reviewed China’s evolving regulatory framework for a low-carbon economy in Chapters 1 and 2 of this study, we found that the variants of these public policy tools listed above have all existed in China. For the purposes of the current study, we put these policy instruments under PPA, and sum them up into three major categories of strategies, i.e., energy efficiency enhancement, cost reduction in energy renewables, and market inclusion and carbon pricing. Below, we elaborate a bit more on them one by one.
Energy Efficiency Enhancement
Generally, carbon emission reduction is a low-carbon strategy, and can be achieved through improving efficient use of fossil energy and reducing the energy consumption of industrial sectors. This appears to be the predominant strategy China has deployed to achieve ${\mathrm{{CO}}}_{2}$ peak before 2030, and there is good reason. According to the statistics from World Bank, the energy intensity of primary energy in China is almost twice as much as German by 2015 (Fig. 1), which indicates China has huge potential to lower the energy intensity and increase utilization efficiency. Ding et al. (2019) calculate the energy intensity of China from 2000 to 2100 based on the change trend of energy intensity from 1980 to 2006. They predict that the annual energy intensity in China would decrease by 3.92% per year. Zhang et al. (2019) forecast the energy intensity for 41 industries of China from 2020 to 2030. They find that the energy intensity falls by 16.1% under scenario of no policy guidance and by 31.9% under scenario with policy guidance. Song et al. (2018) and Niu et al. (2016) make predictions about the energy intensity in China, too. According to above predictions, China’s future energy intensity change located in the range of $1\%$ to $4\%$ . The improvement in energy efficiency has played and will continue to play an important role in helping China peak ${\mathrm{{CO}}}_{2}$ emissions prior to 2030 and achieve carbon neutral in 2060.
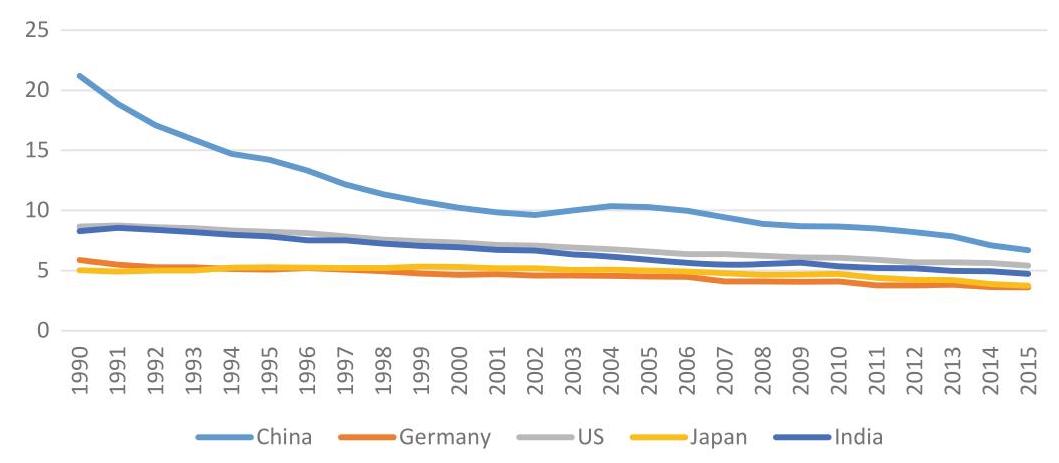
Fig. 1 Energy intensity: China, Germany, US, Japan and India (1990-2015). Source World Bank. Unit: MJ/$2011 PPP GDP
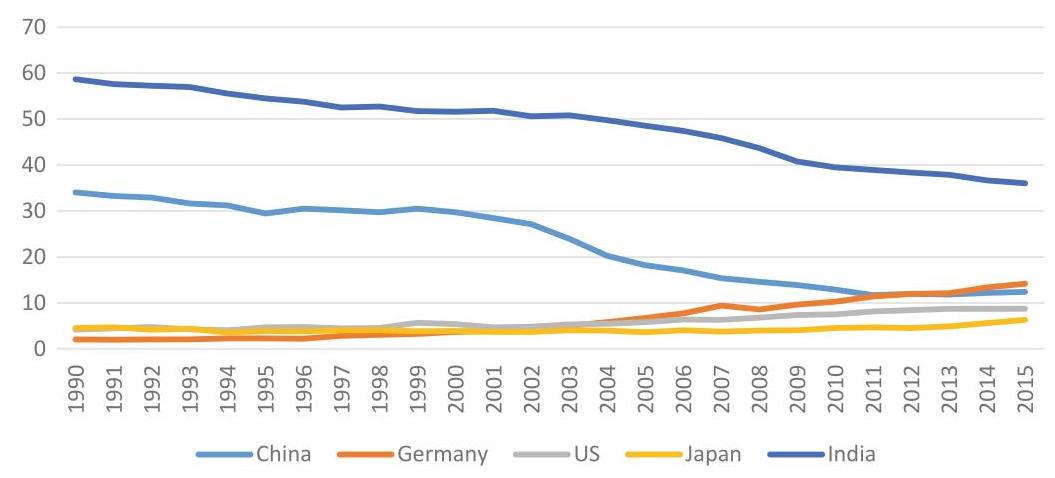
Fig. 2 Share of Renewable Energy: China, Germany, US, Japan and India (1990-2015). Source World Bank Unit: %
Cost Reduction in Renewable Energy
Ultimately, renewable energy is a technological path toward zero-carbon emissions. If a good strategy is a sequence of interconnected foci, then the strategic focus of zero-carbon emissions will have to be in place after China peaks ${\mathrm{{CO}}}_{2}$ emissions by 2030. In the meantime, the decline in the cost of renewable energy such as wind and solar energy as well as biomass energy will promote the transformation toward clean energy and achieve carbon emission reduction. China is experiencing a transition period from a firewood-dominated old era of renewable energies toward a wind energy-, solar energy- and biomass energy- dominated new era of renewable energies (Fig. 2). ${}^{8}$ Based on the estimation of He et al. (2020), the average cost for centralized photovoltaic solar panels, onshore wind energy and battery storage dropped by ${77}\% ,{35}\%$ and ${85}\%$ respectively from 2010-2018. Li et al (2020) finds that the cost of photovoltaic power generation has decreased from 100$/kwh in 1990 to 0.05$/kwh in 2020 and the annual decrease is as high as ${22.38}\%$ . Although China has strived to increase investment in R&D of renewables, the share of renewable energy in China is still below 20%. The aim of carbon neutral by 2060 will require a much lower renewable energy cost and a much higher the proportion of the use of renewable energy.
Market Inclusion and Carbon Pricing
It is being widely adopted to promote carbon emission reduction by pricing carbon emission, such as imposing carbon taxes on industrial sectors and residents, establishing carbon markets (e.g. California’ cap and trade, EU’s emission-trading schemes or ETS). In 2011, China announced to launch seven regional ETS pilots in two provinces (Hubei and Guangdong) and five cities (Beijing, Shanghai, Shen-zhen, Tianjin and Chongqing). These regional ETS pilots are intended to gain experience associated with running carbon markets and to identify problems that should be resolved before moving to a nationwide carbon market. There have been many researches predicting the future carbon price in China.
In 2017, China rolled out a national carbon market but it only included the power sector. It is expected that over time the national market will also include other industrial sectors such as steel and cement, each contributing about 15% to the total industrial ${\mathrm{{CO}}}_{2}$ emissions in China, respectively. Yuan et al. (2020) estimates that the carbon price will reach the highest $\left( {{106.5}\$ /{\mathrm{{tCO}}}{2}}\right)$ by 2090 with reference to the future carbon price calculation formula of Wilkerson et al. (2015). The scenario given by Dong et al. (2017) show that the highest carbon price will reach ${120}$ /{\mathrm{{tCO}}}{2}$ . Above predictions are based on climate goal that China’s carbon emission would peak no later than 2030. The aim of carbon neutral by 2060 urges for higher carbon price levels. This is especially the case, if China eventually connects its domestic ETSs with global ETSs.
${}^{8}$ India is the highest in the proportion of renewable energy among the five countries in Fig. 2 as India is still dominated by firewood.
3 Section 3
3.1 Model Construction and Scenarios Planning
To operationalize our PMCN (PPA + MBA + CCS + NBS) model, we draw upon the tool of recursive dynamic CGE model representing the Chinese economy, named CHINAGEM, ${}^{9}$ and fuse it with the parameters of the PMCN model. Before we proceed further, a word of CHINAGEM is in order. CHINAGEM has been widely used in the evaluations of economic and environmental policies in China. This model is capable of predicting the effect of macro policies on key aggregate indexes, such as GDP, price index, trade and other macroeconomic indicators, as well as industry-level outputs and prices. It contains 159 economic sectors, six economic subjects (manufacturers, investment, households, government, exports, and inventories), and nine distribution sectors (wholesale & retail, warehousing, insurance, rail transport, road transport, water transport, air transport, pipeline transport, transport services).
Carbon emissions from fossil fuel combustion and industrial production processes (excluding energy combustion) are modelled in CHINAGEM. The coefficients of carbon emissions used to calculate the carbon emission from fossil energy combustion are from IPCC AR5 (2014). China’s fossil energy emission from 2017 to 2020 is calibrated according to the IEA World Energy Outlook (2020). In the calculation of carbon dioxide emissions in the industrial production process, we mainly consider the emissions in the cement production, because it accounts for over 70% of the emissions from all the industrial production processes (excluding energy combustion). According to Shan et al. (2019), carbon emissions from cement production in China in 2017 were 7004.4 million tons.
Carbon emission and production input are considered as the two main inputs of cement industry. In the CHINAGEM model, the emission reduction is described as the partial substitution relationship between carbon emission and production input. When the carbon price increases, the cement sector will reduce carbon emission and use more production inputs. In economic sense, cement producers will adopt more carbon reduction technologies when facing higher carbon price, but they will also face higher emission reduction cost. According to Hyman et al. (2002), the substitution elasticity of carbon emission and production input is set as 0.11 .
Carbon emission accounts in the CHINAGEM model are based on fossil energy combustion and industrial production within the whole economic system. The carbon emission accounts are used to predict future carbon emissions in China through 2060.
${}^{9}$ CHINAGEM is developed by the policy research center of Victoria University, Australia.
3.2 Set-Up of Model Parameters
Based on the combination of the PMCN and CHINAGEM models, we analyze the strategic paths leading to net zero carbon emissions by 2060 in China, under several PPA scenarios, including carbon pricing. In setting up key parameters, we first construct the baseline scenario, covering China’s GDP, population, labor force and industrial macroeconomic structure from 2020 to 2060, based on the forecasts of the World Bank, CEPII and other international institutions. Second, drawing upon best estimates by the current studies, we take NBS (e.g., carbon sinks such as forests) and CCS as predetermined, and focus on PPA for decarbonization of industrial processes, either directly (e.g., deployment of (CCS) or indirectly (e.g., energy efficiency enhancement). According to the literature discussion in the previous section, we choose two carbon neutral targets for NBS and CCS-one conservative and one optimistic:
(1) Conservative target: by 2060, NBS and CCS reaches 1.55 billion tons/year (i.e., 700 million tons (NBS) + 750 million tons (CCS)), implying China’s ${\mathrm{{CO}}}_{2}$ emissions need to be reduced to 1.55 billion tons by NBS and CCS in 2060, so that the carbon emissions and carbon sinks can be basically offset, reaching net zero carbon emission;
(2) Optimistic target: by 2060, NBS and CCS reaches 2.8 billion tons/year (i.e., 1.6 billion tons (NBS) + 1.2 billion tons (CCS)), implying that China’s ${\mathrm{{CO}}}_{2}$ emissions need to be reduced to be 2.8 billion tons by NBS and CCS in 2060, so that the carbon emissions and carbon sinks can be basically offset, reaching net zero carbon emissions.
We subsume MBA (e.g., ETSs and green bonds) under PPA, because the future of these market-oriented pilots in China continues to be guided if not totally controlled by the government, although their expansions are expected to be sped up. Under PPA, the policy portfolios include three major categories, i.e., improvement in energy efficiency, cost reduction in renewable energy, and carbon pricing. In analyzing PPA efficacy, we consider the scenarios of single PPA and composite or comprehensive PPA.
3.3 Single PPA Scenarios
(1) Improvement in energy efficiency
As the existing studies forecast that China’s improvement in energy efficiency will be concentrated in the range of $1\% - 4\%$ , we assume the overall energy intensity of industrial sectors decline by the average rate of ${0.5}\% ,1\% ,{1.5}\% ,2\% ,{2.5}\%$ and $3{\% }^{10}$ respectively and we simulate the corresponding policy scenarios.
(2) Cost reduction in renewable energy in China
For the cost reduction in renewable energy, we rely on the forecast of the International Energy Agency (IEA) on the future cost of photovoltaic and wind power generation. Considering that the power generation cost of renewable energy such as photovoltaic has been at a low level and the decline rate will gradually narrow in the future, we set two scenarios of cost reduction in renewable energy in China: one with high rate and the other with low rate. In the high rate of cost reduction scenario, it is assumed that the costs of solar photovoltaic, onshore wind power and offshore wind power decrease by ${3.25}\% ,{1.06}\%$ and ${4.27}\%$ respectively each year in 2020-2060. In the low rate of cost reduction scenario, the costs decrease by 1.62%, 0.53% and 2.13% respectively. At the same time, in the CHINAGEM model it is assumed that the government surcharges on fossil energy to promote the reduction of renewable energy cost.
Referring to the method of Dong et al. (2017), this study sets six scenarios of carbon pricing in which the carbon price in 2060 are 100, 200, 300, 400, 500 and ${600}\$ /{\mathrm{{tCO}}}_{2}$ respectively and assumes that the carbon price increases exponentially. At the same time, it is assumed that the carbon market will have included all major industrial sectors such as power, cement and steel, and that government will transfer all carbon emission tax revenue of carbon pricing policy to residents. The various single PPA scenarios are summarized in Table 1.
3.4 Composite PPA Scenarios
Scholars have proposed that composite or complex PPA portfolios give better results than single PPA for emission reduction. It is believed under composite or complex PPA portfolios the negative impact on the economy will be significantly reduced. For example, Song et al. (2018) find the policy combination can accelerate the peak time of carbon emission, so that China can reach the peak in 2026 when the annual GDP growth rate is not less than 5%. Lin and Jia (2019) also proposed that the simultaneous implementation of carbon trading, energy efficiency improvement, carbon sink and other emission reduction measures would help China reach the peak by 2030. Here, in a way that ranges from the optimistic approach of William Nordhaus (2007) to the pessimistic approach of Nicholas Sterns (2006) regarding global warming, ${}^{11}$ we test 72 PPA combinations of improvement in energy efficiency, cost reduction in renewable energy and carbon pricing, as shown in Table 2.
${}^{10}$ To be conservative, we do not select 3.5% and 4% as the decline rate.
Table 1 Single PPA scenarios
| Strategy | Abbr | Shock | Literature | |
| Improvement in energy efficiency | E | E1 | 0.5% | Ding et al. (2019) |
| E2 | 1% | Zhang et al. (2019) | ||
| E3 | 1.5% | Yuan et al. (2014) Song et al. (2018) | ||
| E4 | 2% | Niu et al. (2016) | ||
| R | E5 | 2.5% | ||
| E6 | 3% | |||
| Cost reduction in renewable energy | R1 | high rate | He et al. (2020) | |
| R2 | low rate | Li (2020) IEA (2020) | ||
| Carbon pricing | T | T1 | 100\$/t ${\mathrm{{CO}}}_{2}$ | Duan et al. (2018) Yuan et al. (2020) Wilkerson et al. (2015) Dong et al. (2017) |
| T2 | 200\$/t ${\mathrm{{CO}}}_{2}$ | |||
| T3 | 300\$/t ${\mathrm{{CO}}}_{2}$ | |||
| T4 | 400\$/t ${\mathrm{{CO}}}_{2}$ | |||
| T5 | 500\$/t ${\mathrm{{CO}}}_{2}$ | |||
| T6 | 600\$/t ${\mathrm{{CO}}}_{2}$ | |||
${}^{11}$ Generally, Nordhaus assumes a high discount rate between the present and the future and therefore proposes a more gradual carbon tax than Stern, who assumes a lower discount rate and advocates stronger and immediate action.
Table 2 Composite PPA Scenarios
| Scenarios | R | A | T | Scenarios | R | A | T |
| 1 | R1 | A6 | T6 | 37 | R2 | A6 | T6 |
| 2 | R1 | A6 | T5 | 38 | R2 | A6 | T5 |
| 3 | R1 | A6 | T4 | 39 | R2 | A6 | T4 |
| 4 | R1 | A6 | T3 | 40 | R2 | A6 | T3 |
| 5 | R1 | A6 | T2 | 41 | R2 | A6 | T2 |
| 6 | R1 | A6 | T1 | 42 | R2 | A6 | T1 |
| 7 | R1 | A5 | T6 | 43 | R2 | A5 | T6 |
| 8 | R1 | A5 | T5 | 44 | R2 | A5 | T5 |
| 9 | R1 | A5 | T4 | 45 | R2 | A5 | T4 |
| 10 | R1 | A5 | T3 | 46 | R2 | A5 | T3 |
| 11 | R1 | A5 | T2 | 47 | R2 | A5 | T2 |
| 12 | R1 | A5 | T1 | 48 | R2 | A5 | T1 |
| 13 | R1 | A4 | T6 | 49 | R2 | A4 | T6 |
| 14 | R1 | A4 | T5 | 50 | R2 | A4 | T5 |
| 15 | R1 | A4 | T4 | 51 | R2 | A4 | T4 |
| 16 | R1 | A4 | T3 | 52 | R2 | A4 | T3 |
| 17 | R1 | A4 | T2 | 53 | R2 | A4 | T2 |
| 18 | R1 | A4 | T1 | 54 | R2 | A4 | T1 |
| 19 | R1 | A3 | T6 | 55 | R2 | A3 | T6 |
| 20 | R1 | A3 | T5 | 56 | R2 | A3 | T5 |
| 21 | R1 | A3 | T4 | 57 | R2 | A3 | T4 |
| 22 | R1 | A3 | T3 | 58 | R2 | A3 | T3 |
| 23 | R1 | A3 | T2 | 59 | R2 | A3 | T2 |
| 24 | R1 | A3 | T1 | 60 | R2 | A3 | T1 |
| 25 | R1 | A2 | T6 | 61 | R2 | A2 | T6 |
| 26 | R1 | A2 | T5 | 62 | R2 | A2 | T5 |
| 27 | R1 | A2 | T4 | 63 | R2 | A2 | T4 |
| 28 | R1 | A2 | T3 | 64 | R2 | A2 | T3 |
| 29 | R1 | A2 | T2 | 65 | R2 | A2 | T2 |
| 30 | R1 | A2 | T1 | 66 | R2 | A2 | T1 |
(continued)
Table 2 (continued)
| Scenarios | R | A | T | Scenarios | R | A | T |
| 31 | R1 | A1 | T6 | 67 | R2 | A1 | T6 |
| 32 | R1 | A1 | T5 | 68 | R2 | A1 | T5 |
| 33 | R1 | A1 | T4 | 69 | R2 | A1 | T4 |
| 34 | R1 | A1 | T3 | 70 | R2 | A1 | T3 |
| 35 | R1 | A1 | T2 | 71 | R2 | A1 | T2 |
| 36 | R1 | A1 | T1 | 72 | R2 | A1 | T1 |
Note Renewable energy policy: R1 cost of renewable energy decreases rapidly, R2 cost of renewable energy decreases slowly; energy efficiency policy: A1 energy efficiency increases by ${0.5}\% /$ year, A2 energy efficiency increases by $1\% /$ year, A3 energy efficiency increases by 1.5%/year, A4 energy efficiency increases by 2%/year, A5 energy efficiency increases by 2.5%/year, A6 energy efficiency increases by 3%/year; carbon price policy: T1 ¥100/tCO2 in 2060, T2 ¥200/tCO2 in 2060, T3 ¥300/tCO2 in 2060, T4 ¥400/tCO2 in 2060, T5 ¥500/tCO2 in 2060, and T6 ¥600/tCO2 in 2060
4 Section 4
4.1 Projection Results Under Different Scenarios
Under the baseline scenario, China’s total carbon emissions in 2060 are 8.812 billion tons, including 7.746 billion tons from fossil energy combustion.
(1) Improvement in energy efficiency
Under single PPA scenarios—energy efficiency improvement, the energy use efficiency of the industry and the residential sector has been improved, which eventually reduces the demand for all energy products. The output of fossil energy sector drops significantly, which leads to a significant reduction of carbon emissions compared to the baseline scenario.
The total carbon emissions are significantly reduced compared to the baseline scenario. By 2060, the total carbon emissions of the A1-A6 scenarios drop to 7.83 billion tons, 7.0 billion tons, 6.30 billion tons, 5.69 billion tons, 5.17 billion tons and 4.72 billion tons respectively (Fig. 3), which are reductions of 11.2-46.4%, as compared with the baseline scenario.
Carbon emissions may peak earlier than 2028, but they are still far from achieving the carbon neutral target in 2060 (Fig. 4).
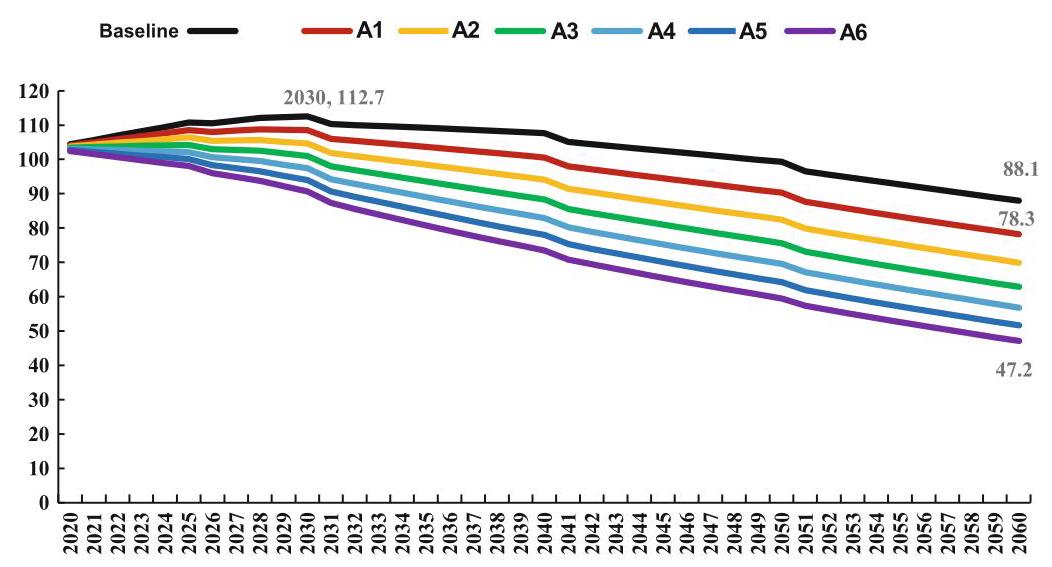
Fig. $3{\mathrm{{CO}}}_{2}$ emissions in China (2020-2060) by various scenarios of energy efficiency improvement (Unit: 0.1 billion tons) Note: A1 energy efficiency increase by 0.5%/year, A2 energy efficiency increase by 1%/year, A3 energy efficiency increase by 1.5%/year, A4 energy efficiency increase by $2\% /$ year, A5 energy efficiency increase by ${2.5}\% /$ year, A6 energy efficiency increase by $3\% /$ year
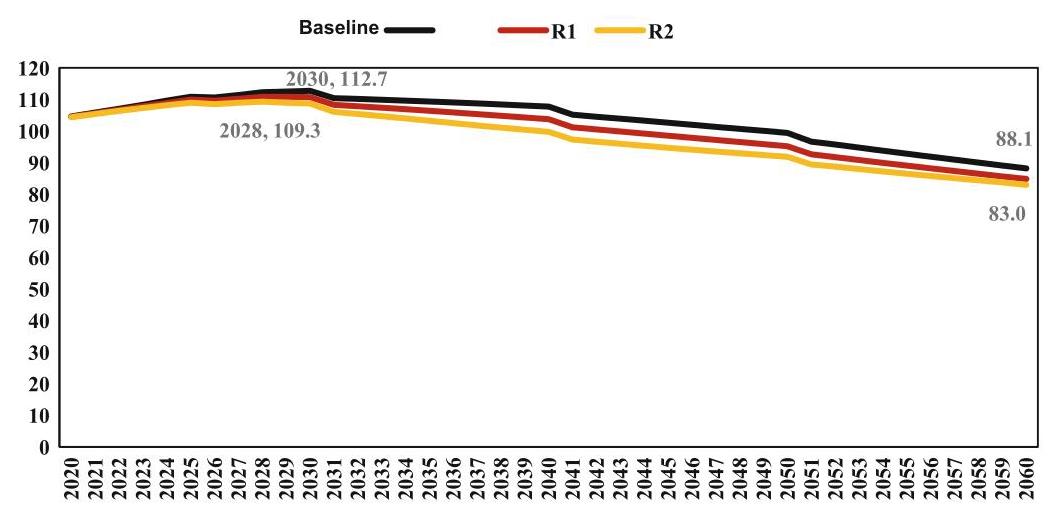
Fig. $4{\mathrm{{CO}}}_{2}$ Emissions in China (2020-2060) by various scenarios of renewable energy cost reduction (Unit: 0.1 billion tons) Note: R1 Cost of renewable energy decreases rapidly, R2 Cost of renewable energy decreases slowly
(2) Cost reduction in renewable energy
In renewable energy cost reduction scenarios, the cost reduction of wind power, solar power and biomass power will reduce the average price of power, leading to the substitution of coal power and gas power and the reduction of fossil energy consumption. As shown in Fig. 4, by 2060, the emissions of low rate cost reduction (R1) and high rate cost reduction (R2) scenarios are 8.48 billion tons and 8.3 billion tons, respectively, which are reductions of 3.8% and 5.8% compared with the baseline. The emission reduction effect is weaker than that of the energy efficiency-improving scenarios, which is far from the carbon neutral target.
(3) Market inclusion and carbon pricing
In the scenario of increasing carbon tax, carbon emissions decrease to 7.93 billion tons, 7.51 billion tons, 7.19 billion tons, 6.94 billion tons, 6.73 billion tons and 6.55 billion tons in 2060, respectively (Fig. 5). Compared with the baseline in 2060, the emission reduction ranges from 880 million tons to 2.26 billion tons, which are reductions of 10.0-25.7%. The total emission differences among different carbon tax scenarios showed an increasing trend over time, possibly because that we set carbon tax to increase exponentially.
(4) Composite PPA scenarios
As shown in Fig. 6, the composite PPA effectively reduces China’s total carbon emissions from 2020 to 2060, but there is still a certain gap with the carbon neutral target in 2060. As previously mentioned, in 2060, China’s negative emissions from forest carbon sinks and CCS technologies will not exceed 3 billion tons. Therefore, the carbon neutral requires that the total carbon emissions in 2060 should be controlled within 3 billion tons. Under the most active combination of PPA instruments for emission reduction (R1T6A6), the total carbon emission in 2060 is 3.235 billion tons, which is 235 million tons higher than the 3 billion tons’ target (Fig. 6). As a conclusion, only relying on carbon price, energy efficiency and renewable energy policy instruments cannot meet the requirements of the 2060 carbon neutral target.
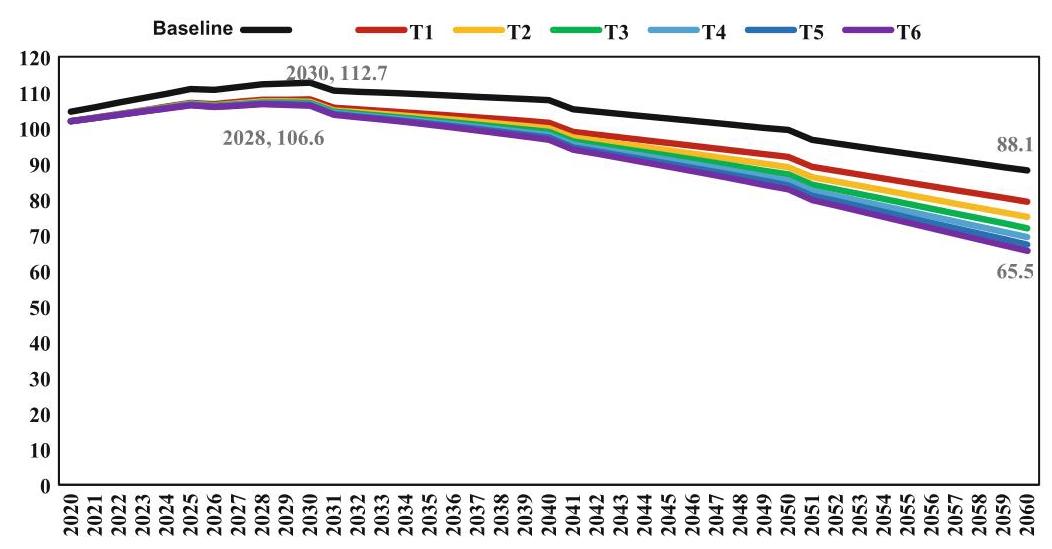
Fig. 5 ${\mathrm{{CO}}}_{2}$ Emissions in China (2020-2060) by various scenarios of carbon pricing (Unit: 0.1 billion tons). Note T1 $100/tCO2 in 2060, T2 $200/tCO2 in 2060, T3 $300/tCO2 in 2060, T4 $400/tCO2 in 2060, T5 $500/tCO2 in 2060, and T6 $600/tCO2 in 2060
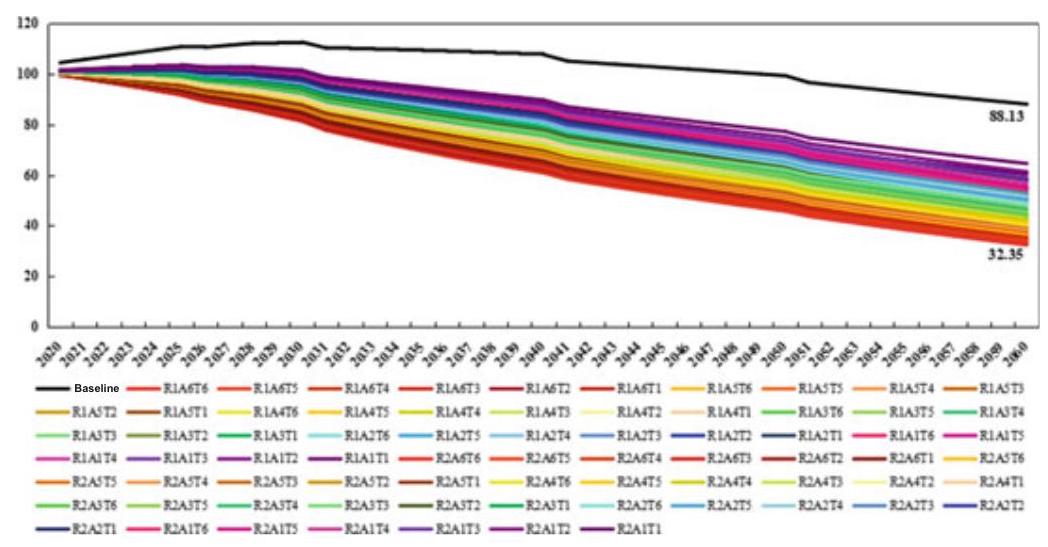
Fig. 6 ${\mathrm{{CO}}}_{2}$ Emissions in China (2020-2060) by various scenarios of policy portfolios (Unit: 0.1 billion tons). Note As an example, R1A6T6 indicates a combination of policy R1, A6 and T6
4.2 Impact on Energy Structure
Composite PPA rather than single PPA for emission reduction reshapes the future structure of energy demand more powerfully. In the baseline scenario, the energy demand in 2060 is 6.239 billion tons of standard coal, with coal accounted for 31.5%, renewable energy accounted for 35.9%, and oil, natural gas and nuclear energy accounted for 12.2%, 14.9% and 5.4% respectively (Fig. 7). Under composite PPA scenarios, the total energy demand in 2060 will decrease to 2.22-5.49 billion tons of standard coal. Renewable energy accounts for 27.3-77.5% of the total energy demand, while coal accounts for 8.1-41.6%, oil accounts for 11.4- 13.9%, natural gas accounts for 2.0-17.7%, and nuclear energy accounts for less than $4\%$ .
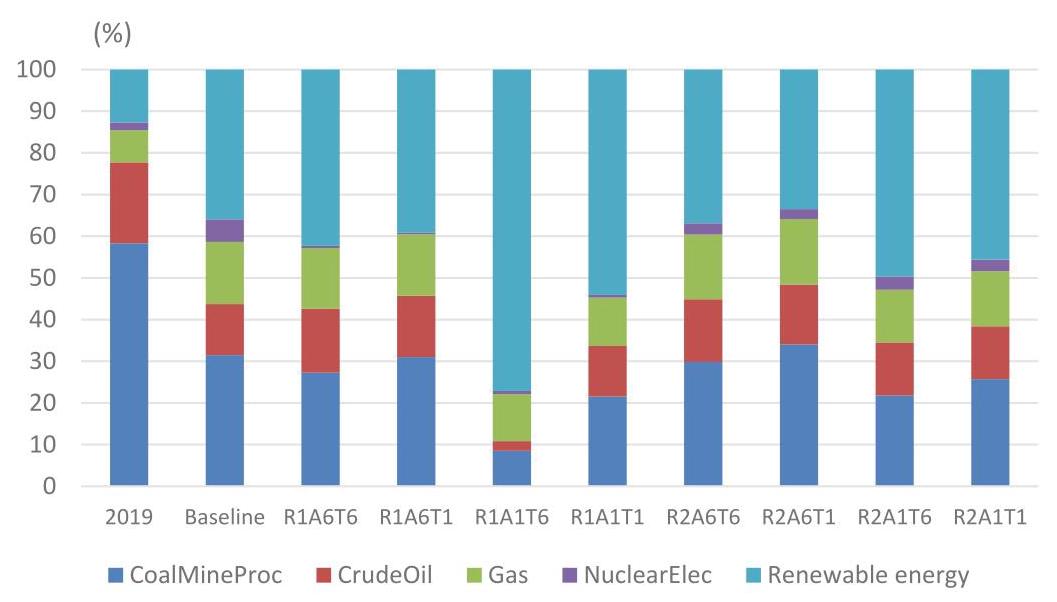
Fig. 7 Energy Structure in China in 2060 by various scenarios of policy portfolios (Unit: %)
4.3 Impact on Economy
Climate mitigation and adaptation comes at the cost of economic loss. We find that (1) GDP loss and emission reduction show an obvious positive correlation (Fig. 8). That is, to obtain greater carbon emission reduction, we need to bear greater GDP loss; (2) Compared with energy efficiency improvement and carbon price policies, the rapid cost reduction of renewable energy has higher emission reduction potential and smaller economic loss cost; (3) Based on the tradeoff between emission reduction benefits and economic loss, the policy combination of low energy efficiency improvement and high carbon price is better than that of high-energy efficiency improvement and low carbon price.
Fig. 8 Tradeoff between ${\mathrm{{CO}}}_{2}$ Emission and GDP Loss in China in 2060, by various scenarios of policy portfolios Note Blue dot represents some one policy portfolio
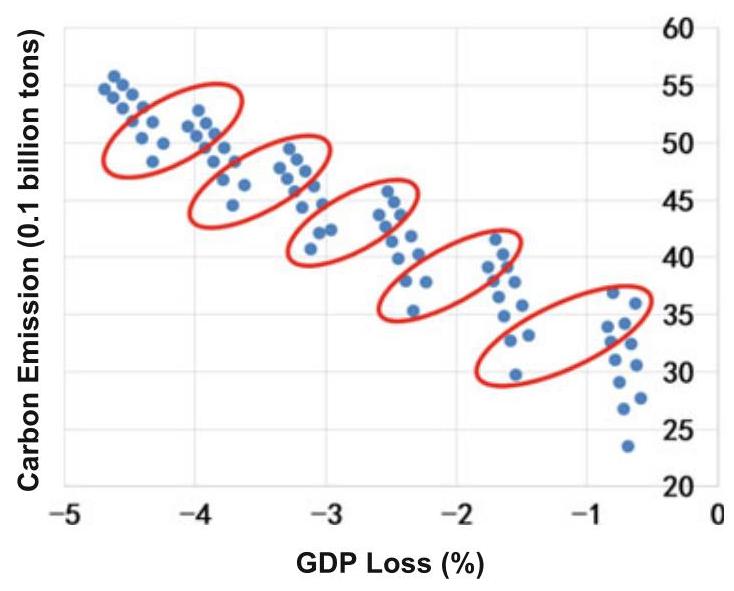
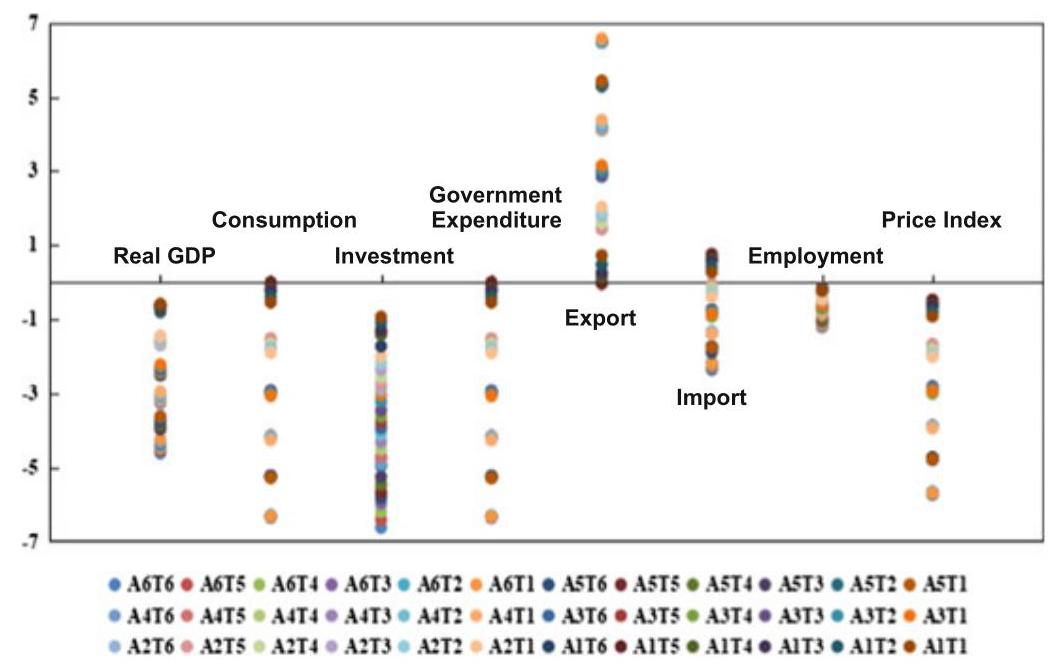
Fig. 9 Impact of policy portfolios on macroeconomic variables in China in 2060
For other macroeconomic variables (Fig. 9), we find that: (1) A complex PPA strategy for emission reduction significantly decreases the output of fossil energy sector; (2) Energy efficiency policy not only improves energy efficiency, but also reduces labor demand of industrial sector, and therefore leads to a decrease in total employment by a magnitude of 0.13-1.22%; (3) A complex PPA strategy increases the use cost of fossil energy and reduces the demand for fossil energy products, and thus reduces the investment in the fossil energy sector; (4) The loss of economy causes the decline of national income, which makes the consumption of residents and government expenditure decrease in different degrees; (5) The decline of energy demand reduces the price of energy products; (6) The export demand increases in almost all complex PPA scenarios but the import demand is the opposite. The lower price level has a pulling effect on export. Meanwhile, the rise of energy cost weakens the competitiveness of non-energy products, making the import of products increase.
4.4 Concluding Remarks
Key Takeaways
To achieve carbon neutral goal by 2060, improvement in energy efficiency, cost reduction in renewable energy and carbon pricing are all necessary, but not enough even in a combination of all above strategies. New policy instruments, especially for a more powerful shift from fossil to no-fossil fuels, are needed to achieve the carbon neutral goal in time.
All the strategies of carbon emission reduction come at the cost of GDP loss, with modest declines in employment, investment, and consumption. Having said that, however, a better calibrated mix of policy instruments will take smaller costs of economic loss. In this study, we recommend the combinations of low energy efficiency improvement and high carbon price, including carbon taxation rather than campaign-style, across-the-board prohibition. ${}^{12}$ In other words, on balance, MBA is the preferred approach.
Combined PPA aiming at de-carbonization will reshape the future structure of energy demand dramatically. Renewable demand will increase and the fossil energy demand, especially coal demand, will decrease. Yet a caveat is in order here. Even in the most comprehensive of all PPA scenarios available today, by 2060, renewable energy will only accounts for less than 80% of the total energy consumption, ${}^{13}$ while fossil energy still accounts for more than ${20}\%$ . Promoting electric vehicle sector development and other forms of electrification would become especially important for further reductions in fossil energy demand. In this context, as a matter of rational strategic sequencing, priorities should be given for the electricity sector to achieve zero carbon ahead of end users, and it makes sense to include the electricity sector first in the country’s national carbon market.
And hopefully, other variables so far exogenous to the current parameters of our model-e.g., technology breakthroughs, including additional PPA instruments—may come along the way.
12 As a policy recommendation, one way to consider imposing carbon taxation would be: (a) to figure out the sector-specific average level of carbon intensity, say, in every 3-5 years; and (b) to impose progressive taxes on those that are above the average level of carbon intensity and subsidize those below the average level for technology innovations toward further decarbonization.
${}^{13}$ In terms of wind power, in light of the great heterogeneity of wind source across the vast territories of China, enhanced regional coordination in stable power supply would be critical.
Challenges and Opportunities
China’s goal of achieving carbon neutrality by 2060 means profound transformation of the world’s second-largest economy and the biggest emitter. Indeed, just as Chinese President Xi Jinping said at the U.N. General Assembly in September 2020, China must undergo a “green revolution”. To achieve carbon neutrality by 2060 is a very tall order, as China currently relies heavily on coal–one of the most carbon-intensive fossil fuels. The other challenge is the relatively short time. The EU plans to spend 50-70 years from carbon emission peak to carbon neutral, but China only has a thirty-year schedule. There are numerous challenges in the nexus of policy, technology, and economy. The time constraint makes the challenges even larger.
But there is also a bright side. Looking ahead, China still enjoys the advantage of backwardness. Its urbanization was about ${18}\% {40}$ or so years ago, and it has now reached about 60%. By comparison, it is 92% for Japan and 82% for the United States (United Nations, 2018). Moving forward, there is huge room for building smart-cities. Smart-cities integrate real-time data from diverse data sources into a single data hub, where huge amounts of data are analyzed and used to inform management and planning decisions. Instead of retrofitting old cities, smart-city projects can involve building brand-new cities that are eco-friendly and energy efficient from the ground up by deploying low-carbon, zero-carbon and negative-carbon technologies simultaneously. As a top priority for designing and building smart cities in the future, energy efficiency towards carbon neutrality can be optimized through a combination of sensor technology, big data, and data science.
And within our PPA + MBA + CCS + NBS framework, PPA aside, CCS, MBA, and NBS may have higher potential on carbon removal than we had predicted. As we have seen in previous chapters (esp. Chapters 1, 3, 4, 5, and 6), in recent years China has made remarkable progress in CCUS/CCS pilots and has learnt a great deal from its own experience of ETSs as well. As a negative ${\mathrm{{CO}}}_{2}$ emission technology, CCUS, especially CCS + EOR, will be more attractive when the carbon price is sufficiently high and when the technology becomes more mature or advanced.
Expansion of green financing—a typical example of MBA—also helps in terms of financing CCS or CCUS, and we can expect more applications of CCUS years down the road. Generally, green loans, green bonds and green insurance can be powerful tools–via price signaling, risk management and resource allocation–to facilitate industrial transformation, including energy structure from fossil to non-fossil fuels. We recommend that much more work be done on that front for China to achieve carbon neutrality by 2060. Indeed, to phase out coal more aggressively with renewables will be particularly important for China, as our simulation model indicates. There, the good news is that since 2016 when China held the presidency of G20 summit meeting and included the topic of “green finance” into the G20 agenda, the country has made impressive progress in green finance. According to the latest statistics by the Research Bureau of PBOC, by the end of 2020, green loans in China totaled 12 trillion RMB or about 1.8 trillion US dollars (largest in the world), and the stock of green bond reached 813.2 billion RMB or about 125 billion US dollars (second largest in the world, next to the US). Their estimation was that so far the yearly average of green financing in China was equivalent to a reduction of ${100}{\mathrm{{MtCO}}}_{2}$ emissions, more than $1\%$ of the national total $(9,{800} \; {\mathrm{{MtCO}}}_{2}$ in 2017), and the number is expected to rise years ahead.
There is also good news on NBS, Wang et al. (2020) have recently published a pioneer research in Nature. They reevaluate the carbon absorption capacity of terrestrial ecosystem in China and find terrestrial ecosystems, including forests, absorb about 1.11 billion tons of carbon annually from 2010 to 2016, which is 45% of anthropogenic carbon emissions in the same period. While their calculation, i.e. 45%, may have been overestimated and our own estimation is about 10%, their research does suggest that the role of forest carbon sink should be examined more closely. The wood products in China also have great potential (Xu et al., 2020), and the potential for increasing carbon sinks in wood products is estimated at 1.15 billion tons per year around 2060.
Uncertainties
As indicated above, many uncertainties remain around achieving carbon neutral in China by 2060. R&D for de-carbonization strategies seems a least-regret option. Indeed, looking at the endless frontier of science and technology, scientists and engineers around the world have been working on nuclear fusion of hydrogen, and if one day that becomes successful both scientifically and commercially, it will be a game changer in energy transformation. It means almost boundless supplies of zero- ${\mathrm{{CO}}}_{2}$ , clean, and safe energy on Earth. But as history shows, technology only evolves and comes with many contingencies. Alternative strategies are necessary when progress of technologies is not on schedule. In transition period, the conflict of interests is unavoidable, particularly in the energy complex. ${}^{14}$ Our model is incapable for the simulation of conflict of interests, the politics of which, especially geopolitics, in fact carries high social and economic costs. There are also uncertainties in the deployment of renewable energy in sectors that are more difficult to be electrified in the near future. These sectors are those with high temperature industrial processes, city transportations, trains, shipping, and aviation, etc. In any case, for electrification to work as a tool for decarbonization, the precondition is that the source of power has to be made clean first, that is, in forms of non-fossil rather than fossil such as coal, which dominates China’s energy structure today. ${}^{15}$ Otherwise, as a net outcome in the energy complex, one may end up emitting more ${\mathrm{{CO}}}_{2}$ than reducing it in electrification.
14 The current dual-track system of ETSs in China—seven regional markets and one national market-is an illustration of the latent issue of conflict of interest unique to the political economy of the vast country. Given different industrial structures across different regions
A final note: Globally, in the European Union, for instance, of late there has been talks or proposals about transborder carbon taxes. How that will figure in the prospect of Chinese exports (e.g., crude steel or steel products) is an area that needs to be further studied. ${}^{16}$
in China, arguably one national ETS covering all industrial sectors and all at once without transition period runs the risk of widening rather than narrowing the already palpable regional imbalances in terms of both economic development and wealth distribution. Unlike regional ETSs which cover different industrial sectors, China’s national ETS, as currently designed, only covers the power sector, and electricity is more or less homogenous across the whole country.
${}^{15}$ For instance, presently about ${60}\%$ of power or 1.08 billion kw of electricity in China is coal-fired, and much of it was installed in the past 15 years, and normally won’t retire until 20-30 years later. Early retirement will incur additional costs ceteris paribus-a daunting task especially for economically poor regions of China.
${}^{16}$ If the US and EU decide to impose transborder carbon tax, that would have significant impact on Chinese exports, as well as on exports from other developing countries. A critical variable to consider here is to what extent would the transborder carbon tax be earmarked for green technology transfers from the developed to the developing countries.
J. Fu et al.
Acronym Full spelling
BECCS Bioenergy with carbon capture and storage
CCS Carbon capture and storage
CCUS Carbon capture, utilization and storage
DICE Dynamic integrated model of climate and the economy
EU European Union
GHG Greenhouse gas
IUCN The International Union for the Conservation of Nature
MBA Market-based approach
NBS Nature-based solutions
NDC Nationally determined contributions
PPA Public policy approach
References
Bellassen, V., & Luyssaert, S. (2014). Carbon sequestration: Managing forests in uncertain times. Nature, 506(7487), 153-155. https://doi.org/10.1038/506153a
China Ministry of Environmental Protection. (2019). China’s climate change policy and action 2019 annual report. Retrieved from http://www.mee.gov.cn/ywgz/ydqhbh/qhbhlf/ 201911/P020200121308824288893.pdf
Cohen-Shacham, E., Walters, G., Janzen, C., & Maginnis, S. (2016). Nature-based solutions to address global societal challenges, xiii+97. IUCN.
Ding, S., Zhang, M., & Song, Y. (2019). Exploring China’s carbon emissions peak for different carbon tax scenarios. Energy Policy, 129, 1245-1252.
Duan, H., Mo, J., Fan, Y., et al. (2018) Achieving China’s energy and climate policy targets in 2030 under multiple uncertainties. Energy Economics, 70, 45-60.
Dong, H., Dai, H., Geng, Y., et al. (2017). Exploring impact of carbon tax on China’s CO2 reductions and provincial disparities. Renewable and Sustainable Energy Reviews, 77, 596-603.
Gallagher, K. S., Zhang, F., Orvis, R., Rissman, J., & Liu, Q. (2019). Assessing the policy gaps for achieving China’s climate targets in the Paris Agreement. Nature Communications, 10(1), 1-10.
Hardin, G. (1968, December 13). The tragedy of the commons. Science, 162(3859), 1243- 1248.
He, G., Lin, J., et al. (2020). Author correction: rapid cost decrease of renewables and storage accelerates the decarbonization of China’s power system. Nature Communications, 11, 2486.
He, J., Gou Di, Z., Zhan, T. F., Zhuan, Y., Lu, X., & Jiu, J. Y. (2020) [EB/OL]. http://iccsd.tsi nghua.edu.cn/wap/news-301.html
He, J., Zhong, G., Di, T., Fa, Z., Yu, Z., Xing, L., & Jing, Y. J., [EB/OL]. (2020). http://iccsd.tsinghua.edu.cn/wap/news-301.html.
Hyman, R. C., Reilly, J. M., Babiker, M. H., & De Masin, A. (2002). Modeling non- ${\mathrm{{CO}}}_{2}$ greenhouse gases. MIT, US.
IEA, 2020. World Energy Outlook 2020. Available from: http://www.worldenergyoutlook.org/.
IPCC. (2018). Global warming of 1.5°C. An IPCC Special Report on the impacts of global warming of ${1.5}^{ \circ }\mathrm{C}$ above pre-industrial levels and related global greenhouse gas emission pathways, in the context of strengthening the global response to the threat of climate change.
Jin, L., Yi, Y., & Xu, J. Forest carbon sequestration and China’s potential: The rise of a nature-based solution for climate change mitigation. China Economic Journal, 200-222. https:// doi.org/10.1080/17538963.2020.1754606.
Li, C., Zhou, C., Peng, W., Lv, Y., & Luo, X. (2020). Accurate prediction of short-term photovoltaic power generation via a noval double-input-rule-modules stacked deep fuzzy method. Energy, 212, 1-13.
Lin, B., & Jia, Z. (2019). Energy, economic and environmental impact of government fines in China’s carbon trading scheme. Science of the Total Environment, 667, 658-670.
Nature. (2017). Nature-based solutions’ is the latest green Jargon that means more than you might think. Nature, 541(7636), 133-134. https://doi.org/10.1038/541133b
Niu, S., Liu, Y., Ding, Y., et al. (2016). China’s energy systems transformation and emissions peak. Renewable and Sustainable Energy Reviews, 58, 782-795.
Nordhaus, W. D. (2007). A review of the Stern review on the economics of climate change. Journal of Economic Literature, 45(3), 686-702.
Nordhaus, W. D., & Boyer, J. (2000). Warming the world: Economic models of global warming. The MIT Press.
Shan, Y., Zhou, Y., Meng, J., Mi, Z., Liu, J., & Guan, D. (2019). Peak cement-related ${\mathrm{{CO}}}_{2}$ emissions and the changes in drivers in China. Journal of Industrial Ecology, 23(4), 959- 971.
Song, J., Yang, W., & Wang, S. (2018). Exploring potential pathways towards fossil energy-related GHG emission peak prior to 2030 for China: An integrated input-output simulation model. Journal of Cleaner Production, 178, 688-702.
Stern, N. (2006). The economics of climate change: The stern review. Cambridge: Cambridge University Press.
UNFCCC. (2019). Climate ambition alliance: Nations renew their push to upscale action by 2020 and achieve net zero ${\mathrm{{CO}}}_{2}$ emissions by 2050.
United Nations. (2018). Department of Economic and Social Affairs, Population Division (2018). World Urbanization Prospects: The 2018 Revision, Online Edition.
Wilkerson, J. T., Leibowicz, B. D., & Turner, D. D. (2015). Comparison of integrated assessment models: Carbon price impacts on U.S. energy. Energy Policy, 76, 18-31.
Yuan, J., Xu, Y., Hu, Z., Zhao, C., Xiong, M., & Guo, J. (2014). Peak energy consumption and ${\mathrm{{CO}}}_{2}$ emissions in China. Energy Policy, 68, 508-523
Yuan, Y., Duan, H., Tsvetanov, T. G. (2020). Synergizing China’s energy and carbon mitigation goals: General equilibrium modeling and policy assessment. Energy Economics, 104787.
Xu, J., Da, G., Cheng, N., Yu, Z., Guo, N., Xing, Z. (2020). [EB/OL]. https://mp.weixin.qq.com/s/-dlRSV1b5WyKfn-nEcGfdA
Zhang, P., Shi, X., Sun, Y., Cui, J., & Shao, S. (2019). Have China’s provinces achieved their targets of energy intensity reduction? Reassessment based on nighttime lighting data. Energy Policy, 128, 276-283.
Correction to: Climate Mitigation and Adaptation in China
Jun Fu, Dongxiao Zhang, and Ming Lei
Correction to:
J. Fu et al. (eds.), Climate Mitigation and Adaptation in China,
https://doi.org/10.1007/978-981-16-4310-1
In the original version of the book, Sect. 4.2 in Chap. 1 was revised. A new sentence has been added on page 29. The chapter and the book have been updated with the change.
In the original version of the book, Chap. 4 was revised. A new sentence has been added on page 109. The chapter and the book have been updated with the change.
The original version of Chap. 5 was updated with few word corrections on page 198. The chapter has been updated with the changes.
In the original version of the book, the following belated corrections were updated: In Chap. 7, a new sentence has been added on pages 254 and 272, respectively, in Sects. 2.1 and 4.4, and the symbol in the Table 2 note has been changed from “$” to “$” in Sect. 4.1. The chapter and the book have been updated with the changes.
https://doi.org/10.1007/978-981-16-4310-1_8
The updated versions of these chapters can be found at
https://doi.org/10.1007/978-981-16-4310-1_1,
https://doi.org/10.1007/978-981-16-4310-1_4,
https://doi.org/10.1007/978-981-16-4310-1_5,
https://doi.org/10.1007/978-981-16-4310-1_7.
Index
A
Adaptation, 4, 9, 16, 25, 29, 36, 253, 268
Advantage of backwardness, 271
Air pollutant emission, 39
Air pollution, 227
Air pollution standards, 256
Allowance allocation, 221, 227-229
American Clean Energy Leadership Act, The, 16
American Reinvestment and Recovery, 17
Anthropogenic ${\mathrm{{CO}}}_{2}$ emission, 61,220
Anthropogenic greenhouse gas, 3
AOD process, 77
Arthur Pigou, 185
Asian Development Bank, 28
Asia Pacific, 22
Assigned Amount Units (AAUs), 243
Australia, 22, 23, 25, 125, 259
Automobiles, 5
Auxiliary system, 49, 63
Aviation, 185, 223, 224, 226, 236, 273
B
Baseline and credit approach, 222, 236
Baseline scenario, 48, 49, 231, 232, 260, 264, 267
Basic Oxygen Furnace (BOF), 76, 110
Battery storage, 258
Beijing, 11, 183, 186-188, 192-196, 198, 200, 202, 203, 205, 207, 209, 211, 222, 223, 225, 226, 254, 258
Benchmarking, 221, 223, 225, 229
Best Available Technologies (BATs), 3, 16, 29, 41
Big bang approach, 213
Big data, 271
Bioenergy with ${\mathrm{{CO}}}_{2}$ Capture and Storage (BECCS), 20, 61, 254
Biofuels, 81, 254
Biomass energy, 81, 252, 257
Blast Furnace Gas (BFG), 114, 115, 118, 119, 121-123, 125, 130-138, 144, 146, 148, 149, 152, 157, 158, 161, 171, 173-175
Blast Furnaces (BFs), 14, 36, 40, 63, 64, 74, 110-112, 114, 115, 117-119, 121, 126, 157, 158, 173-175
Brown assets, xiii
Building material, 13, 15, 223, 225, 235
Business model, 20, 109
C
California, 17, 195, 198, 251, 258
Canada, 16-18, 27, 98, 99, 171, 251
Cap and trade, 255, 258
Capillary trapping, 91
Capture technology, 17, 66-71, 120, 122, 123, 132
Carbon Capture and Storage (CCS), 16-18, 20-22, 26, 29, 50, 52, 61, 72, 73, 83-85, 87, 89, 90, 96-99,
111, 112, 227, 229, 231, 249, 252-255, 260, 267, 271
Carbon capture technology, 66, 113, 120, 126, 174, 235
Carbon Capture, Utilization and Storage (CCUS), 4, 9, 11, 12, 16-30, 36, 41, 44, 45, 47-54, 61, 109, 176, 196, 220, 227-237, 253
Carbon dioxide, 3, 24, 25, 61, 74, 81, 84, 95, 96, 163, 228, 250, 251, 253, 259
Carbon emissions, 3, 4, 7, 10, 12, 14, 16, 20, 22, 23, 39, 40, 48-51, 54, 61, 81, 110, 174, 185-187, 200, 204, 205, 208, 209, 212, 222, 225, 235, 237, 238, 249-252, 255, 256, 258-261, 264, 266-268, 270-272
Carbon emissions trading, 11, 15, 27
Carbon intensity, 4, 10, 13, 14, 25, 26, 41, 49,50,186,187
Carbon market, 11, 14, 15, 35, 41, 183, 184, 186, 187, 193, 195-197, 207, 210-213, 219-221, 225, 227, 235-238, 254, 258, 261, 270
Carbon neutrality, 17, 19, 26, 29, 36, 45, 51, 249, 251, 252, 271
Carbon peak, 25
Carbon price, 196, 197, 210, 219, 230, 233, 234, 237, 238, 258, 259, 261, 267-271
Carbon pricing, 18, 226, 255, 256, 258, 260-262, 266, 270
Carbon sequestration, 17, 24, 253
Carbon Sequestration Leadership Forum (CSLF), 253
Carbon sinks, 231, 253, 254, 260, 262, 267, 272
Carbon tax, 17, 213, 258, 266, 273
Carbon transport, 28
Carbon utilization technology, 72
Carrots, 9, 10, 12, 15
Casting process, 79
CCUS project, 16, 18, 19, 21-24, 26, 28, 30, 45, 51-53, 109, 227, 230-238
Cement, 7, 12, 22, 23, 28, 30, 35, 61, 64, 89, 92, 188, 220, 223, 224, 258, 259, 261
Central Asia, 21
Certified Emission Reductions (CERs), 222, 231
${\mathrm{{CH}}}_{4},3,{113},{115},{117},{188},{250}$
Chemical absorption, 67, 120, 121, 126, 130-140, 142-144, 146-162, 164-175
Chemicals, 13, 15, 26, 28, 63, 66, 67, 69, 70, 92, 95, 97, 111, 120, 121, 126, 127, 130, 131, 133-136, 150, 151, 153, 154, 159, 160, 165-169, 185, 188, 204, 224, 225, 235
Chicago Climate Exchange (CCX), 185
China Association of Metalscrap Utilization (CAMU), 43
CHINAGEM, 259-261
China National Petroleum Corporation (CNPC), 97
China United Coalbed Methane, 97
China-US Joint Presidential Statement on Climate Change, 15
Chinese Academy of Sciences, 80
Chinese Certified Emission Reduction (CCER), 53, 188, 189, 191, 194, 226, 227, 230, 232, 233
Chongqing, 11, 183, 186-189, 193-196, 198, 200, 205, 208, 209, 212, 215, 222, 223, 226, 254, 258
Clean Development Mechanism (CDM), 222, 231, 233
Clean growth, 19
Climate change, 3, 4, 9-11, 16, 18, 19, 25, 29, 36, 41, 43, 61, 183, 207, 214, 216, 225, 227, 249-253
Climate change law, 10, 11
Climate change levy, 19
CNPC Jilin Oilfield, 28
${\mathrm{{CO}}}_{2},3,4,7 - {10},{12} - {23},{25} - {30},{35},{36}$ , 40, 41, 44, 45, 47-53, 55, 61, 66-84, 86-98, 164, 171-176, 183-185, 188, 194, 196-200, 204-208, 211, 215, 219, 220,
222, 225, 227, 228, 230, 232, 235-238, 240-242, 250-258, 260, 265-268, 271
${\mathrm{{CO}}}_{2}$ -EOR, 17, 18, 28, 61, 73, 85, 97-99, 254
${\mathrm{{CO}}}_{2}$ leakage,88,91
${\mathrm{{CO}}}_{2}$ pipeline transport,84
Coal, 7, 14, 15, 18, 21-23, 27, 30, 48, 63, 64, 74, 80, 89, 93, 95, 96, 110, 112-114, 143, 152, 171, 228, 252, 255, 266, 267, 270, 271
Coal cap policies, 255
Coal-fired power plant, 18, 21, 26, 27, 30, 51, 119, 149, 152, 164, 185, 254
Coal seams, 95
Coking, 43, 47, 63, 110, 112, 113, 204
Common and differentiated responsibilities, vi
Compliance, 188, 189, 191-194, 207, 210, 221, 227, 228, 230, 236, 238
Conceptual framework, 250, 252, 253
Construction, 17, 22, 25, 26, 28, 45, 51, 53, 64, 71, 84, 86, 94, 185, 186, 210, 211, 225, 250, 254, 259
Consumption, 23, 36, 39, 75, 77, 82, 157, 229, 241, 269, 270
Continuous casting process, 65, 79
Converter process, 75, 77, 80, 110
Converter steelmaking, The, 64
Copenhagen Climate Change, 4
Cost reduction, 220, 256, 260-262, 265, 266, 268, 270
COVID-19 pandemic, 38
Cross-disciplinary, v
Crude steel, 6, 7, 14, 36-40, 42, 43, 49, 51, 110, 220, 229, 240, 273
Cryogenics capture technology, 69
D
Data science, 271
Debt rate, 14
De-carbonization, 9, 260, 270, 272
Deep-sea sediments, 95
Demonstration, 11, 17, 19, 23, 24, 27-29, 44, 45, 50, 51, 53, 71, 83, 85,
97, 99, 121, 125-127, 130, 131, 135, 136, 143, 150, 152-154, 158-160, 165, 166, 168, 169, 171, 172, 188, 230, 233-235, 237, 254
Denmark, 251
Dephosphorization, 65, 76, 77
Depleted oil and gas reservoirs, 93
Design options, 219, 220, 235-238
Developmental path, 25
DICE, 213, 214, 250
Direct Air Capture (DAC), 72
Domestic agenda, 4
Direct Reduce Ion (DRI), 110
Dunhua Methanol Plant, 28
Dust reduction, 75, 77
E
EAF process, 78
Eco-civilization, 25, 41
Economic incentives, 9, 12, 13
Ecosystem, 15, 25, 253, 255
Electric Arc Furnaces (EAF), 6, 40, 41, 43, 49, 50, 62, 78, 82, 110
Electricity, 15, 21, 45, 48, 115, 119, 123, 188, 204, 226, 236, 242, 256, 270, 273
Electriciy Swing Absorption (ESA), 123
Electric vehicle, 270
Electrification, 49, 270
Electrolytic aluminum, 12, 185, 223
Emerging carbon capture technology, 71
Emerging technology, 4, 11, 16, 237
Emissions Trading Group (ETG), 185
Emission-Trading System (ETS), 10-12, 14, 15, 18, 19, 35, 41, 183-200, 204, 205, 207-213, 219-230, 233-238, 254, 255, 258
Employment, 269, 270
Energy, 7, 9, 12, 13, 17-19, 21-24, 27, 28, 35, 36, 39-43, 45, 48-52, 68-70, 74, 78, 81, 82, 84, 85, 87, 89, 110, 111, 114-116, 120, 125-127, 130, 131, 133-136, 143, 152, 174, 196, 228, 232, 252, 254,
256, 257, 259, 261, 262, 264, 265, 267, 269-272
Energy combustion, 259, 264
Energy conservation, 9, 12-14, 42, 43, 48, 119, 120
Energy consumption, 4, 7, 8, 12-15, 18, 39, 42-45, 68, 71, 72, 80, 89, 120, 122, 125, 127, 128, 157, 158, 164, 165, 199, 223, 224, 256, 266, 270
Energy efficiency, 7, 13, 19, 22, 36, 40-42, 44, 48, 220, 255, 256, 261, 262, 264, 265, 267-271
Energy efficiency enhancement, 256, 260
Energy intensity, 13, 39, 40, 42-44, 256, 257, 261
Energy intensity targets, 256
Energy-saving, 6
Energy structure, 4, 10, 25, 26, 30, 49, 250, 252, 254, 268, 271
Enhanced Coal Bed Methane (ECBM), 96
Enhanced coal bed methane recovery, ix
Enhanced Oil Recovery (EOR), 17, 18, 21, 28, 52, 61, 73, 84, 87, 96, 98, 99, 230,254
Environmental Impact Assessment (EIA), 26, 45
Environmental resource tax, 256
EOR technology, 23, 73
Emission Reduction Units (ERUs), 243
EU ETS, 18, 20
EU GHG Emission Trading System (EU-ETS), 185, 186, 197, 212, 213, 221, 222, 228, 229, 233, 234, 237
European Commission (EC), 19, 20, 185, 186, 228-230, 233
European Investment Bank (EIB), 233
European Union (EU), 18, 19, 24, 25, 37, 38, 185, 210, 220, 230, 233, 251, 252, 258, 271, 273
Europe Green Deal, 251
Eventually, 5, 15, 20, 184, 185, 187, 213, 258, 264
Excess capacity, 41, 42
F
Ferroalloy production, 80
Five Year Plan (FYP), 14, 25, 186
Fluorinated Gases, 250
Fossil, 256, 259, 264, 266, 269-271
Fossil fuel-intensive, 61
Fossil fuels, 7, 21, 44, 120, 171, 229, 240, 252, 255, 256, 259, 271
France, 213, 251
Free allocation, 221, 238
Fujian, 188, 202, 222, 223, 225, 226
Fujian Froestry Certified Emission Reduction (FFCER), 227
Full-chain, 53, 109
G
Gas-fired power plant, 20
Gas hydrate-based capture technology, 70
Gas reservoirs, 93, 94
Geological sequestration, 17, 20
Germany, 251, 257
GHG accounting, 228, 231, 232, 240
GHG emission, 3, 10, 12, 16, 18, 24, 29, 185, 186, 220, 228, 229, 232, 251
Global Carbon Capture and Storage Institute (GCCSI), 22, 23, 26, 84, 85, 98, 111, 112
Global CCS Institute, 4, 17, 19, 112
Gradual approach, 186, 213
Grandfather, 188, 193, 207, 212, 221-225, 229
Green, 11
Green assets, xiii
Green bond market, 255
Green bonds, 254, 255, 260, 271
Green economy, 4, 9, 11, 36, 219
Green financing, 271, 272
Green growth, 4, 9, 12, 25, 28, 29, 41, 237
Greenhouse effect, 61
Greenhouse Gas (GHG), 3, 27, 48, 185, 228, 250
Green insurance, 255, 271
Green loans, 255, 271, 272
Green procurement, 12
Green projects, 255
Green revolution, 271
Gross Domestic Product (GDP), 4, 5, 10, 13, 14, 25, 26, 36, 38, 41, 45, 49, 50, 186, 187, 201, 212, 222, 225, 252, 257, 259, 260, 262, 268, 270
Growth strategy, 15
Guangdong, 11, 183, 186-188, 190, 192-195, 200, 204-206, 211, 212, 221-223, 225-227, 233, 254, 258
H
Hawaii, 251
Heavy industry, 5, 22
HIsarna process, 72
Hot Blast Furnace Gas (HBFG), 158, 173-175
Huaneng group, 97
Hubei, 11, 183, 186-188, 193-196, 200, 204, 205, 208, 209, 211, 212, 222, 224, 226, 227, 254, 258
Hub-spoke cluster, ix
Hydraulic, 194
Hydrodynamic trapping, 90, 92
Hydrogen, 20, 22, 41, 64, 68, 69, 75, 79, 80, 98, 99, 113, 123, 149, 163, 220
I
International Emission Trading (IET), 243
India, 23, 37, 257, 258
Industrial guidelines, 13
Industrialization, 3, 4, 251
Industrial policy, 5
Industrial processes, 82, 260, 273
Industrial products, 5, 72
Industrial standards, 14
Industrial structure, 5, 13, 15, 45, 184, 187, 211, 213, 222, 272
Industrial transformation, 271
Industry thresholds, 12
Information, 13, 40, 86, 88, 90, 190, 191, 193, 194, 212, 229, 255
Information disclosure, 190, 191, 210, 255
Infrastructural outlays, 220
Innovation policies, 256
Integration, 53, 131-137, 140, 144, 145, 150-156, 159-170, 172, 173, 175
Inter-agency coordination, 9
Intergovernmental Panel on Climate Change (IPCC), 15, 86, 88, 89, 219, 250, 251,259
International commitments, 4, 10
International Energy Agency (IEA), 8, 12, 16, 20, 21, 23, 29, 35, 50, 51, 61, 97, 121, 220, 259, 261, 262
International Union for the Conservation of Nature (IUCN), 253
Investment, 16, 20-23, 53, 86, 97, 109, 117, 128, 132, 137-148, 152, 155, 156, 158, 161, 162, 164, 165, 171-173, 196, 210, 212, 232, 234, 254, 255, 258, 259, 269, 270
IPCC Special Report, 15, 219
Iron/steel, 6, 7, 13, 27, 29, 38, 42, 52, 53, 61, 110, 115, 119, 120, 130, 148, 149, 174-176, 220, 226-228, 230-238, 240
Ironmaking, 47, 62-64
J
Japan, 16, 22, 37, 38, 122, 257, 271
Jiangsu, 188, 202, 222
Joint Implementation (JI), 243
K
Key Performance Indicators (KPI), 189
Kyoto Protocol, 185, 222, 250
L
Large-Scale Integrated Projects (LSIP), 26, 28
Laws, 10, 11, 26
Leapfrogging, xiii
Legal framework, 22, 23, 231
Levels, 3-5, 9-14, 17, 18, 25, 26, 29, 40, 41, 44, 49-51, 53, 77, 93, 120, 129-131, 149, 155, 163, 164,
173, 185-187, 193, 198-200, 204, 205, 207-212, 222, 231, 233, 236, 240, 250-253, 255, 258, 261, 269
Linz-Donawitz Gas (LDG), 115-117, 119, 121, 163-166, 168-175
Long-process, 6, 41
Low-carbon, 4, 7, 9, 11-13, 15, 16, 18, 19, 22,23,25,27,28,36,38,41,43, 48, 53, 71, 187, 210, 233, 256, 271
Low-carbon scenario, 48, 49
Low-carbon strategy, 51
M
Mandatory tasks, 13
Market, 10-12, 14, 15, 18, 19, 35, 38, 41, 72, 81, 82, 131, 148, 183-188, 193, 195-197, 207, 210-213, 219-222, 225, 227, 230, 234-238, 249, 253-256, 258, 260, 261, 266, 270, 272
Market-Based Approach (MBA), 249, 253-255, 270, 271
Market inclusion, 256, 261, 266
Market principles, 213, 255
Mean Square Percent Error (MSPE), 209
Membranes capture technology, 68
Mergers and acquisitions, 13, 14
Methane, 3, 85, 98, 228, 250, 251
Methanol, 28, 81
Mexico, 18
Microalgae cultivation, 81
Microalgae technology, 81
Middle East, 21
Million Tons of Coal Equivalent (MTCE), 243
Mineral carbonation capture technology, 71, 120
Mineral process, 62
Mineral trapping, 91, 92
Ministry of Ecology and Environment (MEE), 9, 25, 27, 225, 227, 230
Ministry of Economy, Trade, and Industry (METI), 22
Ministry of environment, 55, 252
Ministry of Finance (MOF), 13-15
Ministry of Industry and Information Technology (MIIT), 9, 13, 42, 43
Ministry of Information Technology, 40
Ministry of Natural Resources (MNR), 9
Ministry of Science and Technology (MOST), 9, 28, 45, 143, 152, 237
Ministry of Transport (MOT), 12
Minsitry of Environmental Protection (MEP), 45
Mitigation, 4, 9, 16, 22, 25, 29, 35, 61, 227, 250, 252, 253, 268
Model, 36, 45, 47, 69, 72, 73, 85, 87, 94, 199, 213, 214, 250, 252, 259-261, 270, 272
Model parameters, 260
Molten iron pretreatment, 64
Monitoring, 18, 35, 45, 73, 84, 86, 87, 96, 189, 193, 212, 216, 225, 233, 235
Monitoring, Reporting and Verification (MRV), 35, 189, 193, 212, 225, 228, 233, 235-238
Monoethanolamine (MEA), 68, 121, 122
MRV system, 212, 233
N
${\mathrm{N}}_{2}\mathrm{O},3,{188},{250}$
National Allocation Plans (NAP), 243
Naature-Based Solutions (NBS), 249, 253
National Basic Research Program of China, 253
National Bureau of Statistics (NBS), 5, 253, 260, 271, 272
National Center for Climate Change Strategy and International Cooperation (NCSC), 45, 47, 51
National Development and Reform Commission (NDRC), 9-13, 27, 42, 43, 45, 186, 188, 191, 194, 225, 227, 229, 230, 236, 237, 240
National ETS, 10, 14, 15, 53, 184, 187, 205, 212, 213, 219, 225-228, 230, 231, 233, 236, 238, 254, 273
Nationally Determined Contributions (NDC), 27, 251
National People’s Congress (NPC), 11, 227
National Railway Administration (NRA), 12
National Technical Committee on Carbon Management (NTCC), 12
National Trust of Australia (NSW), 185, 216
Nature gas, 125
Near net-zero carbon scenario, 48
Negative carbon, 11, 254
Negative externalities, vi
Netherlands, 3, 19, 71
New Entrant Reserve (NER), 233, 234
New Normal, 5, 6
New York, 251
New Zealand, 251
Nitrous Oxide, 3, 228, 250
Nonferrous metals, 13, 204, 223, 224, 226, 235
Non-fossil fuels, 4, 10, 25, 26, 45, 271
Non-fossil targets, 255
Nordhaus, 250
North Africa, 21
Norway, 16, 20, 21, 98, 213
Nuclear energy, 267
O
Offshore sequestration, viii
Offshore wind power, 261
Oil, 18, 20, 21, 26, 30, 48, 73, 91-94, 96, 97, 111, 114, 120, 148, 224, 254, 267
Oil reservoirs, 89
Onshore, 20, 83, 89, 99, 230, 258
Onshore saline aquifer, 28
Onshore wind power, 261
Overcapacity, 7, 13-15, 38, 41, 42
P
Paper-making, 13, 15, 185
Paris Agreement, 3, 22, 25, 29, 43, 51, 61, 97, 219, 250, 251
Paris Climate Change Conference, 4, 10
Pathways, 13, 23, 109, 220
Pelletizing, 47, 63
People’s Bank of China (PBOC), 255, 272
Performance threshold, 12
Petrochemical, 5, 7, 13, 185, 223-225, 235
Phase-in periods, 213
Photovoltaic, 258, 261
Photovoltaic solar panels, 258
Physical absorption, 66, 68, 120, 122, 126, 129
Pilots, 9-11, 14, 15, 18, 21, 22, 27, 28, 45, 51, 53, 71, 82, 121-123, 183, 184, 186-202, 204, 205, 207, 208, 210-213, 219-230, 233, 235, 237, 254, 255, 258, 260, 271
Pipeline, 18, 26, 28, 83-90, 114, 129, 130, 152, 154, 157, 160, 164, 165, 167-170, 230, 259
PMCN, 250, 259, 260
PMCN,250, 259, 260
Policy
instrument, 12, 13, 36, 191, 219, 255, 256, 267, 270
portfolios, 260, 267-269
Power sector, 10, 14, 15, 29, 30, 35, 40, 41, 221, 225, 228, 234, 235, 237, 238, 254, 258, 273
Pre-industrial, 3, 29
Pressure Swing Adsorption (PSA), 66, 123, 126, 127, 131-137, 138, 140-173, 175
Primary market, 221
Production capacity, 6, 12, 14, 15, 38, 42, 49, 77
Product structure, 6
Projection, 45, 222, 250, 264
Proximity study, 90
Public Policy Approach (PPA), 249, 250, 253, 255, 256, 260-264, 266, 267, 269-271
Pu Hui Certified Emission Reduction (PHCERs), 194
R
Reality check, 25, 29
Refining outside the furnace process, 65
Regional diversity, 15
Regulation, 9-11, 24, 26, 118, 187, 226, 227, 230
Regulatory framework, 4, 16, 23, 24, 193, 237, 256
Renewable energy, 21-24, 233, 234, 255, 257, 258, 260-262, 264, 265, 267, 268, 270, 273
Reporting, 10, 12, 35, 43, 188, 189, 193, 212, 216, 225, 228, 233, 235, 240, 242
Research and Development Program of China, 254
Resource allocation, 271
Resource-intensive, 7
Risk assessment, xiii
Risk management, 271
Ronald Coarse, 184, 207
S
SACC-CCUS model of simulation, 48
SACC model, 46, 48
Safety standards, 12, 26
Saline aquifers, 89, 90, 92-95, 97
Saudi Arabia, 21, 99
Scenarios, 19, 45, 48, 250, 254, 260-270
Scotland, 20, 251
Scrap steel recycling, 49
Sea transport, 28
Secondary refining process, 78
Seepage emissions, 232
Sensor technology, 271
Shanghai, 11, 72, 74, 75, 183, 186-188, 192-196
Shenhua Group, 97
Shenzhen, 11, 183, 186-188, 192-196, 200, 205, 211, 212, 222, 224-226, 254,258
Shifting, 21, 196
Shipbuilding, xii
Short-process, 6
Short-process steel production, 6
Simulation, 36, 45, 48, 52, 94, 205, 272
Sink-source matching, 53
Sinopec, 97
Sinopec Zhongyuan Oilfield, 28
Sintering, 47, 62, 63, 110, 228
Smart-cities, 271
${\mathrm{{SO}}}_{2},{68},{113},{185}$
Solar, 26, 265
Solar energy, 81, 257
Solubility trapping, 92
Source-sink clusters, ix
Source-sink matching, ix
Source-sink optimization, 23
South Africa, 231
South America, 17
South Korea, 6, 38, 83, 251
Standard coal, 13, 225, 267
Standardization Administration of China (SAC), 12, 13
State Council, 11, 13, 15, 27, 38, 42-44, 225, 237
State Forestry Administration (SFA), 12
Steel, 6, 7, 12, 13, 15, 22, 27, 35-44, 48, 53, 61, 62, 64, 65, 71, 74, 75, 77-80, 82, 85, 89, 99, 109-112, 115, 116, 119, 152, 176, 185, 188, 220, 223-225, 227-229, 232, 235, 238, 241, 258, 261, 273
Steel consumption, 38
Steelmaking, 6, 40, 41, 47, 49, 50, 53, 55, 61-64, 75, 76
Steel making process, 74, 225
Steel production, 6, 14, 21, 36-40, 42, 43, 62, 76-79, 82, 99, 110, 129, 229
Steel rolling, 62, 63, 65, 110
Steel sector, 4, 6-9, 13-15, 27-29, 35-45, 47-54, 110, 220, 223-225, 227-229, 233-235, 238
Stern Report, 19
Sticks, 9, 10, 12, 15
Storage, 18-26, 28, 53, 61, 72, 73, 83, 85, 87, 88, 90, 92-99, 113, 116-118, 125, 129-132, 135-137, 146, 149, 153-156, 158, 160-164, 168, 169, 171-173, 228, 230, 232, 235
Storage capacity, 23, 90, 93, 95
Strategic path, 260
Strategic pathway, 9, 29
Strategic reserve technology, 26
Strategic roadmap, 51, 52
Strategy Analysis of Climate in China (SACC), 45
Structural adjustment, 12, 13, 220
Structural trapping, 90-92
Substitution elasticity, 259
Supply-side reform, 15, 41
Sustainable growth, 9, 11, 17, 237
Sweden, 77, 251
Synthetic control, 184, 197-200, 208
System design, 84, 87
T
Takeaways, 184, 210, 250, 270
Tanker, 28, 83, 84, 87, 129, 134, 136
Technology, 4, 6, 13, 16, 18, 19, 21-24, 27-29, 35, 41, 43-45, 48, 50-53, 62, 66-71, 73, 75, 78, 80-82, 84, 92, 94, 97, 110, 120-122, 125-128, 131-147, 150-156, 158-162, 165-172, 174, 175, 196, 237, 254, 255, 270-273
Technology Center Mongstad (TCM), 21
Temperature Swing Adsorption (TSA), 66, 67, 123, 127, 129
Terrestrial ecosystem, 272
TGR-BF, 53
Tianjin, 11, 183, 186-188, 192-196, 200, 205, 206, 209, 211, 212, 222, 224, 226, 254, 258
Top-Pressure Recovery Turbine Plant (TRT), 64, 114, 115, 119, 130-144, 146, 147, 173
Tragedy of the commons, 250
Trans border carbon taxes, 20, 273
Transparency, 193, 210, 212, 255
Transport, 12, 18, 19, 23, 26, 28, 31, 51, 53, 61, 70, 83-90, 95, 125, 230, 232, 259
Transport technology, 84, 87
Trapping mechanisms of ${\mathrm{{CO}}}_{2},{90}$
Two-track system, 15
U
UK Emissions Trading Group, 185
Ultra Low CO2 Steelmaking (ULCOS), 53, 126
UN Framework Convention for Climate Change (UNFCCC), 10, 13, 185, 186, 231, 250, 251
UN General Assembly, 4, 249
United Arab Emirates (UAE), 21
United Nations, 38, 271
United States, The, 6, 17, 27, 73, 252, 271
Urbanization, 5, 38, 45, 251, 271
US Carbon Capture and Storage Early Deployment Act, 16
V
Vacuum Pressure Swing Adsorption (VPSA), 66, 123
Verification, 35, 190, 193, 194, 225
W
Welsh, 251
William Nordhaus, 214, 250
Wind, 26, 118, 257, 261, 265, 270
Wind energy, 257, 258
World financial crisis, 5
World Steel Association, 6, 36, 40
World Trade Organisation (WTO), 37
X
Xi Jinping, 4, 5, 41, 249, 271
Xinjiang, 28, 188, 203, 222
Xinjiang Dunhua Petroleum, 28
Z
Zero carbon, 11, 20, 49, 81, 251, 260, 270
Zhejiang, 188, 203, 222